이전 포스팅에 이어서 tutorial을 진행해보겠습니다.
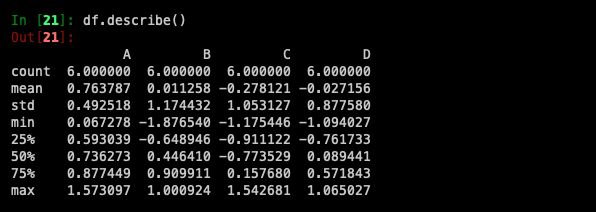
describe()를 사용하면 데이터를 통계적으로 빠르게 볼 수 있습니다.
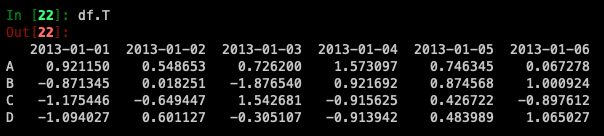
Transposing your data:
Sorting by an axis:
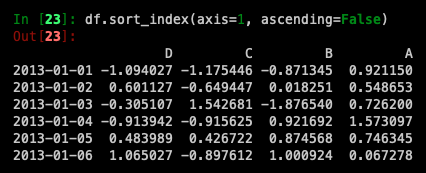
*데이터는 기본적으로 오름차순으로 정렬되지만 ascending=False를 사용하면 내림차순으로 정렬됩니다.
Sorting by values:
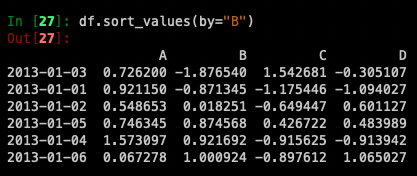
*데이터가 B column을 중심으로 정렬된 것을 확인할 수 있습니다.
Getting
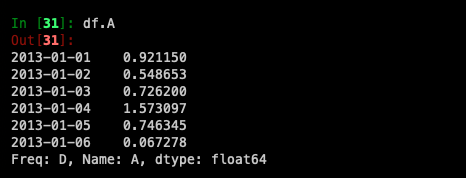
Selecting a single column
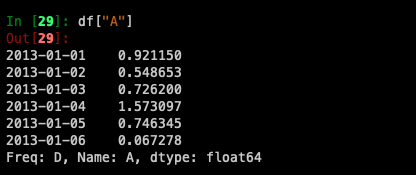
df.A도 같은 결과가 나오는 것을 확인할 수 있습니다.
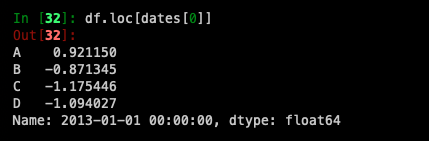
Selection by label
For getting a cross section using a label
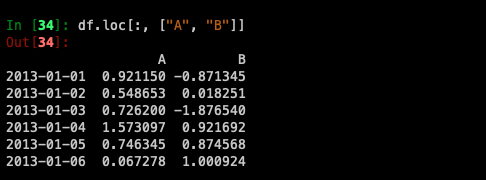
Selecting on a multi-axis by label
df.loc[[행],[열]]
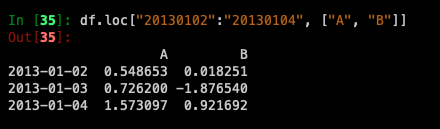
Showing label slicing, both endpoints are included:
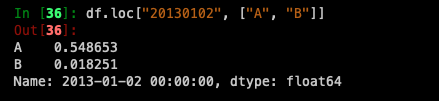
Reduction in the dimensions of the returned object:
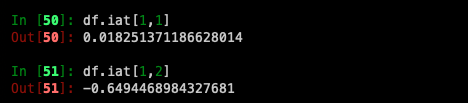
For getting a scalar value:

For getting fast access to a scalar (equivalent to the prior method):

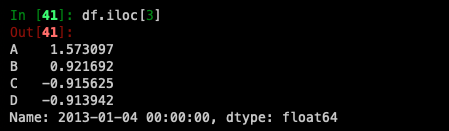
Selecting by position
*iloc는 integer position을 통해 값을 찾는다면 loc는 label을 통해서 값을 찾는다.
Select via the position of the passed integers:
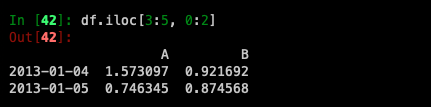
By integer slices, acting similar to NumPy/Python:
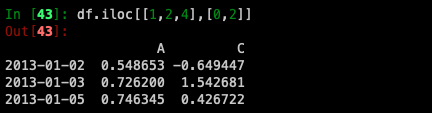
By lists of integer position locations, similar to the NumPy/Python style:
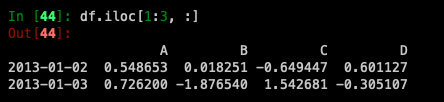
For slicing rows explicitly:
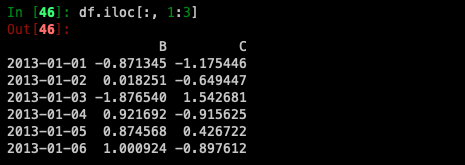
For slicing columns explicitly:
For getting a value explicitly:

For getting fast access to a scalar (equivalent to the prior method):