간단한 정의
PDP는 Partial Dependence Plots(부분의존도그림)의 약자로 개별 특성이 타겟에 어떤 영향을 미쳤는지 그래프로 쉽게 알 수 있는 방법이다.
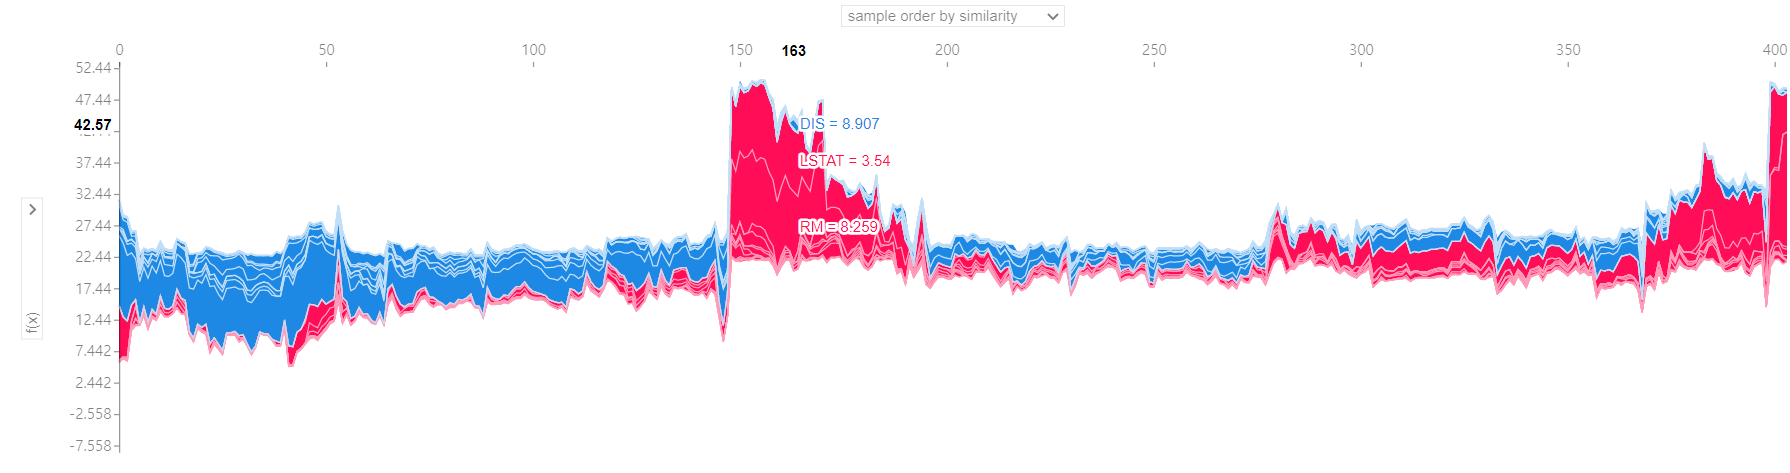
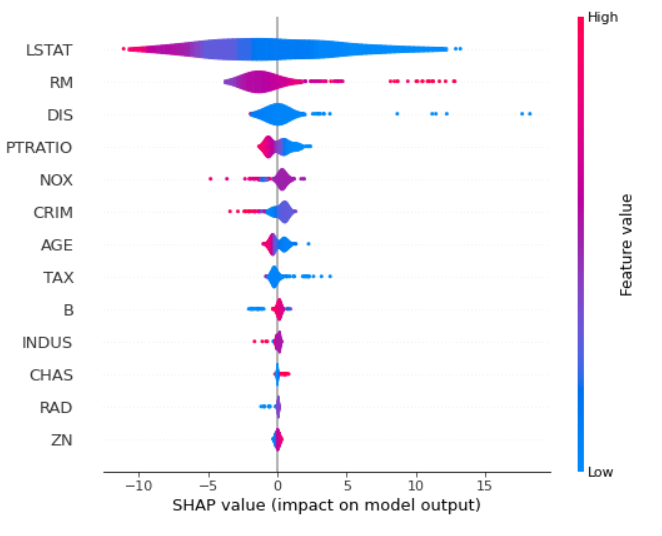
그리고 Shap은 단일 관측치로부터 특성들의 기여도(feature attribution)를 계산하기 위한 방법으로 라이브러리를 이용해 간편하게 사용할 수 있다.
PDP (Partial Dependence Plots)
PDP는 ICE(Individual Conditional Expectation) curve의 평균인 그래프이다. ICE curve는 특성 하나가 각 관측치의 타겟에 미치는 영향을 그린 그래프이다. PDP는 특성 하나가 전체 target의 평균에 미치는 영향을 그렸다고 할 수 있다.
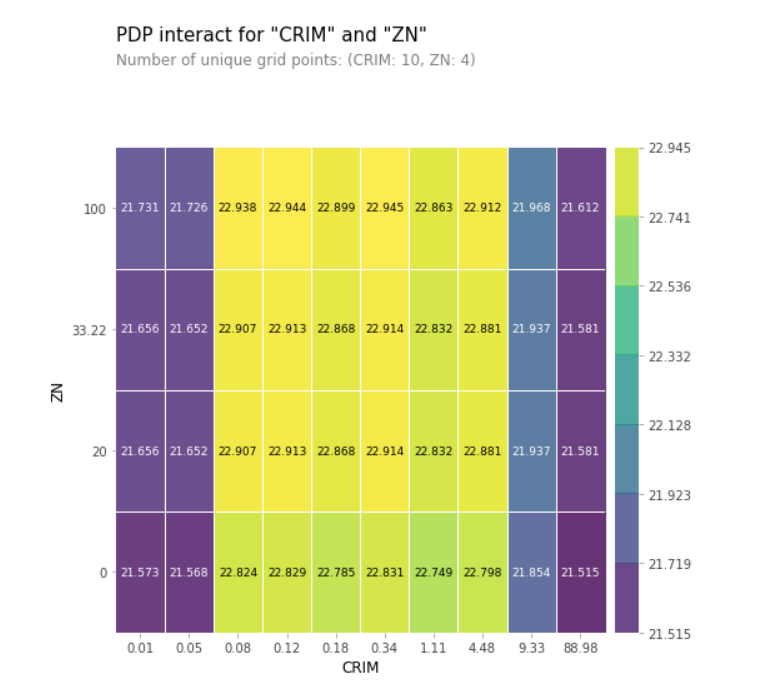
또한, PDP는 하나 혹은 두개의 특성을 사용할 수 있다. 하나의 특성을 사용할 때는 pdp_isolate 라이브러리를 사용하고, 두개의 특성을 사용할 때는 pdp_interact 라이브러리를 사용하면 된다.
isolated = pdp_isolate(
  model = model,
  dataset = X_train,
  model_features = X_train.columns,
  feature = 관찰하고자 하는 feature,
  grid_type = 'precentile' or 'equal',
  num_grid_points = 100 # 특성의 변화를 특정할 특성 값. 포인트 하나마다 예측을 수행함.
)

pdp_plot(isolated, feature_name = 관찰하고자 하는 feature);
plt.xlim(100,1000) # 그래프에서 해당 구간 범위까지 확대해서 보여줌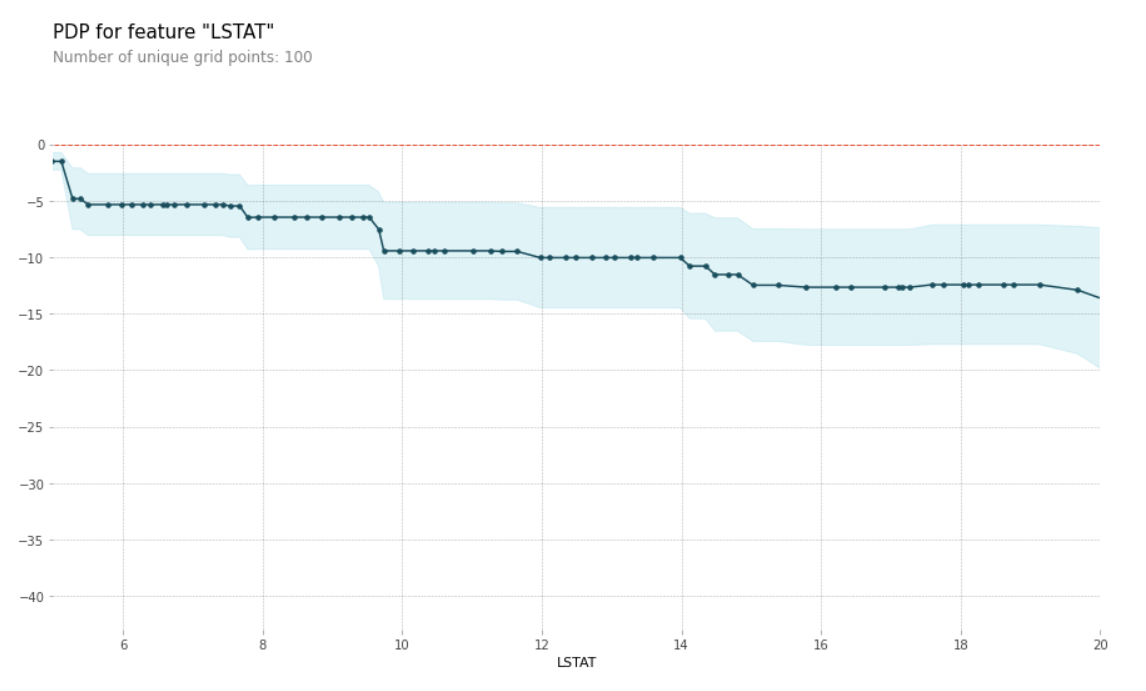
features = [관찰하려는 feature1, feature2]

interaction = pdp_interact(
	model = model,
    dataset = X_train,
    model_features = X_train.columns,
    features = features
)

pdp_interact_plot(
    interaction,
    plot_type = 'grid' or 'contour',
    feature_names = features
)
Shap
~ 섹션리뷰시간에 내용추가예정...~
shap.force_plot
shap.summary_plot(plot_type = 'violin')
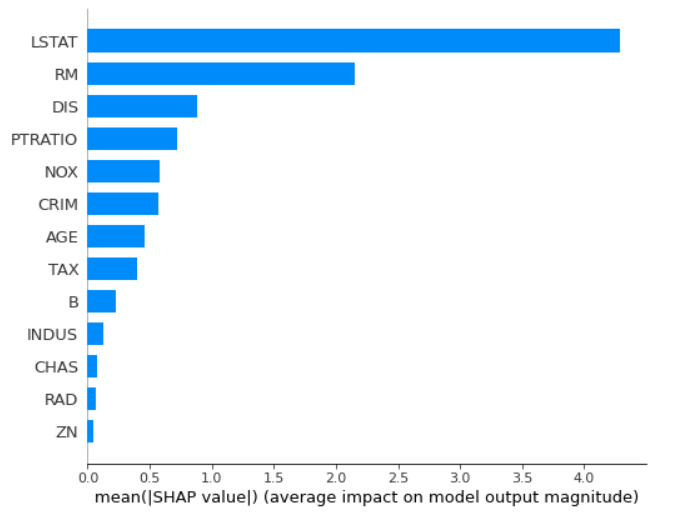
shap.summary_plot(plot_type = 'bar')

우당탕탕 코린이