1. Seaborn
x = np.linspace(0, 14, 100)
y1 = np.sin(x)
y2 = 2 * np.sin(x + 0.5)
y3 = 3 * np.sin(x + 1.0)
y4 = 4 * np.sin(x + 1.5)
plt.figure(figsize=(10, 6))
plt.plot(x, y1, x, y2, x, y3, x, y4)
plt.show()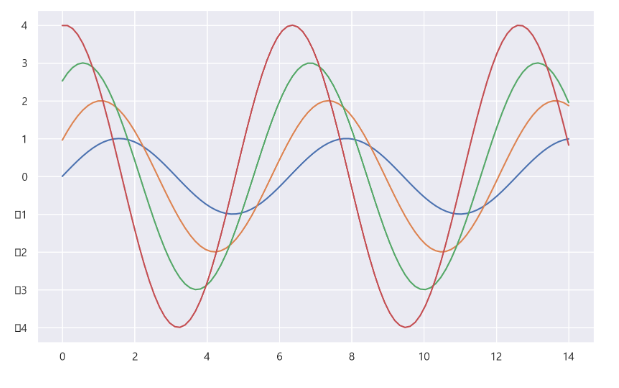
2. 그래프 배경 설정
- sns.set_style( )
- "white", "whitegrid", "dark", "darkgrid"
# "white"
sns.set_style("white")
plt.figure(figsize=(10, 6))
plt.plot(x, y1, x, y2, x, y3, x, y4)
plt.show()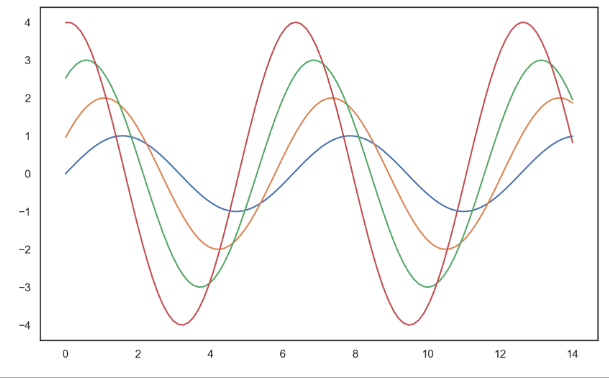
# "whitegrid"

sns.set_style("white")
plt.figure(figsize=(10, 6))
plt.plot(x, y1, x, y2, x, y3, x, y4)
plt.show()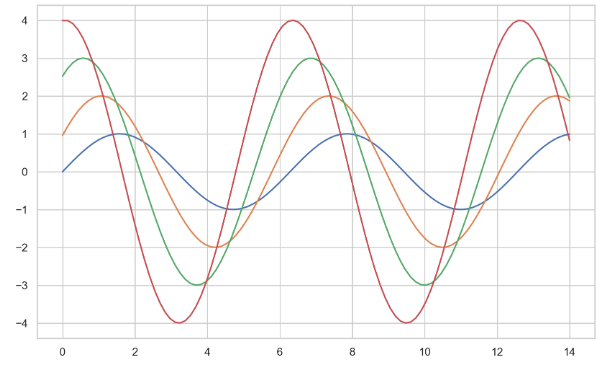
# "dark"

sns.set_style("white")
plt.figure(figsize=(10, 6))
plt.plot(x, y1, x, y2, x, y3, x, y4)
plt.show()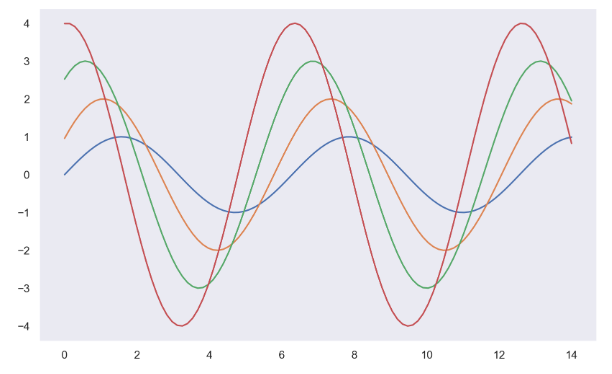
# "darkgrid"

sns.set_style("white")
plt.figure(figsize=(10, 6))
plt.plot(x, y1, x, y2, x, y3, x, y4)
plt.show()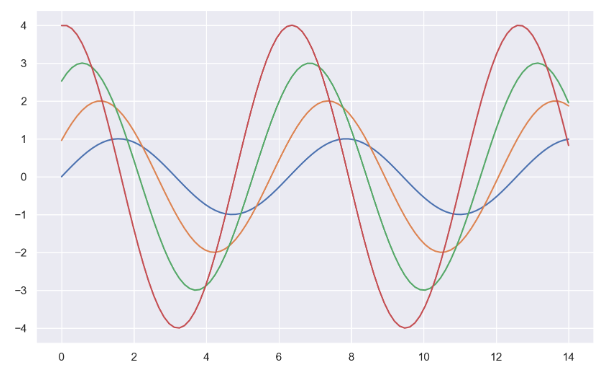
3. Boxplot
tips = sns.load_dataset("tips")
tips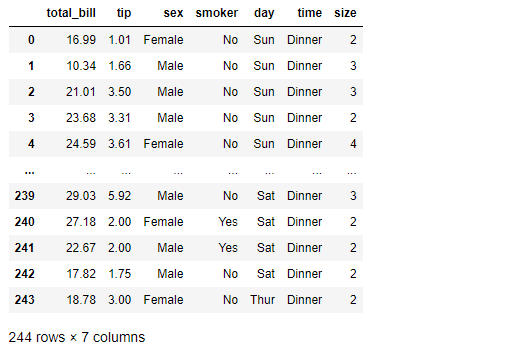
tips.info()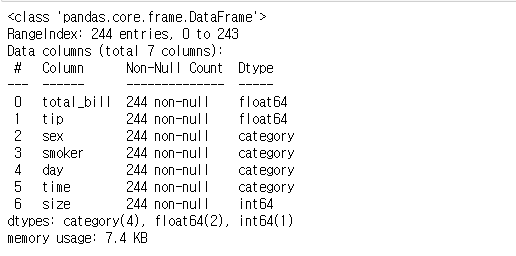
"sex", "smoker", "day", "time"는 범주형 자료인 것을 확인
plt.figure(figsize=(8, 6))
sns.boxplot(x=tips["total_bill"])
plt.show()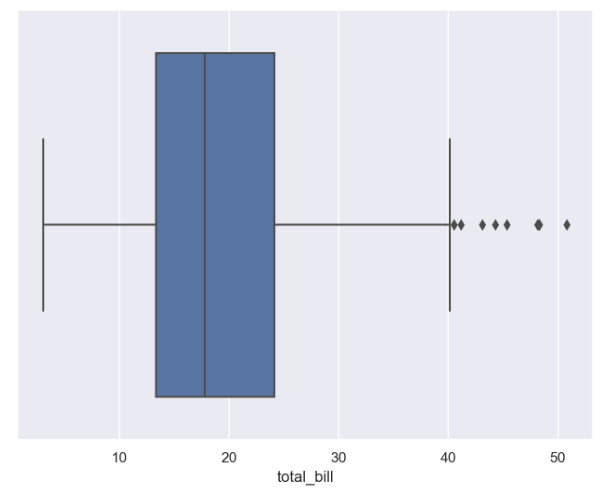
tips["day"].unique()
day로 컬럼을 지정하여 여러 boxplot을 그려보자
plt.figure(figsize=(8, 6))
sns.boxplot(x="day", y="total_bill", data=tips)
plt.show()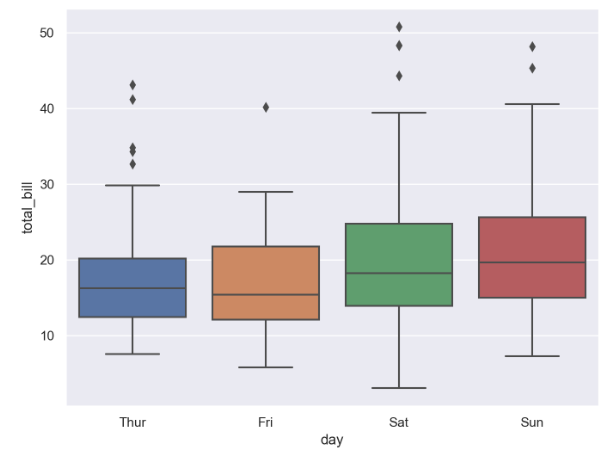
tips.head(2)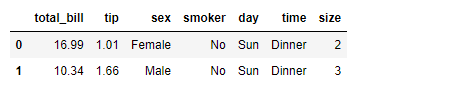
smoker을 범례로 지정하여 다시 boxplot을 그려보자
plt.figure(figsize=(8, 6))
sns.boxplot(x="day", y="total_bill", data=tips, hue="smoker", palette="Set2")
plt.show()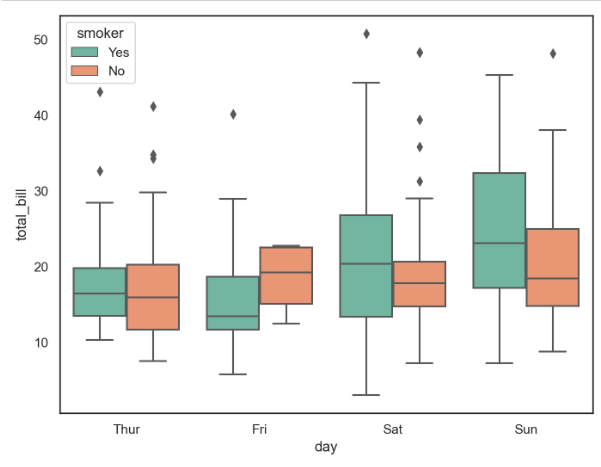
4. Swarmplot
plt.figure(figsize=(8, 6))
sns.swarmplot(x="day", y="total_bill", data=tips, color="0.5")
plt.show()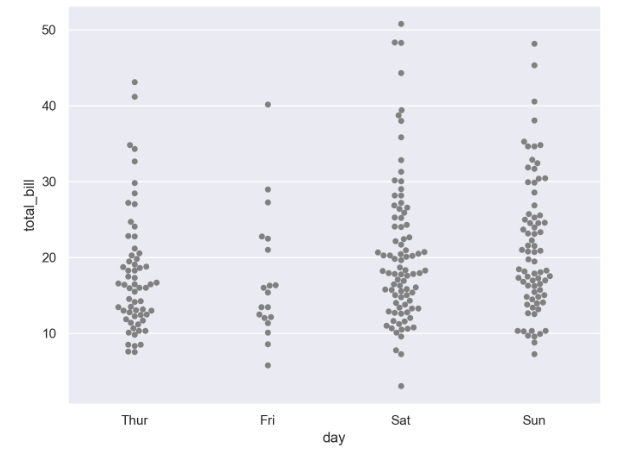
boxplot과 swarmplot을 함께 그려보자
plt.figure(figsize=(8, 6))
sns.boxplot(x="day", y="total_bill", data=tips)
sns.swarmplot(x="day", y="total_bill", data=tips, color="0.25")
plt.show()

데이터 관련 학습 일지