1. 수치형 데이터 컬럼의 이상치(Outlier) 찾기
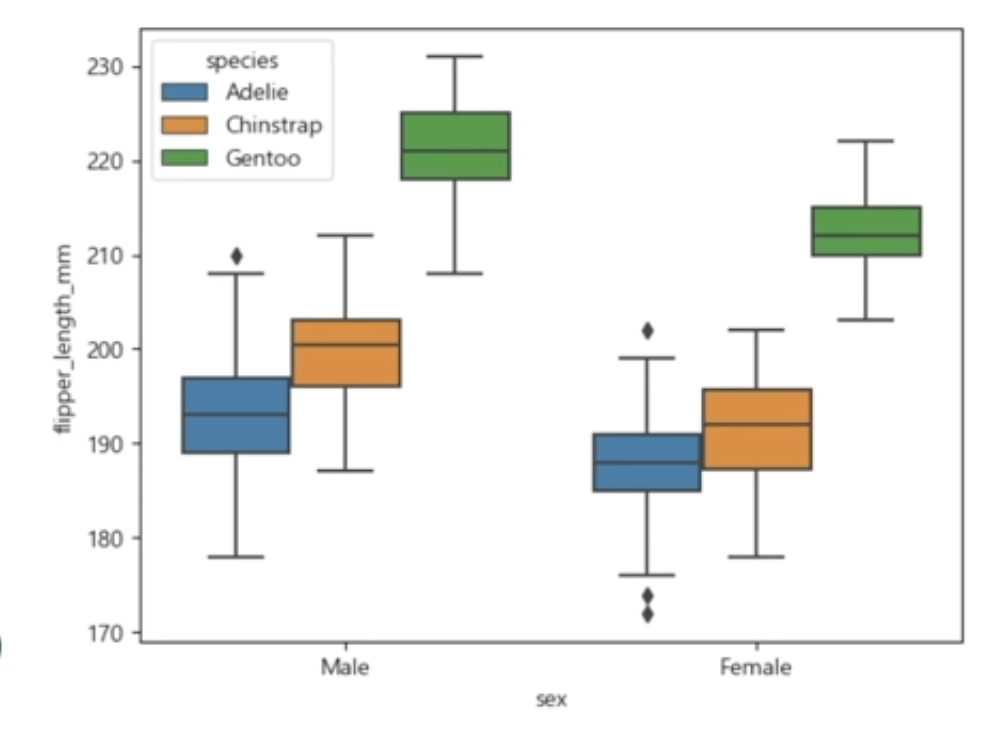
1.1 seaborn.boxplot
seaborn.boxplot(data=None, x=None, y=None, hue=None)-
data: 사용할 데이터
-
x, y: x와 y축
-
hue: 종류
-
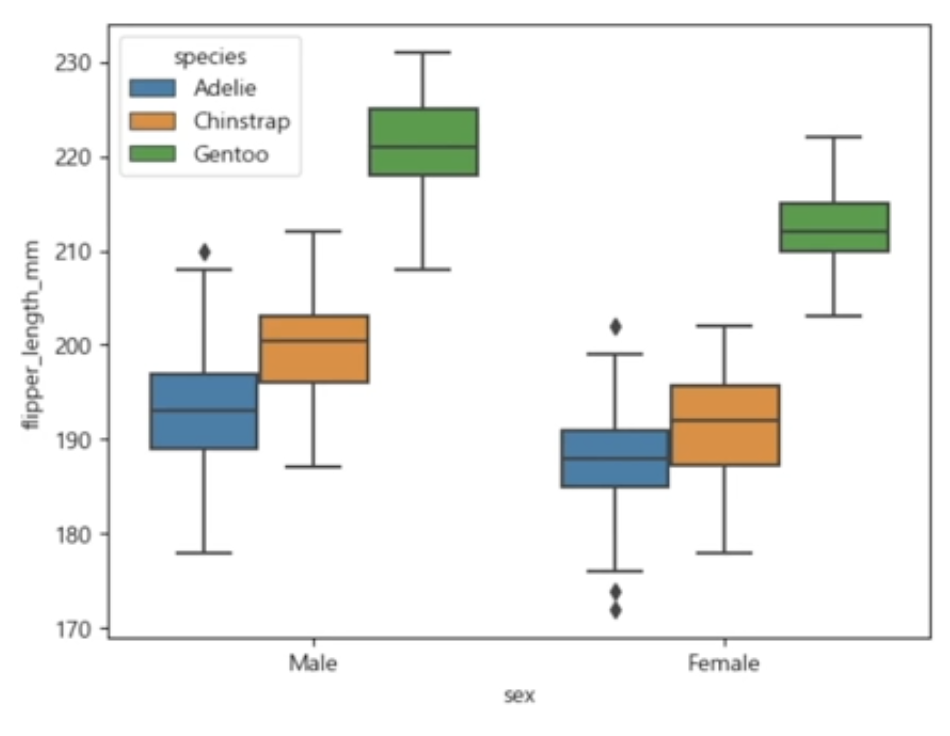
sym: symbol
- docs에 특별히 나와있지 않음
- 앞에 색 (r, b 등)
- 뒤에 모양 (s: 네모, o: 동그라미, +: + 모양)

거북선통통통통
seaborn.boxplot(data=None, x=None, y=None, hue=None)data: 사용할 데이터
x, y: x와 y축
hue: 종류
sym: symbol