Sampling distribution
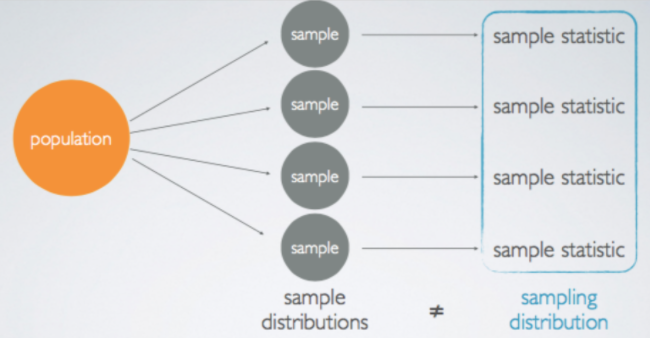
Sampling distribution is the distribution of the means of sample statistics where the samples are taken from a particular population with the same sample size, n.
Standard Error
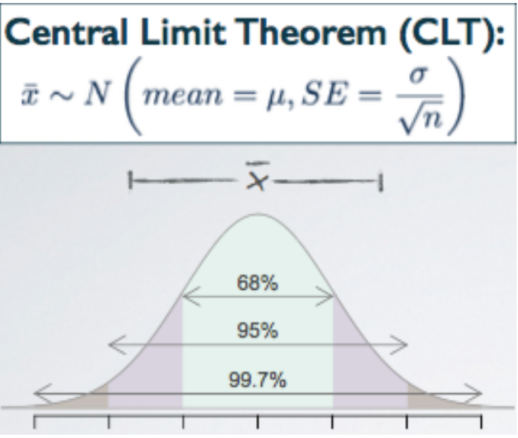
Central Limit Theorem
The distribution of sample statistics is nearly normal, centered at the population mean, and with the standard error.
Conditions for CLT
Independence: Sampled observations must be independent
Sample size/skew: Either the population distribution is normal, or if the population distribution is skewed, the sample size is large (rule of thumb: n > 30)
Margin of error
Margin of error is calculated by a z score times standard error. It expresses the maximum expected difference between the true population parameter and a sample estimate of that parameter
Why Confidence Interval
If we report a point estimate, we probably won’t hit the exact population parameter. But if we report a range of plausible values we have a good shot at capturing the parameter.
Confidence Interval (for a population mean)
A plausible range of values for the population parameter. Computed as the sample mean +- a margin of error (critical value corresponding to the middle XX% of the normal distribution times the standard error of the sampling distribution.)
Conditions for CL
Independence: Sampled observations must be independent
Sample size/skew: n>= 30, larger if the population distribution is very skewed.
Confidence Level
You can build a confidence interval from a sample using the equation above. For 95%, the rule of thumb tells the corresponding z score is 2, but this is just an approximation. The real z score for 95% is 1.96. So the formula would be
Suppose you took many samples and built a confidence interval from each sample using this equation. Then about 95% of those intervals would contain the true population mean(mu)
In this case, the proportion turns out to be 96% but it will approach to 95% as with more samples taken.
Confidence level, interval width, Accuracy, Precision and Sample size
By increasing the confidence level from 95% to 99%, you can have wider intervals from each sample and it would be more likely for each interval to contain the population parameter. Then the accuracy would go up as the result. However, the precision would fall. What is meant by precision is that, for instance, say you are trying to predict tomorrow’s temperature and you come up with an interval between -20C and 50C. It is highly likely that the actual temperature would fall in between, but this information is useless since you cannot even decide upon what to wear tomorrow. In this case, accuracy is high and precision is low. You can reduce the width of the interval but that will cause the accuracy to be lower (there is trade-off between these two.) In order to get the best of both; higher precision and higher accuracy, the only way is to increase the sample size.
Required sample size for Margin of Error
You can determine the required sample size to achieve the desired margin of error with the formula by simply making n the subject.
1) For each of the following situations, state whether the variable is categorical or numerical, and whether the parameter of interest is a mean or a proportion.
ans: Categorical (agree / disagree), the parameter of interest is a proportion
ans: Numerical(percentage), the parameter of interest is a mean
2) Suppose heights of all women in the US have a mean of 63.7 inches, and a random sample of 100 women’s heights yield a sample mean of 65.2 inches. Which one is the population parameter and which one is the point estimate? Which one is μ and which one is x¯?
ans: population parameter(μ) = 63.7, point estimate(x¯) = 65.2
3) Suppose heights of all women in the US have a standard deviation of 2.7 inches, and a random sample of 100 women’s heights yields a standard deviation of 4 inches. Which one is the population parameter and which one is the point estimate? Which one is σ and which one is s?
ans: population parameter(σ) = 2.7, point estimate(s) = 4
4) Explain, in plain English, what is going on in Figure 4.8 of the book (page 175).
5) List the conditions necessary for the CLT to hold. Make sure to list alternative conditions for when we know the population distribution is normal vs. when we don’t know what the population distribution is, and the when the sample size is barely over 30 vs. when it’s very large.
When the population distribution is normal, independence.
When the population distribution is unknown, sample size even larger than 30, independence.
When the sample size is barely over 30, independence
When the sample size is very large, independence
6) Confirm that z⋆ for a 98% confidence level is 2.33. (Include a sketch of the normal curve in your response.)
7) Calculate a 95% confidence interval for the average height of US women using a random sample of 100 women where the sample mean is 63 inches and the sample standard deviation is 3 inches, and interpret this interval in context of the data.
ans:
Margin of Error = 0.588
The 95% confidence interval contains the values between 62.412 and 63.588.
1) We are 95% confident that the heights of all US women is on average 62.412 to 63.588.
2) 95% of random samples of 100 US women will yield confidence intervals that contain the true average height of US women.
8) Explain, in plain English, the difference between standard error and margin of error.
Standard error refers to the population standard deviation (or the sample standard deviation) divided by square root of the sample size. It is the standard deviation of the sampling distribution of a statistic.
Margin of error is calculated by a z score times standard error. It expresses the maximum expected difference between the true population parameter and a sample estimate of that parameter
9) A little more challenging: Suppose heights of all men in the US have a mean of 69.1 inches and a standard deviation of 2.9 inches. What is the probability that a random sample of 100 men will yield a sample average less than 70 inches? (Hint: First check if we should expect the sample mean to be distributed nearly normally, i.e. if the CLT holds. If so, sketch a normal curve with mean μ and the appropriate standard error. Shade the area you’re interested in, and calculate it using methods we learned in the previous unit.)
100 men selected randomly -> independence check
sample size > 30 -> normality check
The rest are all yours :)