Statistics
1.Intro to Statistics

StatisticsThe science of collecting, organizing, presenting, analyzing and interpreting data to assist in making more effective decisions.Types of Sta
2.Describing Data
Graphically1\. Frequency distribution(table)2\. Bar chart(discrete)3\. Histogram(continuous)4\. Frequency polygon5\. Dot plot6\. Pareto chartPareto ch
3.Probability
1\. Random ExperimentConsider an Action or a Process that will have the following characteristics.Two or more outcomesUncertainty as to which outcome
4.Discrete Probability Distribution
Discrete Probability Distributionmean = μ = ∑x · p(x) = E(x) = expected value of xvariance = sd^2 = ∑(x-μ)^2 · p(x) Binomial Probability DistributionE
5.Continuous Probability Distribution
Normal Distribution1\. Bell Shaped2\. Symmetrical3\. AsymptoticParametres of Normal Distributionmu, standard deviationStandard Normal DistributionNorm
6.Sampling methods
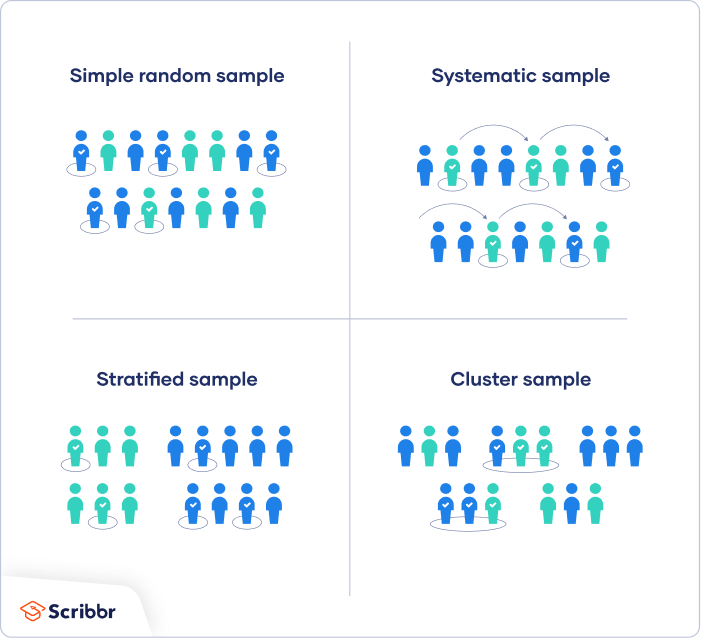
In stratified sampling, the strata must be homogenous and also collectively exhaustive, and mutually exclusive as well. The strata must define a part
7.Duke University: Central Limit Theorem
Sampling distribution Sampling distribution is the distribution of the means of sample statistics where the samples are taken from a particular popul
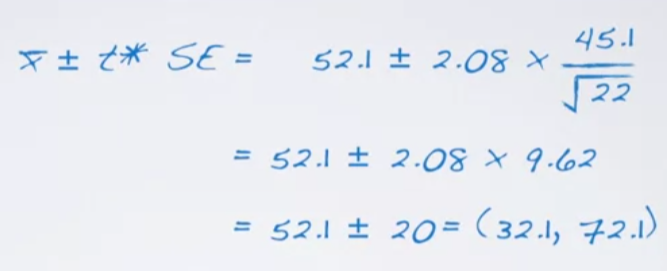
8.Duke University: Confidence Interval & Margin of Error
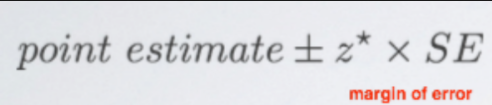
Margin of errorMargin of error is calculated by a z score times standard error. It expresses the maximum expected difference between the true populati
9.Duke University: Hypothesis testing & Confidence Level
Via simulation (Unit 1)Via theoretical methods that rely on the CLT (this Unit)Null hypothesisOften either a skeptical perspective or a claim to be te
10.Duke University: Decision Errors
The likelihood of making a type 1 error and likelihood of making a type 2 error are actually inversely proportional. So, it's actually not that easy t
11.Duke University: Significance vs Confidence Level
The interplay between significance levels used in hypothesis testing as well as confidence levels used in construction of confidence intervals.So far,
12.Duke University: Statistical vs Practical Significance
Statistical vs Practical SignificanceIncrease in sample size -> decrease in standard error -> increase test statistic -> smaller p valueA z-score of 2
13.Duke University : T-distribution
Review: What purpose does a large sample serve?With independent observations and not extremely skewed population distribution, a large sample would en
14.Duke University: Inference for a mean
T - distribution Review: What purpose does a large sample serve? With independent observations and not extremely skewed population distribution, a l
15.Duke University : Inference for Comparing Two Independent Means
2 Steps: Construct a confidence Interval, Conduct a hypothesis testConditions1) IndependenceWithin groups: sampled observations must be independento R
16.Duke University : Inference for Comparing Two Paired Means
(much like the ‘inference of a mean’ with a new column of difference)Paired DataWhen two sets of observations have this special correspondence (not in
17.Duke University : Power of The Test
Type 1 error is rejecting H0 when you shouldn’t have, and the probability of doing so is alpha (significance level)Type 2 error is failing to reject H
18.Duke University : Comparing many means(ANOVA)
Comparing Many Means(ANOVA)These plots show how much groups with means are likely to be significant from each other.There are more than two means to c
19.Duke University : Sampling Variability and CLT for Categorical Data
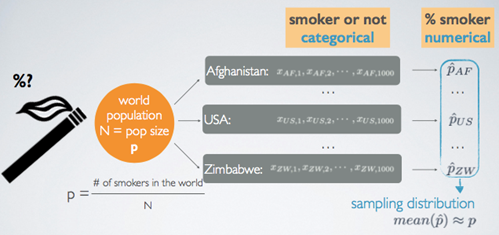
Sampling Variability and CLT for Categorical DataSampling Distribution for Categorical DataRemember a sampling distribution is different from a sample
20.Duke University : Confidence interval for a proportion
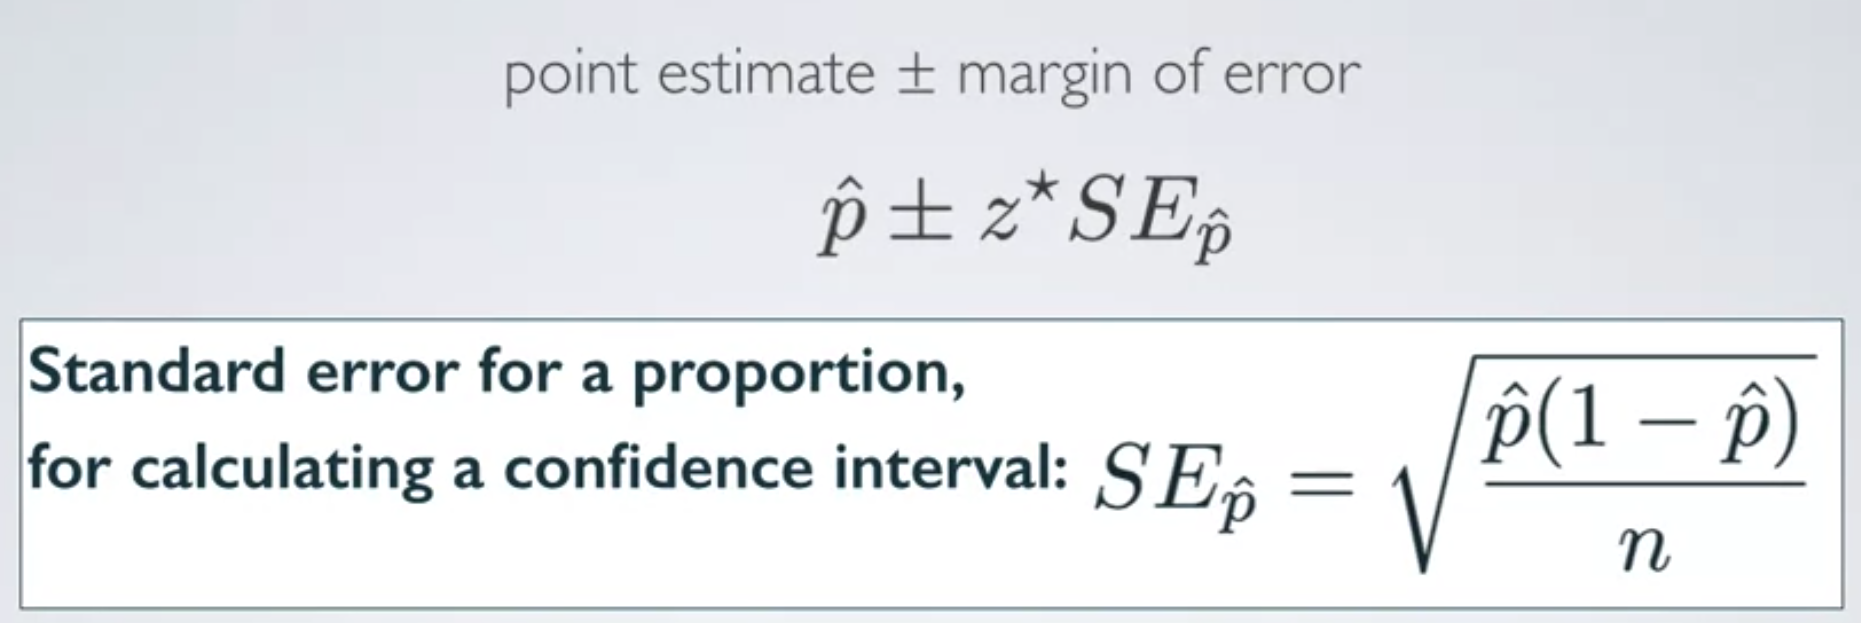
Estimating a ProportionParameter of Interest p \- eg. Percentage of all Americans who have good intuition about experimental design.Point Estimate p
21.Duke University : Hypothesis Test for a Single Proportion
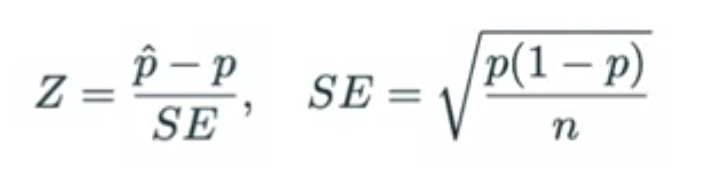
INSTRUCTIONSSet the hypothesisH0 : p = null valueH1 : p < or > or != null valueCheck conditionsIndependence: Sampled observations must be independe
22.Duke University : Estimating the difference between two proportions
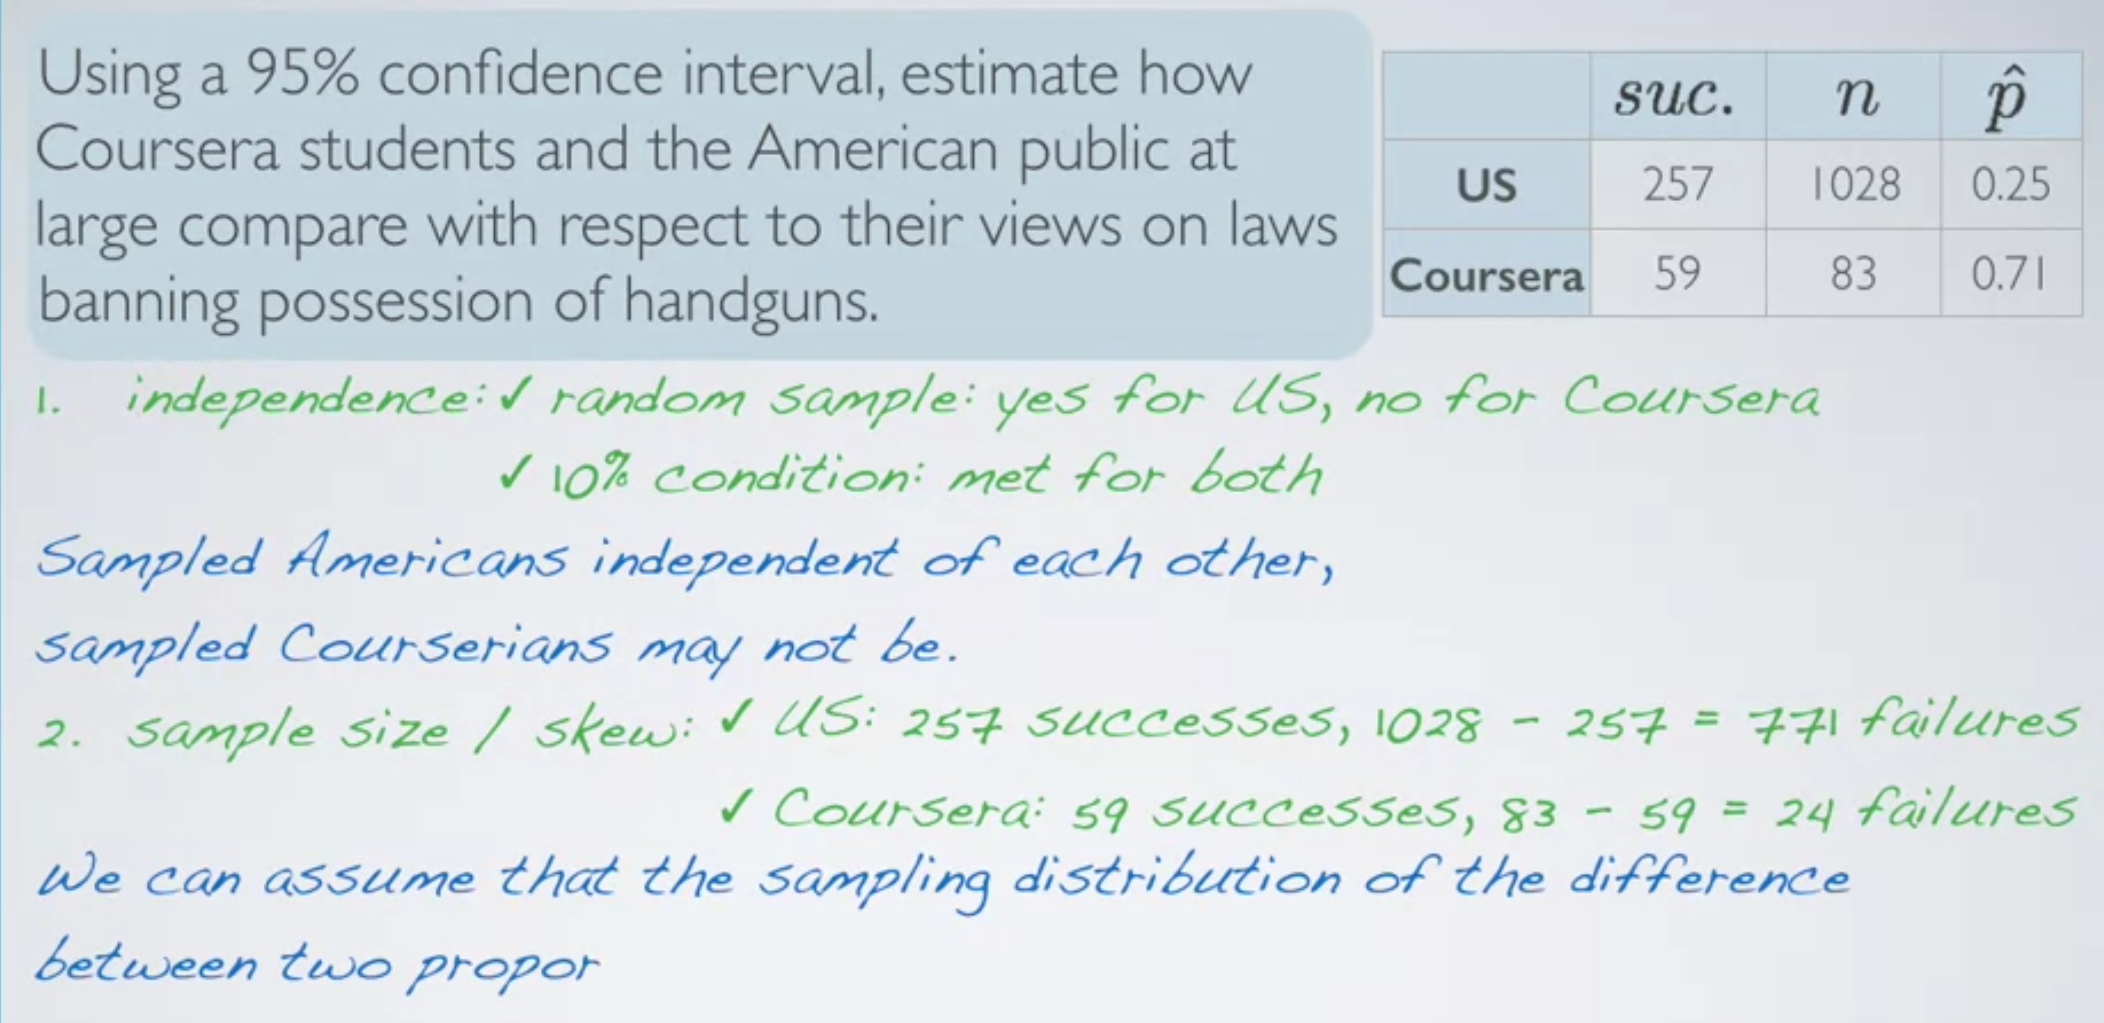
Estimating the Difference Between Two ProportionsParameter of Interest: pA - pBPoint Estimate: p̂A - p̂BDifference between the proportions of sampled
23.Duke University : Hypothesis Tests for Comparing Two Proportions
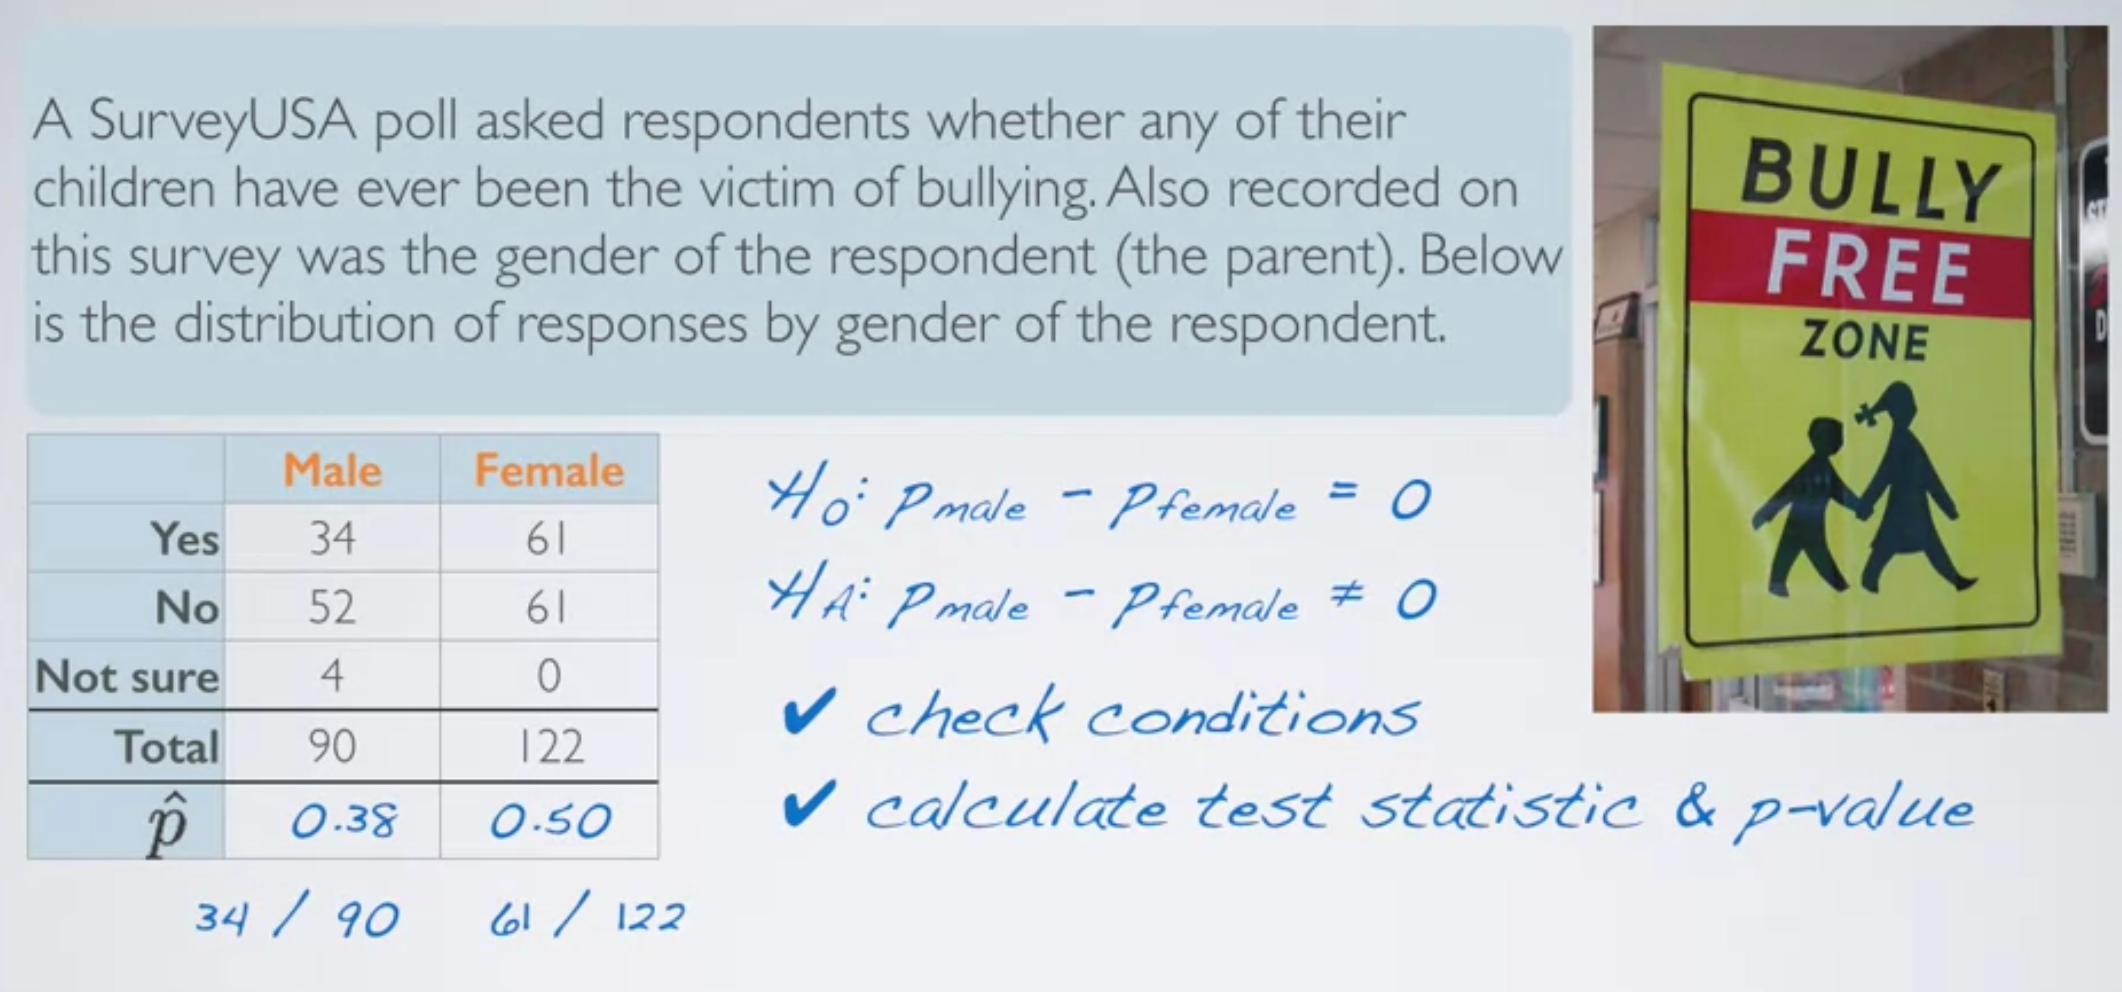
Working with One Proportion: p̂ vs p (Review)When working with one proportion, we had different formulae for success-failure condition and standard er
24.Duke University : Chi-Square GOF test
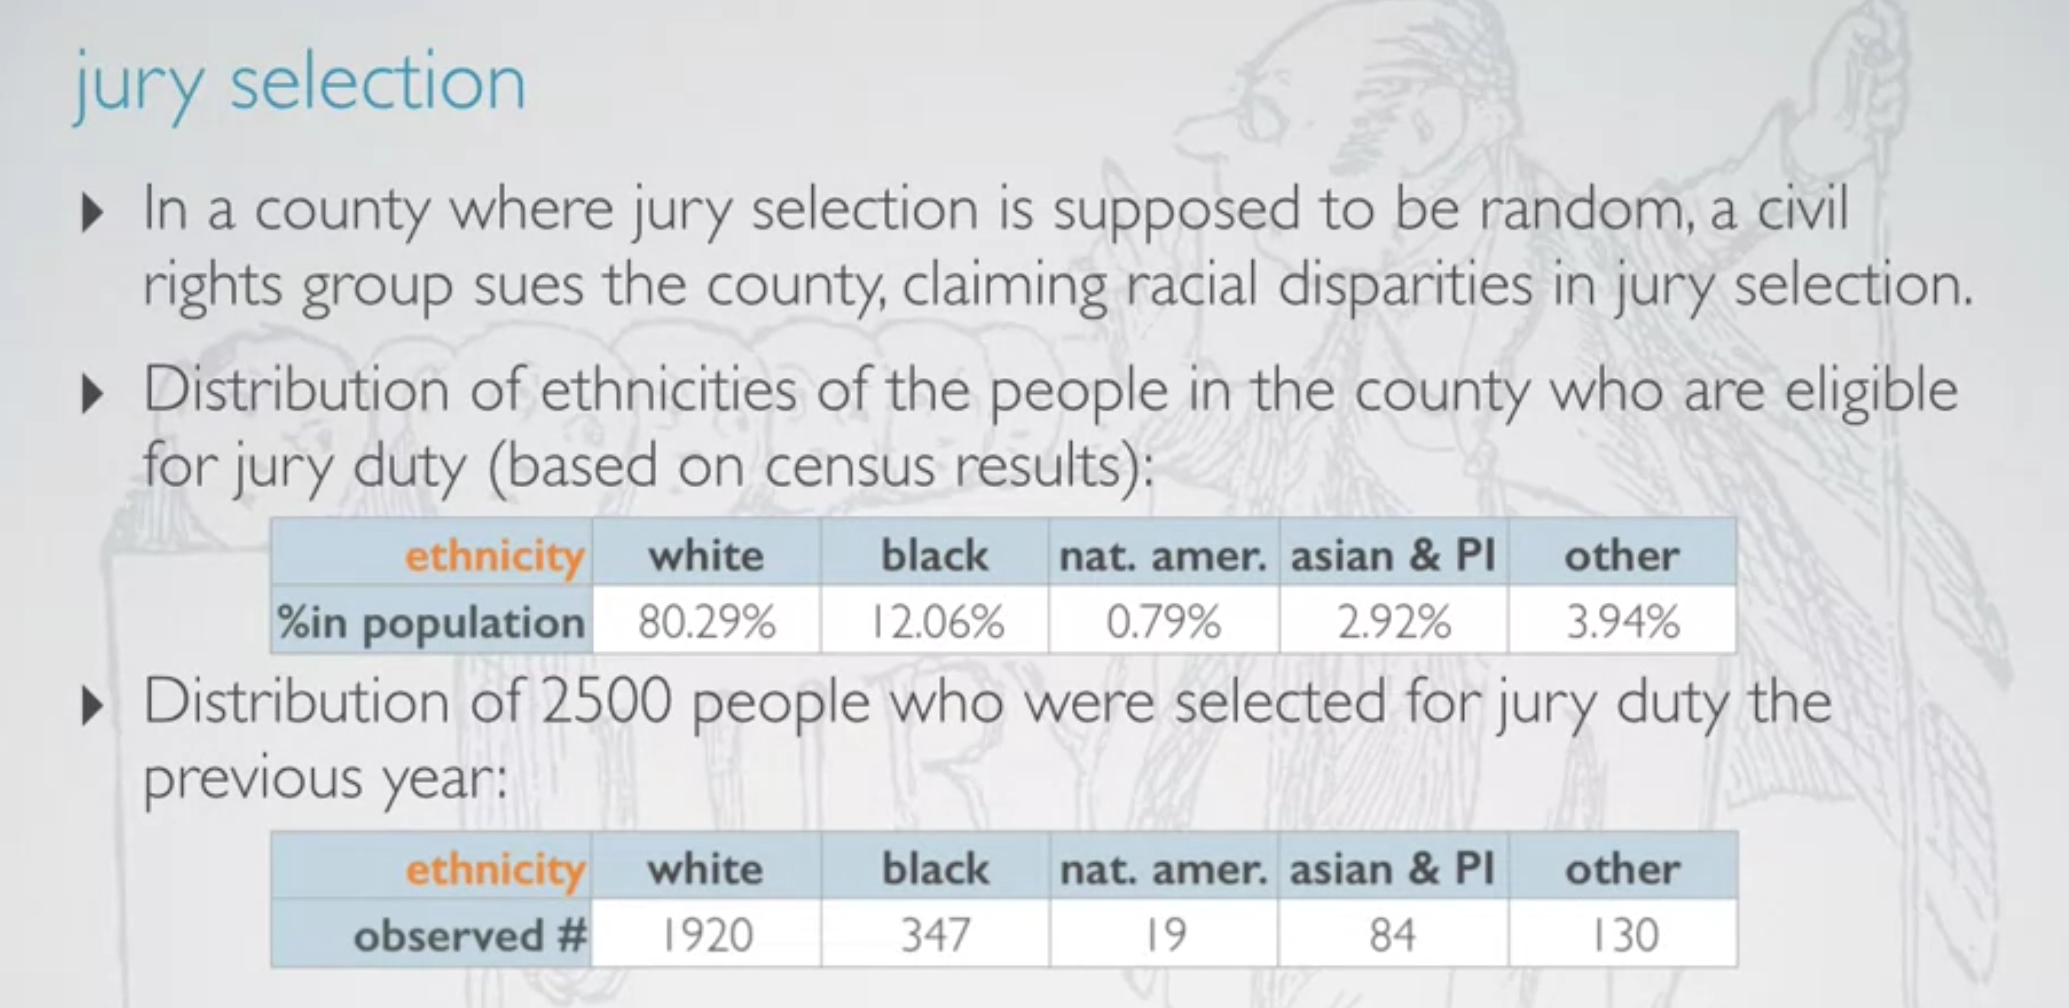
Chi-Square GOF testUsed to evaluate the distribution of one categorical variable with more than 2 levels.Evaluating by comparing the distribution of t
25.Duke University : The Chi-Square Independence Test
The Chi-square Independence TestEvaluating the relationship between two categorical variables, at least 1 categorical variable with more than 2 levels
26.Covariance and Correlation
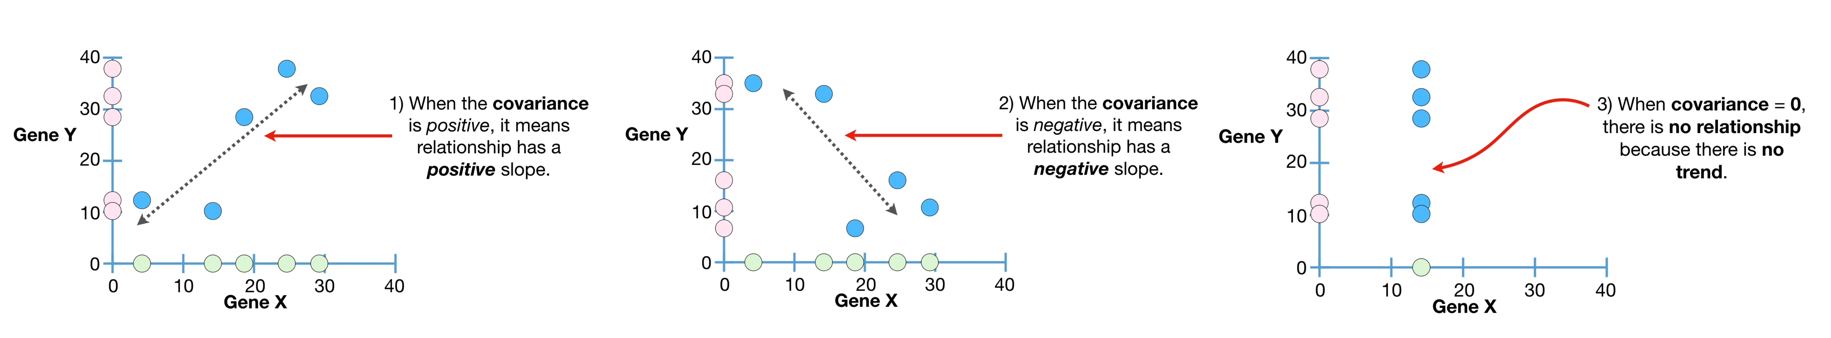
Measurement of the relationship1\. Covariance2\. CorrelationCoefficient of Determination\*
27.Cramer's V : Association of Categorical Variables
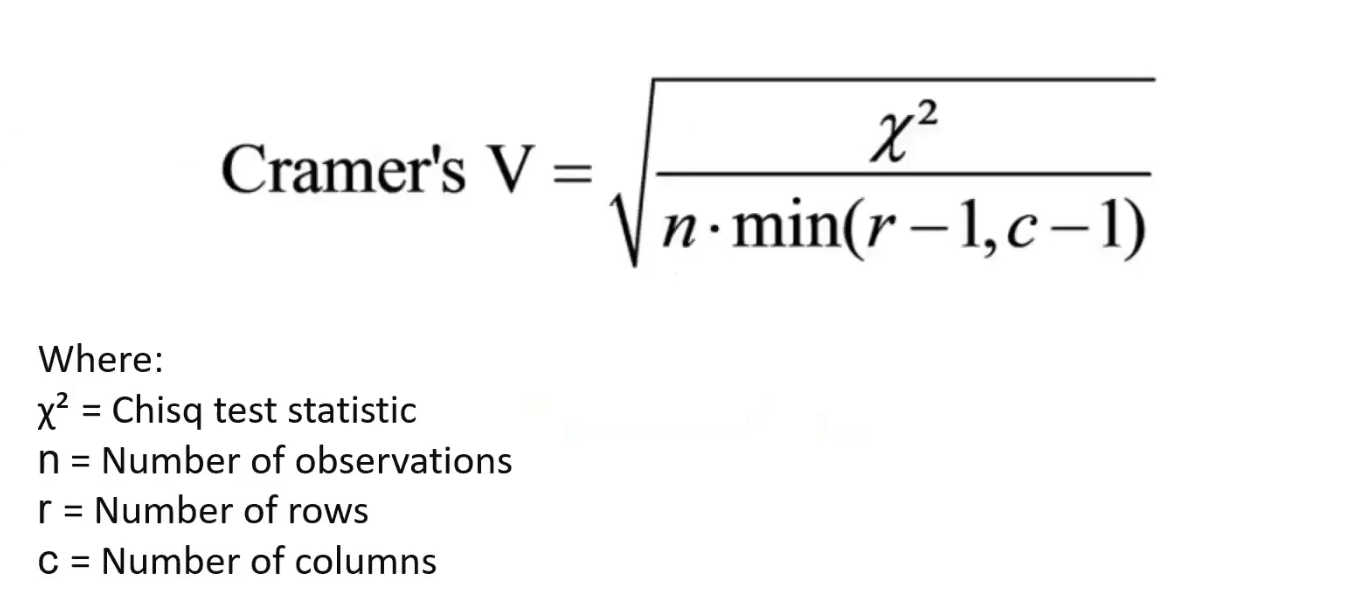
For two numerical variables, we use Pearson's correlation to measure the strength of the relationship between the variables.Cramer's V is something eq
28.[EDA] - Associations between variables
상관관계수치형 vs 수치형 \- 피어슨 상관계수(correlation coefficient) 범주형 vs 범주형 \- 분할표 범주형 vs 수치형 \- group by - boxplot/violin chart다변수 시각화 \- 조건화를 통한 그룹 별 차트
29.Multi-collinearity(다중공선성)
정의상관관계가 매우 높은 독립변수들이 동시에 모델에 포함될 때 발생문제같은 변수를 두 번 넣은 것임최소제곱법 계산이 어려워짐.회귀 계수를 구할 때, Standard Error가 비정상적으로 커지고, t-test statistic이 작아지고, p-value가 커지면서 유