Handwriteten Digits Recoginition(tf 2.x)
using keras
import tensorflow as tf

mnist = tf.keras.datasets.mnist
(x_train, y_train), (x_test, y_test) = mnist.load_data()
x_test, x_train = x_test/255., x_train/255.
print(y_train[:10], y_test[:10])
training_epochs = 15

model = tf.keras.models.Sequential([
    tf.keras.layers.Flatten(input_shape=(28,28)),
    tf.keras.layers.Dense(128, activation='relu'),
    tf.keras.layers.Dropout(.2),
    tf.keras.layers.Dense(10, activation='softmax')
])

model.compile(optimizer = 'adam',
             loss = 'sparse_categorical_crossentropy',
             metrics = ['accuracy'])
h = model.fit(x_train, y_train, validation_split=0.2, epochs = training_epochs)
score = model.evaluate(x_test, y_test, verbose=0)

# graph
import matplotlib.pyplot as plt
def vis(h, roi):
    plt.plot(h.history[roi])
    plt.plot(h.history['val_'+roi])
    plt.title('Model '+ roi)
    plt.xlabel('Epoch')
    plt.ylabel(roi.title())
    plt.legend(['Train', 'Test'], loc='upper left')
    plt.show()
vis(h, 'accuracy')
vis(h, 'loss')

# loss, accuracy check
('loss =', score[0],'accuracy =%.2f%%'%(score[1]*100))

# predict
#matplotlib inline
hypothesis = tf.argmax(model.predict(x_train),1).numpy()

def draw_and_label(i_sample):
    plt.figure()
    plt.imshow(x_train[i_sample], cmap='gray')
    plt.colorbar()
    plt.grid(False)
    plt.show()
    print("Ground Truth: %s"%str(y_train[i_sample]))
    print("predicted: %s"%str(hypothesis[i_sample]))
draw_and_label(0)
Handwriting recognition with CNN
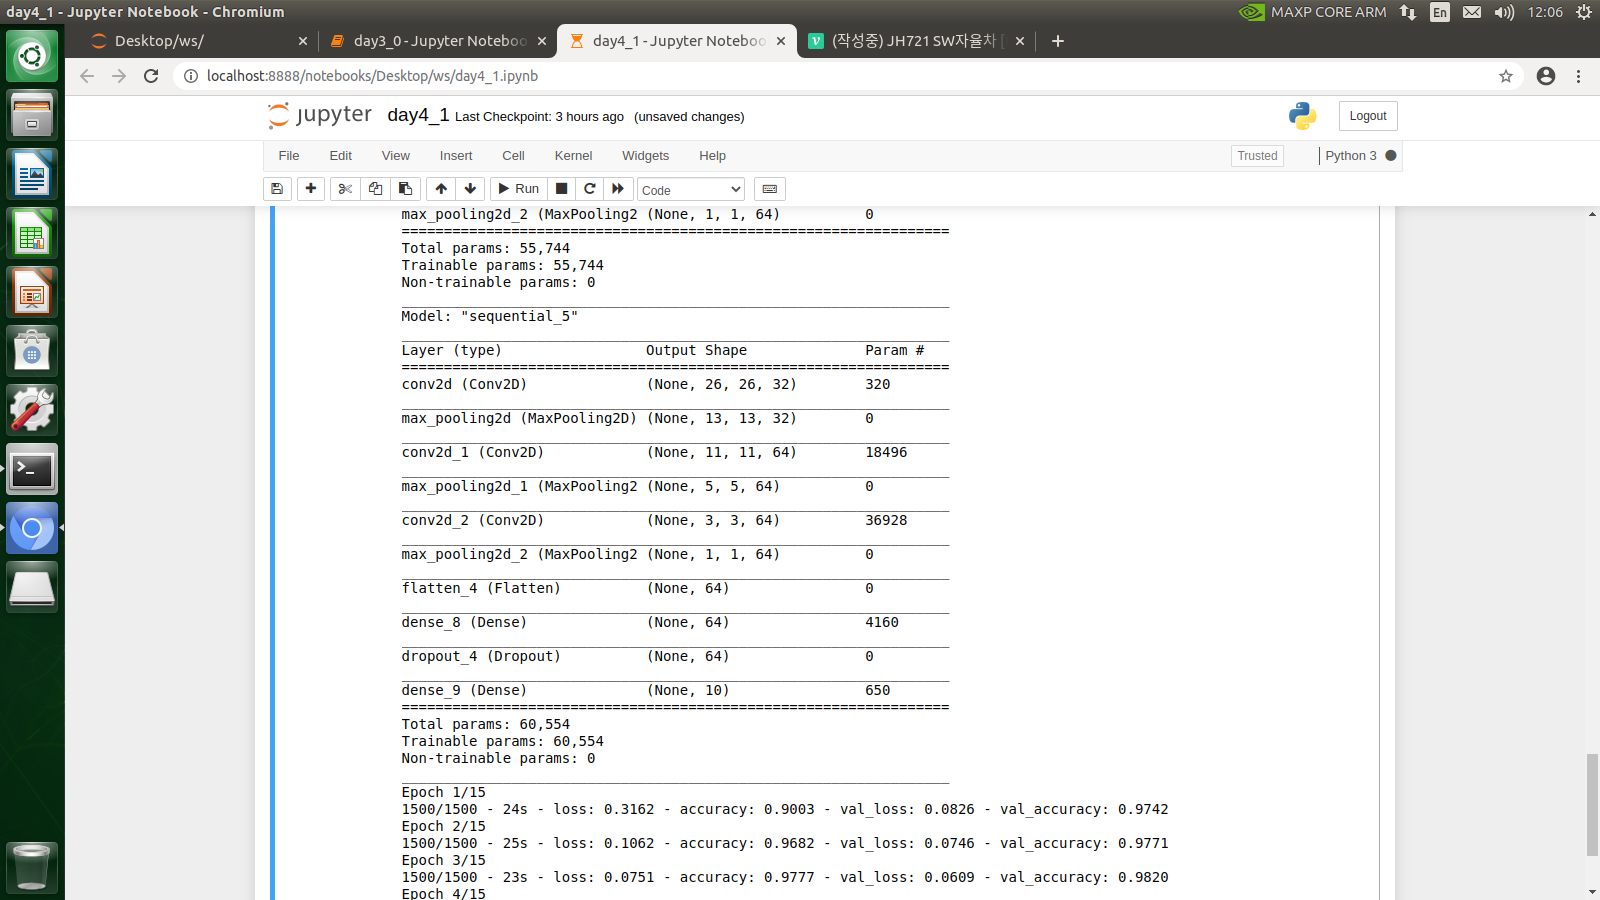
conv2d is 320, because 32 x 9 + 32 x 1(bias is 32 = filter is 32) = 32 x 12 =320
conv2d_1 is 18496 because 32 x 64 x (3x3) + 64(Bias=64) =18496
understand image channel
image_path = tf.keras.utils.get_file('cat.jpg', 'https://bit.ly/33U6mH9')
image = plt.imread(image_path)

titles = ['RGB Image', 'Red channel', 'Green channel', 'Blue channel']
cmaps = [None, plt.cm.Reds_r, plt.cm.Greens_r, plt.cm.Blues_r]

from numpy import array, zeros_like
def channel(image, color):
    if color not in (0,1,2): return image
    c = image[..., color]
    z = zeros_like(c)
    return array([(c,z,z), (z,c,z), (z,z,c)][color]).transpose(1,2,0)

colors = range(-1, 3)
fig, axes = plt.subplots(1, 4, figsize=(13,3))
objs = zip(axes, titles, colors)
for ax, title, color in objs:
    ax.imshow(channel(image, color))
    ax.set_title(title)
    ax.set_xticks(())
    ax.set_yticks(())
plt.show()
verbose = 2 : all data / = 1 : some data / = 0 : None
fashion image

import tensorflow as tf
from tensorflow.keras.datasets import fashion_mnist
import matplotlib.pyplot as plt
(x_train, y_train ), (x_test, y_test) = fashion_mnist.load_data()
x_train, x_test = x_train / 255.0, x_test /255.0
x_train = x_train.reshape((-1, 28, 28, 1))
x_test = x_test.reshape((-1, 28, 28, 1))
model = tf.keras.Sequential([
tf.keras.layers.Conv2D(input_shape=(28,28,1), kernel_size=(3,3), filters=16),
tf.keras.layers.MaxPooling2D(strides=(2,2)),
tf.keras.layers.Conv2D(kernel_size=(3,3), filters=32),
tf.keras.layers.MaxPooling2D(strides=(2,2)),
tf.keras.layers.Conv2D(kernel_size=(3,3), filters=64),
tf.keras.layers.Flatten(),
tf.keras.layers.Dense(units=128, activation='relu'),
tf.keras.layers.Dropout(rate=0.2),
tf.keras.layers.Dense(units=10, activation='softmax')
])
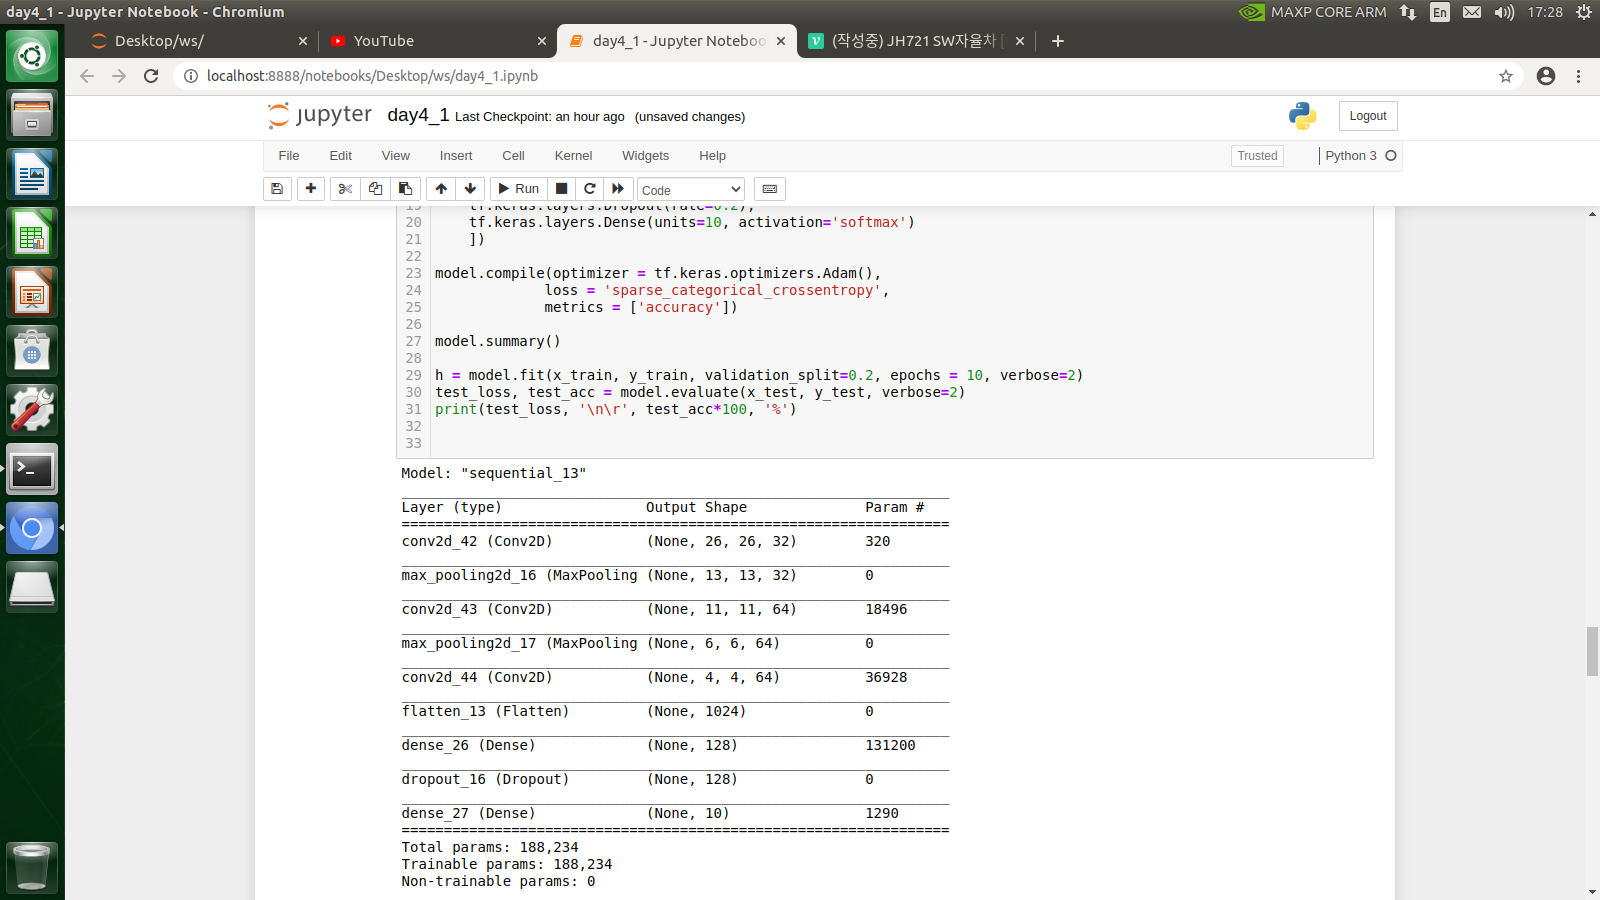
model.compile(optimizer = tf.keras.optimizers.Adam(),
loss = 'sparse_categorical_crossentropy',
metrics = ['accuracy'])
model.summary()
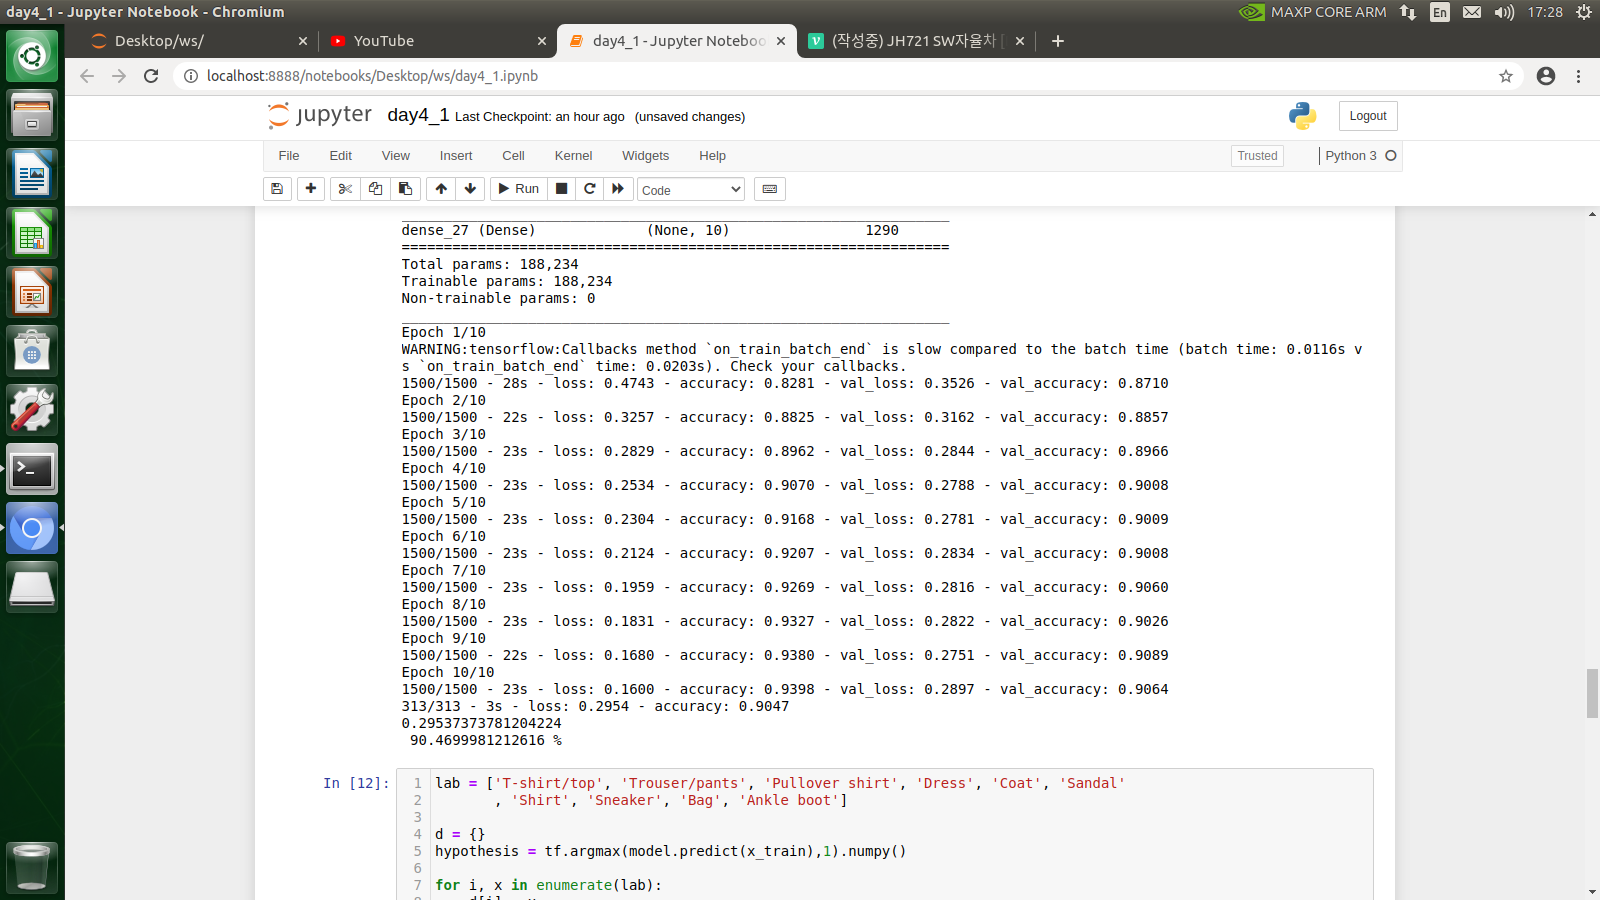
h = model.fit(x_train, y_train, validation_split=0.2, epochs = 10, verbose=2)
test_loss, test_acc = model.evaluate(x_test, y_test, verbose=2)
print(test_loss, '\n\r', test_acc*100, '%')
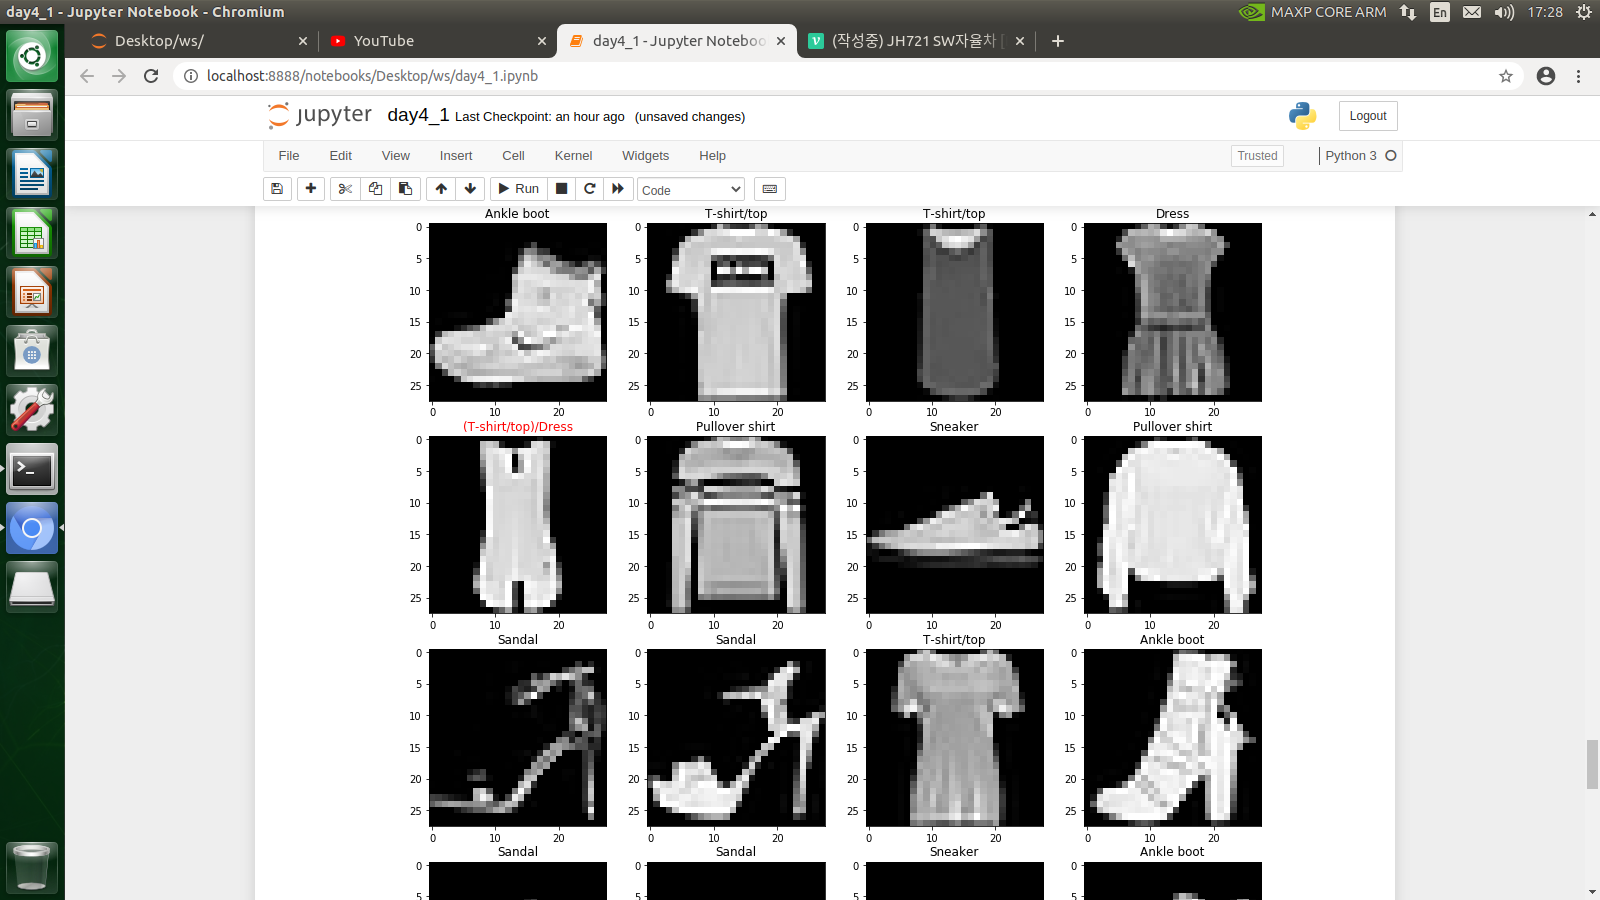
lab = ['T-shirt/top', 'Trouser/pants', 'Pullover shirt', 'Dress', 'Coat', 'Sandal'
, 'Shirt', 'Sneaker', 'Bag', 'Ankle boot']
d = {}
hypothesis = tf.argmax(model.predict(x_train),1).numpy()
for i, x in enumerate(lab):
d[i] = x
print(d)
fg_color = 'red'
bg_color = 'black'
plt.figure(figsize=(15,15))
for c in range(16):
co = y_train[c] == hypothesis[c]
print(co, end=' ')
plt.subplot(4,4,c+1)
plt.imshow(x_train[c].reshape(28,28), cmap='gray')
if co:
plt.title(d[hypothesis[c]], color=bg_color)
else:
plt.title('('+d[y_train[c]]+')' +'/' +d[hypothesis[c]], color=fg_color)way
1. data load
2. model declare
3. model copile
4. model fit
------primary job--------------
5. predict / evaluate tec
image change
from tensorflow.keras.preprocessing.image import ImageDataGenerator
import numpy as np
image_generator = ImageDataGenerator(
rotation_range=10,
zoom_range=0.10,
shear_range=0.5,
width_shift_range=0.10,
height_shift_range=0.10,
horizontal_flip=True,
vertical_flip=True)
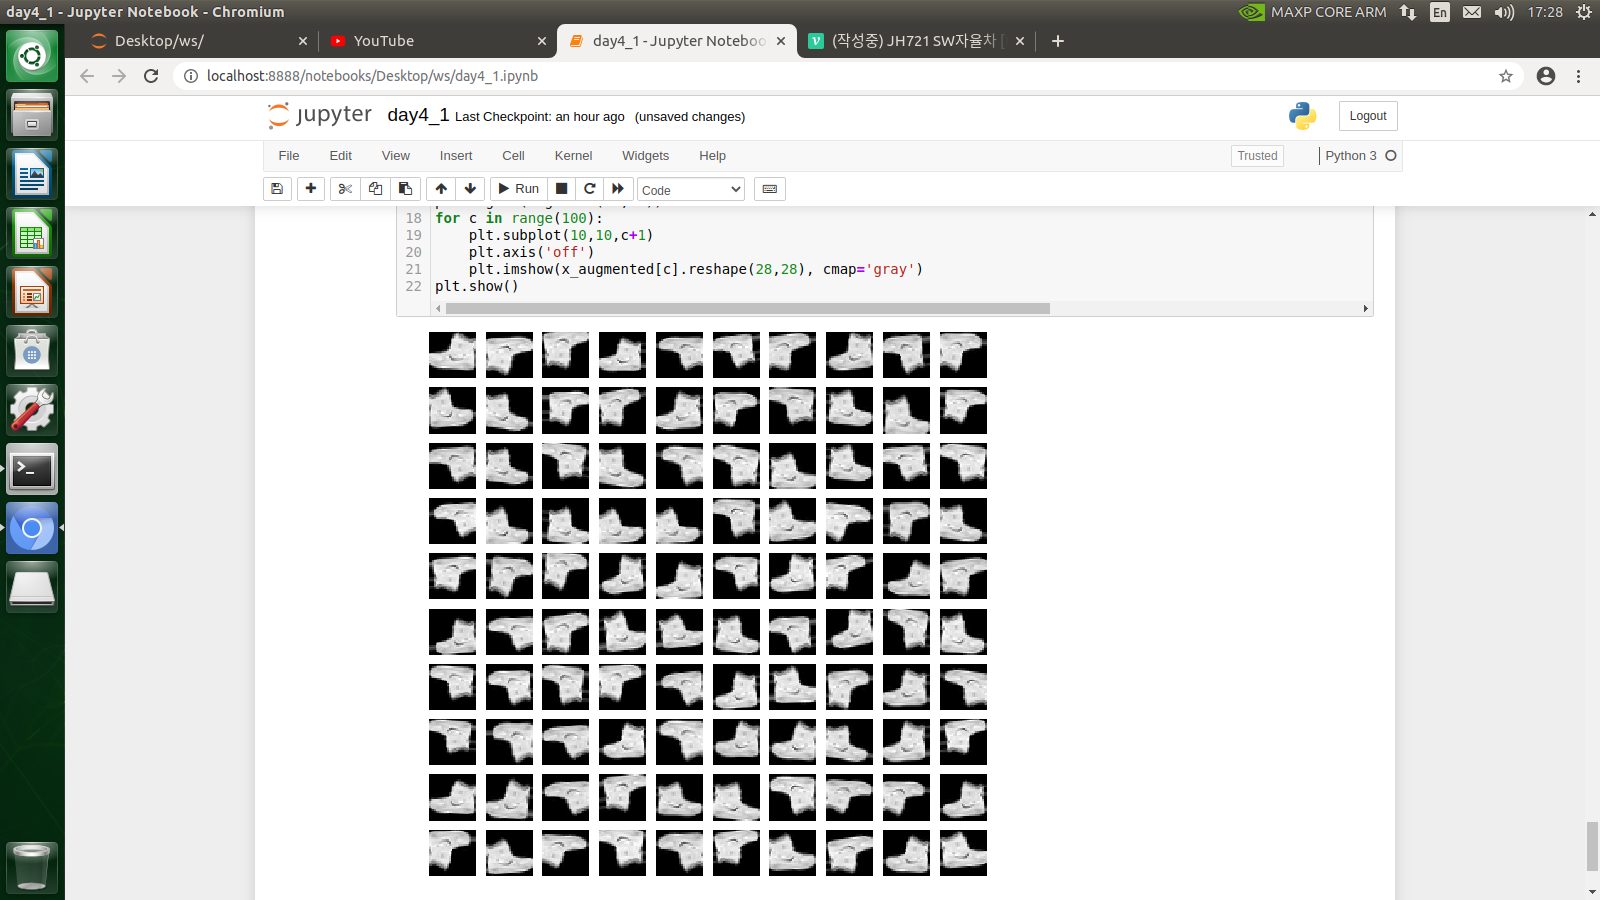
augment_size = 100
x_augmented = image_generator.flow(np.tile(x_train[0].reshape(28*28),100).reshape(-1,28,28,1), np.zeros(augment_size), batch_size=augment_size, shuffle=False).next()[0]
plt.figure(figsize=(10,10))
for c in range(100):
plt.subplot(10,10,c+1)
plt.axis('off')
plt.imshow(x_augmented[c].reshape(28,28), cmap='gray')
plt.show()

JH.velog