- stripplot
sbn.stripplot(data=df, x='month',y='total')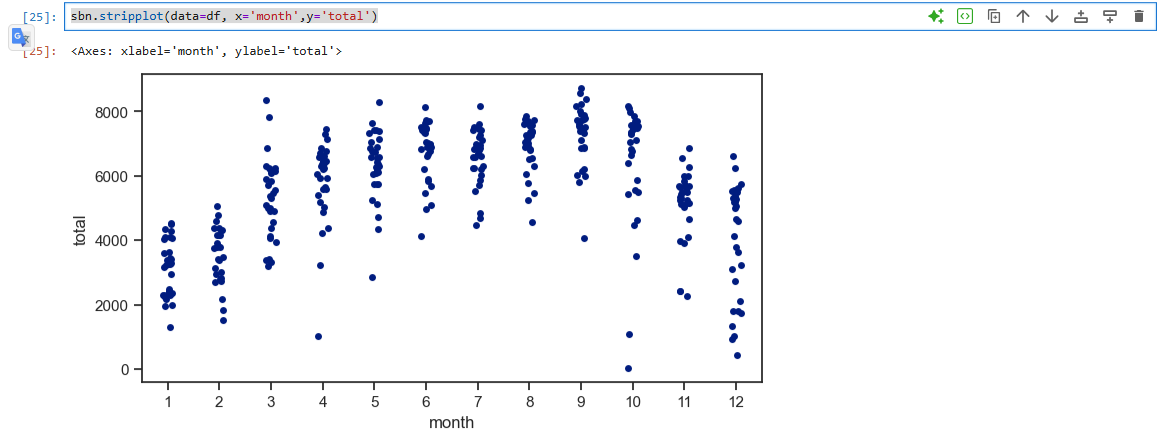
sbn.stripplot(data=df, x='month',y='total', hue='workingday')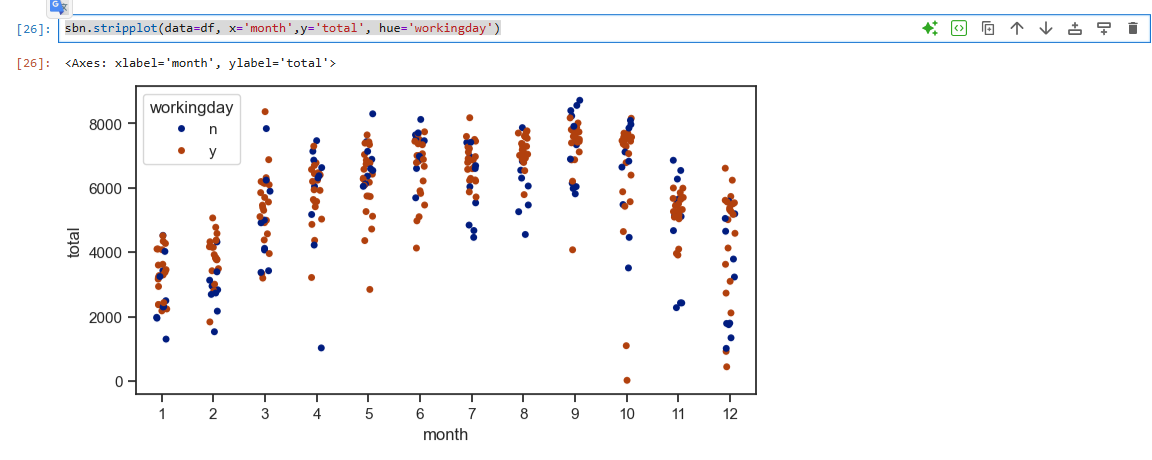
- swarmplot - 작은 데이터셋을 분석할 떄 추천
sbn.swarmplot(data=df, x='month',y='total', hue='workingday')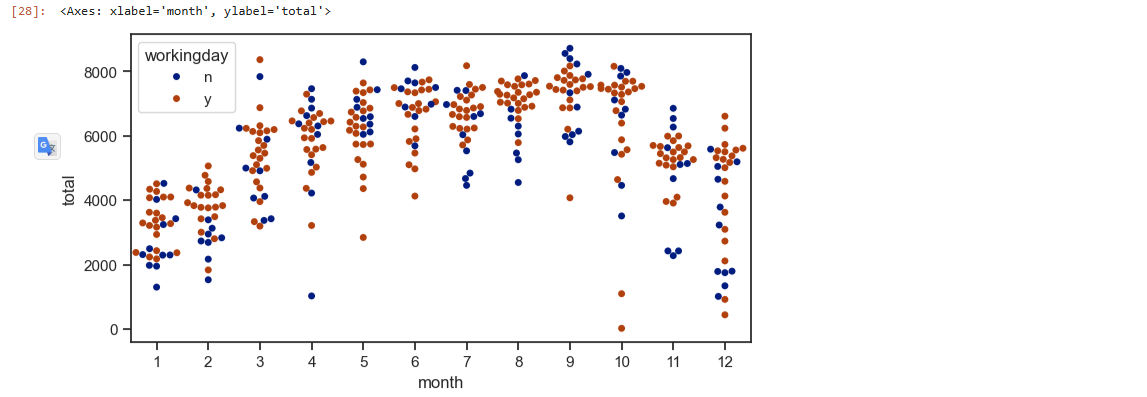
- boxplot
sbn.boxplot(data=df, x='day_of_week',y='registered')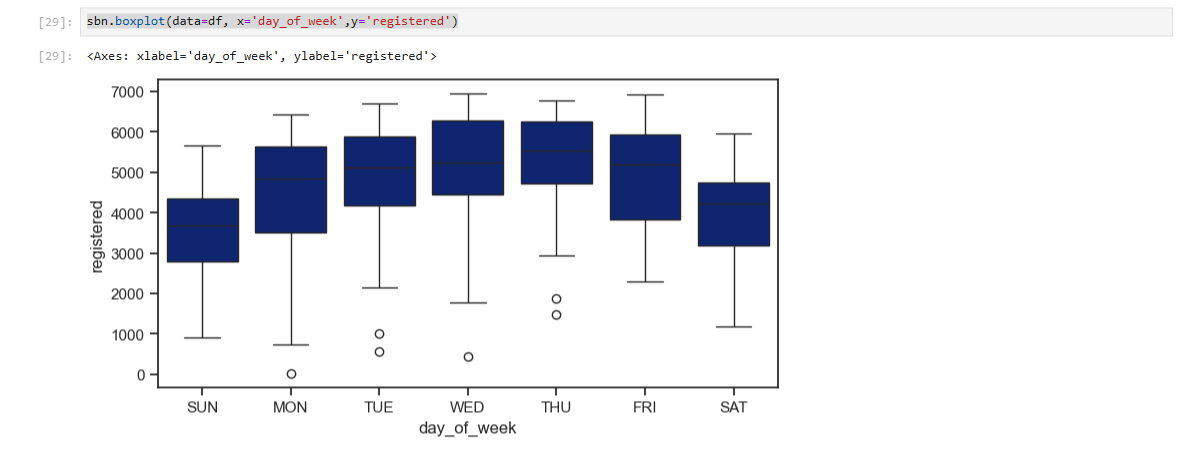
sbn.boxplot(data=df, x='day_of_week',y='registered',order=['MON','TUE','WED','THU','FRI','SAT'])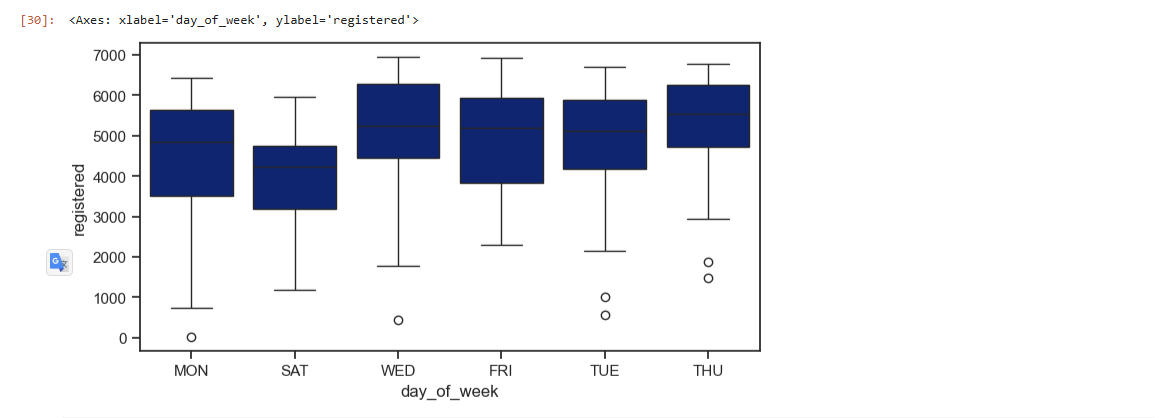
- violinplot
sbn.violinplot(data=df, x='day_of_week',y='registered',order=['MON','TUE','WED','THU','FRI','SAT', 'SUN'])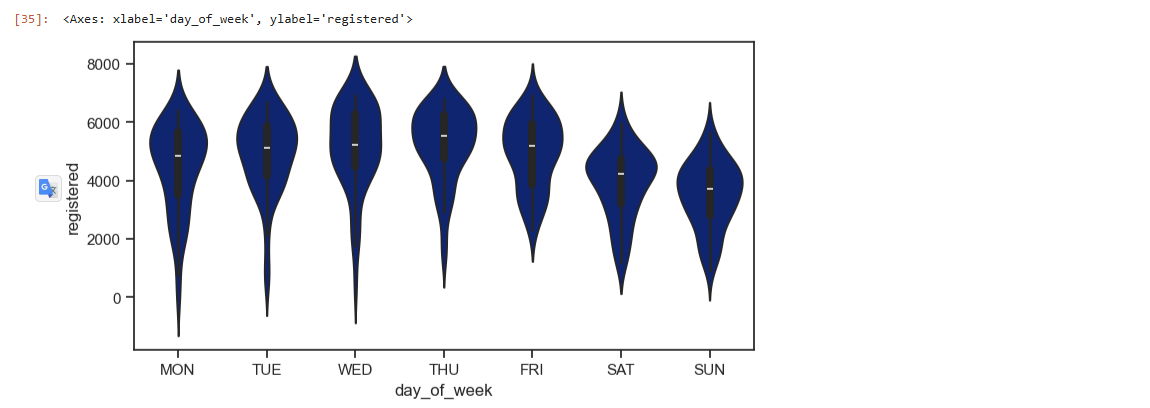
- histplot
sbn.histplot(data=df, x='registered')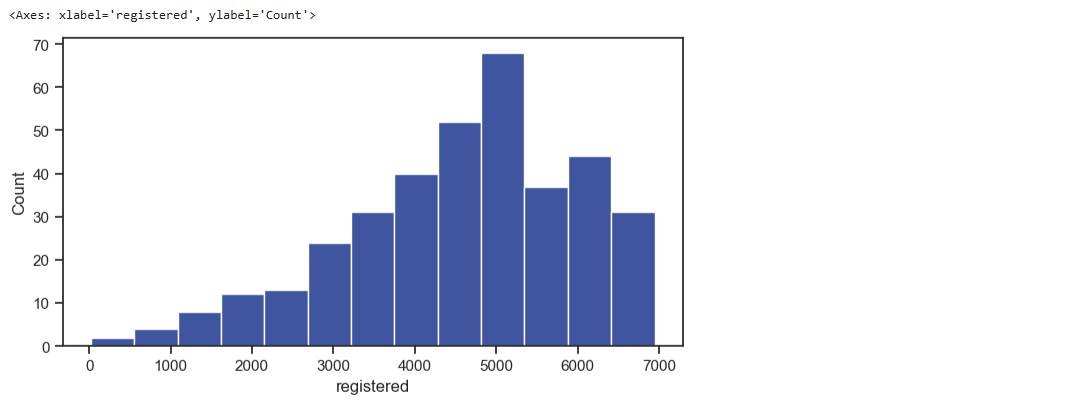
sbn.histplot(data=df, y='registered')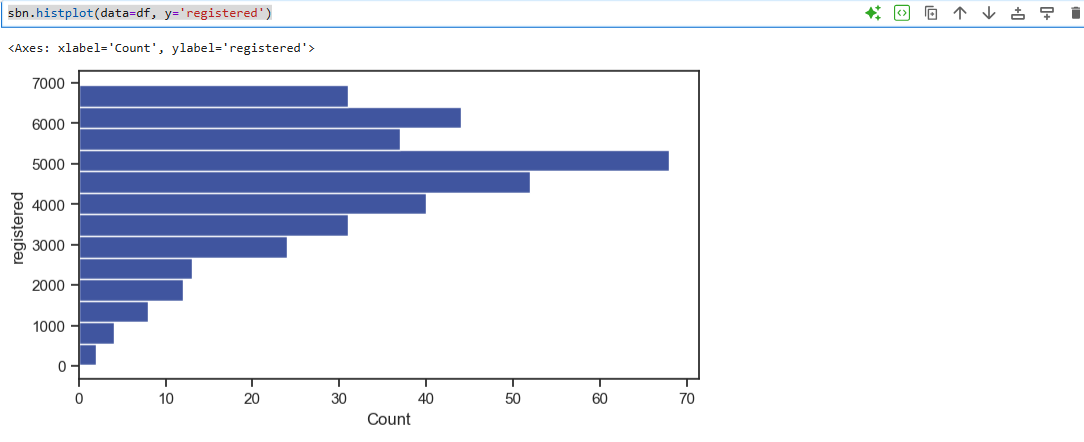
sbn.histplot(data=df, x='registered', bins=10 ,hue='workingday')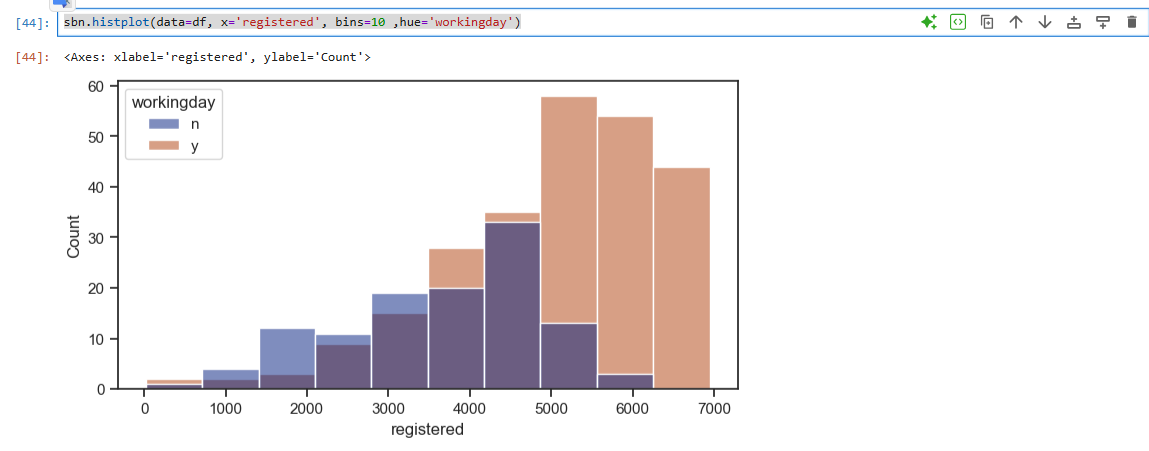
sbn.histplot(data=df, x='registered', bins=10 ,hue='workingday', multiple='stack')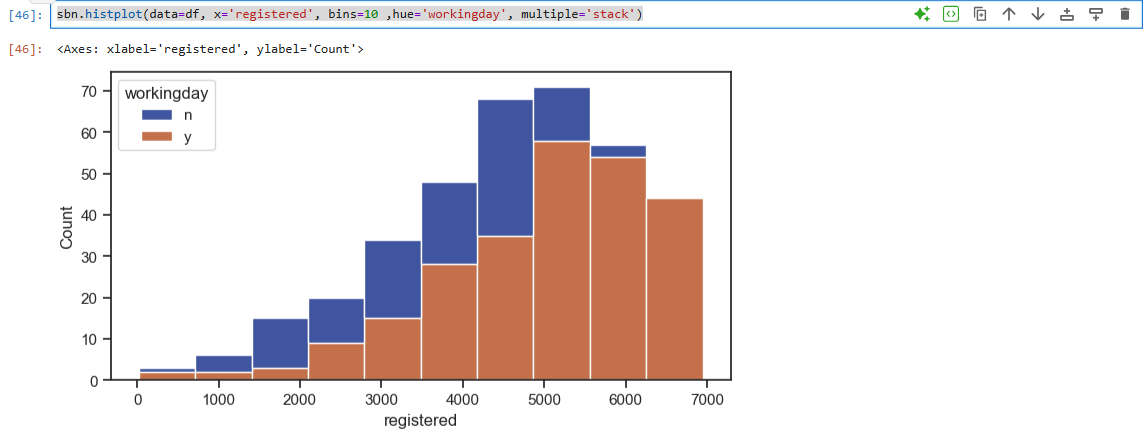
- kdeplot
sbn.kdeplot(data=df, x='registered', bw_method=2)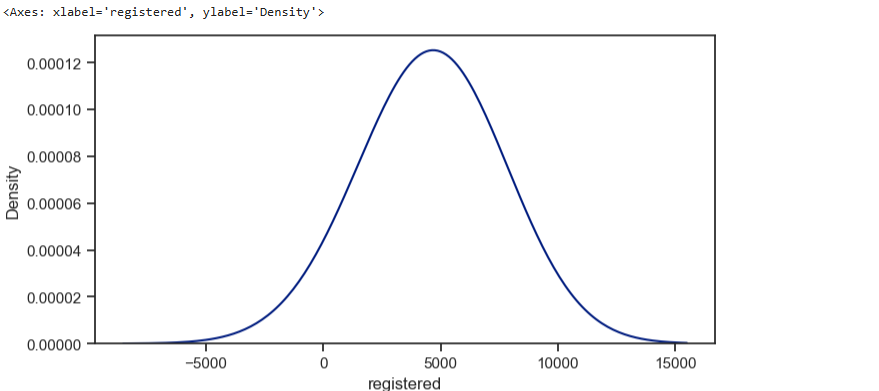

개발자