📌 OX 손글씨 분류
- Get dataset
from glob import glob

train_raw_O_list = glob('../data/OX_clf/train_raw/O/*')
train_raw_O_list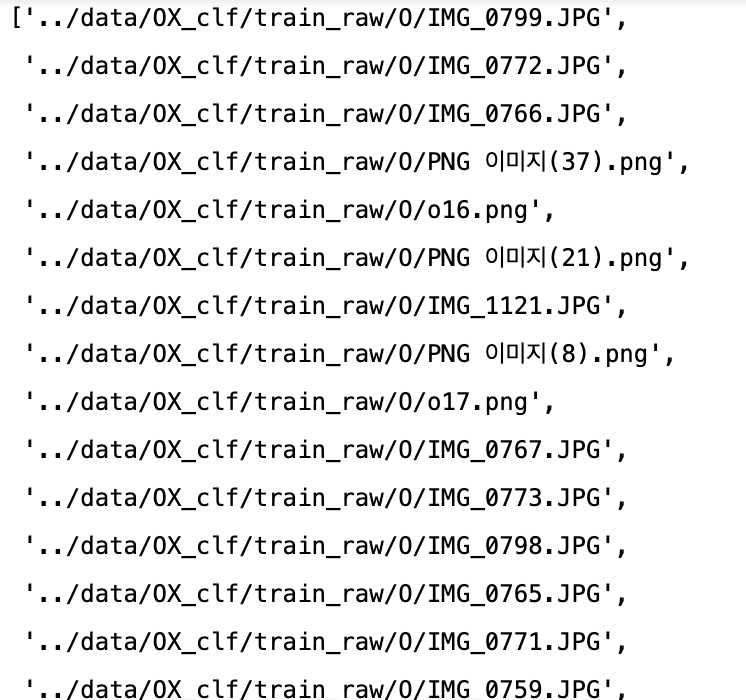
- skimage
opencv를 사용할 수도 있지만 skimage 사용
- skimage 설치
!pip install scikit-imagefrom skimage.transform import rescale, resize
from skimage import color
from skimage.io import imread, imsave
import matplotlib.pyplot as plt- 이미지 읽기
image = imread(train_raw_O_list[0])
image = color.rgb2gray(image)
plt.imshow(image, cmap='gray');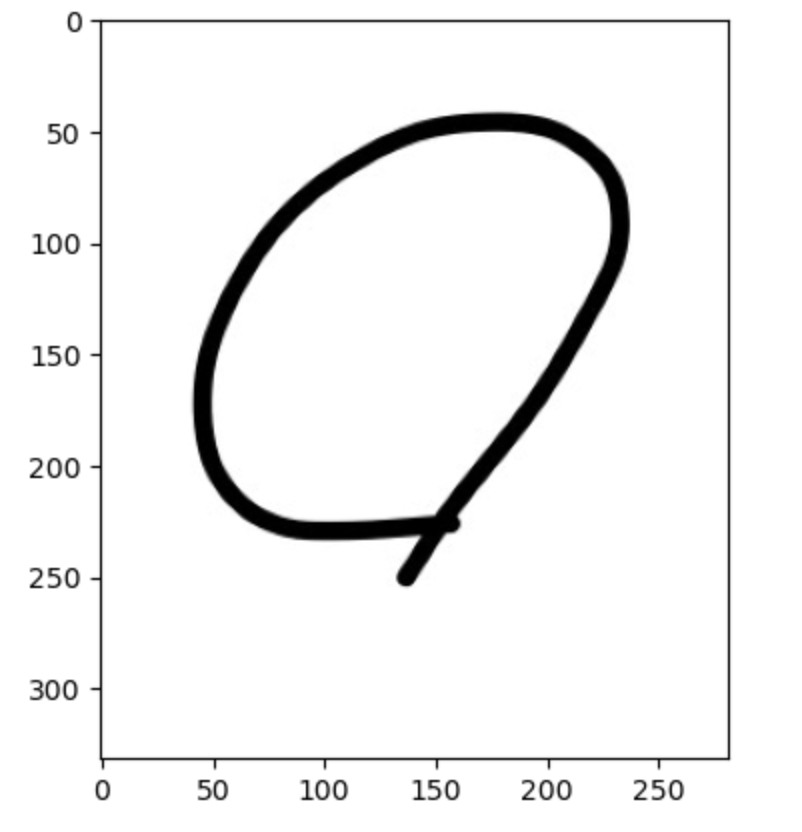
image.shape
- 이미지 resize
img_resized = resize(image, (28,28))
print(img_resized.shape)
plt.imshow(img_resized, cmap='gray');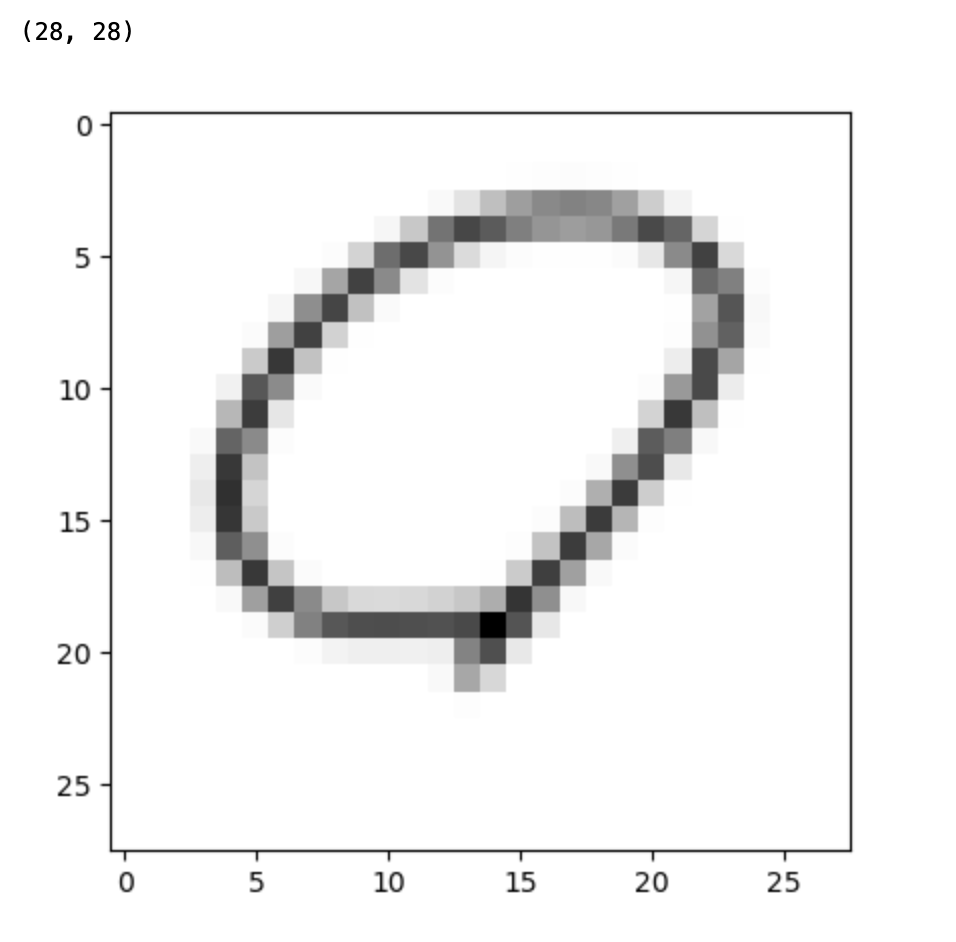
- 0과 1 사이 값으로 되어있던 픽셀 값을 다시 255로 복원
import numpy as np

imsave("../data/OX_clf/tmp.png", np.round(img_resized*255).astype(np.uint8))
tmp = imread("../data/OX_clf/tmp.png")
print(tmp.shape)
plt.imshow(tmp, cmap='gray');
- 파일명 가져오기
폴더 구분 기호를 사용해 파일명 가져오기
train_raw_O_list[0].split('/')[-1][:-4]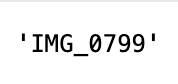
- 함수 생성
- 이미지 resize 함수 생성
def img_resize(img):
    img = color.rgb2gray(img)   # 색상변경
    return resize(img, (28,28)) # 크기 변경
- 데이터 전처리
- train O 데이터
from tqdm.notebook import tqdm

def convert_train_O():
    train_raw_O_list = glob('./train_raw/O/*')
    for each in tqdm(train_raw_O_list):
        img = imread(each)  # 이미지 읽기
        img_resized = img_resize(img)   # 크기 변경
        save_name = './train/O/' + each.split('/')[-1][:-4] + '.png'    # 저장 이름
        imsave(save_name, np.round(img_resized*255).astype(np.uint8))   # 이미지 저장

convert_train_O()- train X 데이터
# X 데이터에도 동일 적용
def convert_train_X():
    train_raw_X_list = glob('./train_raw/X/*')
    for each in tqdm(train_raw_X_list):
        img = imread(each)
        img_resized = img_resize(img)
        save_name = './train/X/' + each.split('/')[-1][:-4] + '.png'
        imsave(save_name, np.round(img_resized*255).astype(np.uint8))

convert_train_X()- test O 데이터
def convert_test_O():
    test_raw_O_list = glob('./test_raw/O/*')
    for each in tqdm(test_raw_O_list):
        img = imread(each)
        img_resized = img_resize(img)
        save_name = './test/O/' + each.split('/')[-1][:-4] + '.png'
        imsave(save_name, np.round(img_resized*255).astype(np.uint8))

convert_test_O()- test X 데이터
def convert_test_X():
    test_raw_X_list = glob('./test_raw/X/*')
    for each in tqdm(test_raw_X_list):
        img = imread(each)
        img_resized = img_resize(img)
        save_name = './test/X/' + each.split('/')[-1][:-4] + '.png'
        imsave(save_name, np.round(img_resized*255).astype(np.uint8))

convert_test_X()
- keras
import numpy as np
from keras.models import Sequential
from keras.layers import Dense
from keras.layers import Flatten
from keras.layers import Conv2D, MaxPooling2D
from keras.preprocessing.image import ImageDataGenerator
import keras

np.random.seed(13)
train_datagen = ImageDataGenerator(rescale=1./255)
train_generator = train_datagen.flow_from_directory(
'../data/OX_clf/train',
target_size=(28, 28),
batch_size=3,
class_mode='categorical')
test_datagen = ImageDataGenerator(rescale=1./255)
test_generator = test_datagen.flow_from_directory(
'../data/OX_clf/test',
target_size=(28, 28),
batch_size=3,
class_mode='categorical')
- model
model = Sequential()
model.add(Conv2D(32, kernel_size=(3, 3),
                 activation='relu',
                 input_shape=(28,28,3)))
model.add(Conv2D(64, (3, 3), activation='relu'))
model.add(MaxPooling2D(pool_size=(2, 2)))
model.add(Flatten())
model.add(Dense(128, activation='relu'))
model.add(Dense(2, activation='softmax'))   # 출력을 2개로 잡음
model.summary() 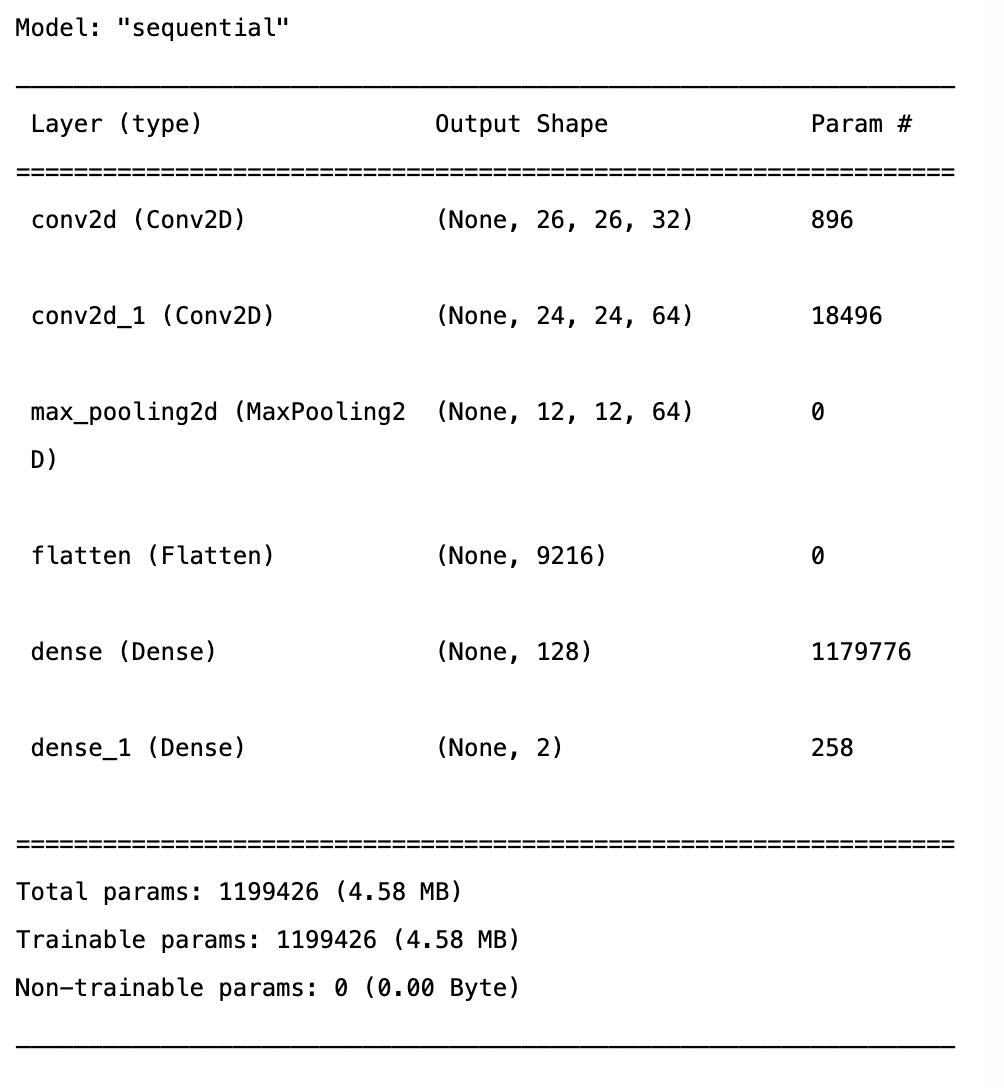
model.compile(loss='categorical_crossentropy',
              optimizer='adam', metrics=['accuracy'])
hist = model.fit_generator(
train_generator,
steps_per_epoch=15,
epochs=50,
validation_data=test_generator,
validation_steps=5) plt.figure(figsize=(12,6))
plt.plot(hist.history['loss'], label='loss')
plt.plot(hist.history['val_loss'], label='val_loss')
plt.plot(hist.history['accuracy'], label='acc')
plt.plot(hist.history['val_accuracy'], label='val_acc')
plt.legend()
plt.show()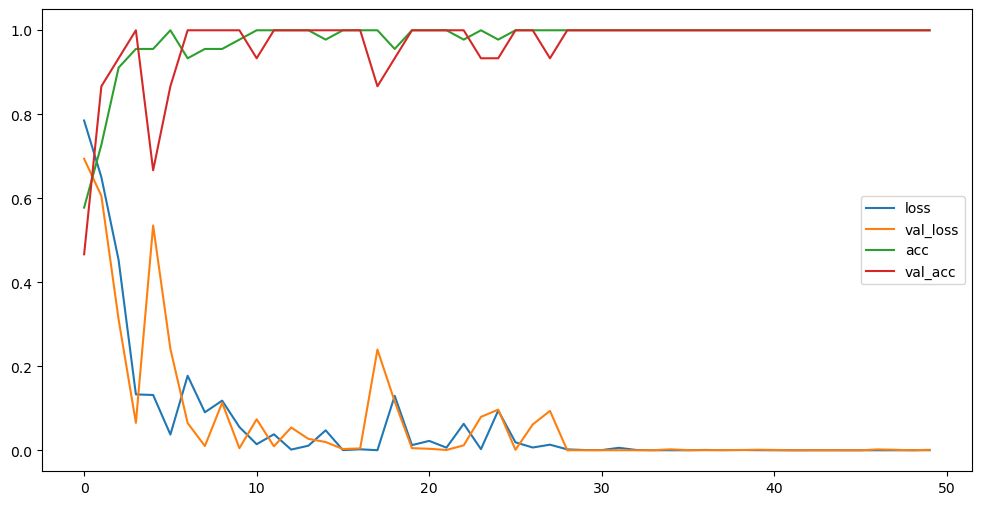
"이 글은 제로베이스 데이터 취업 스쿨 강의를 듣고 작성한 내용으로 제로베이스 데이터 취업 스쿨 강의 자료 일부를 발췌한 내용이 포함되어 있습니다."
