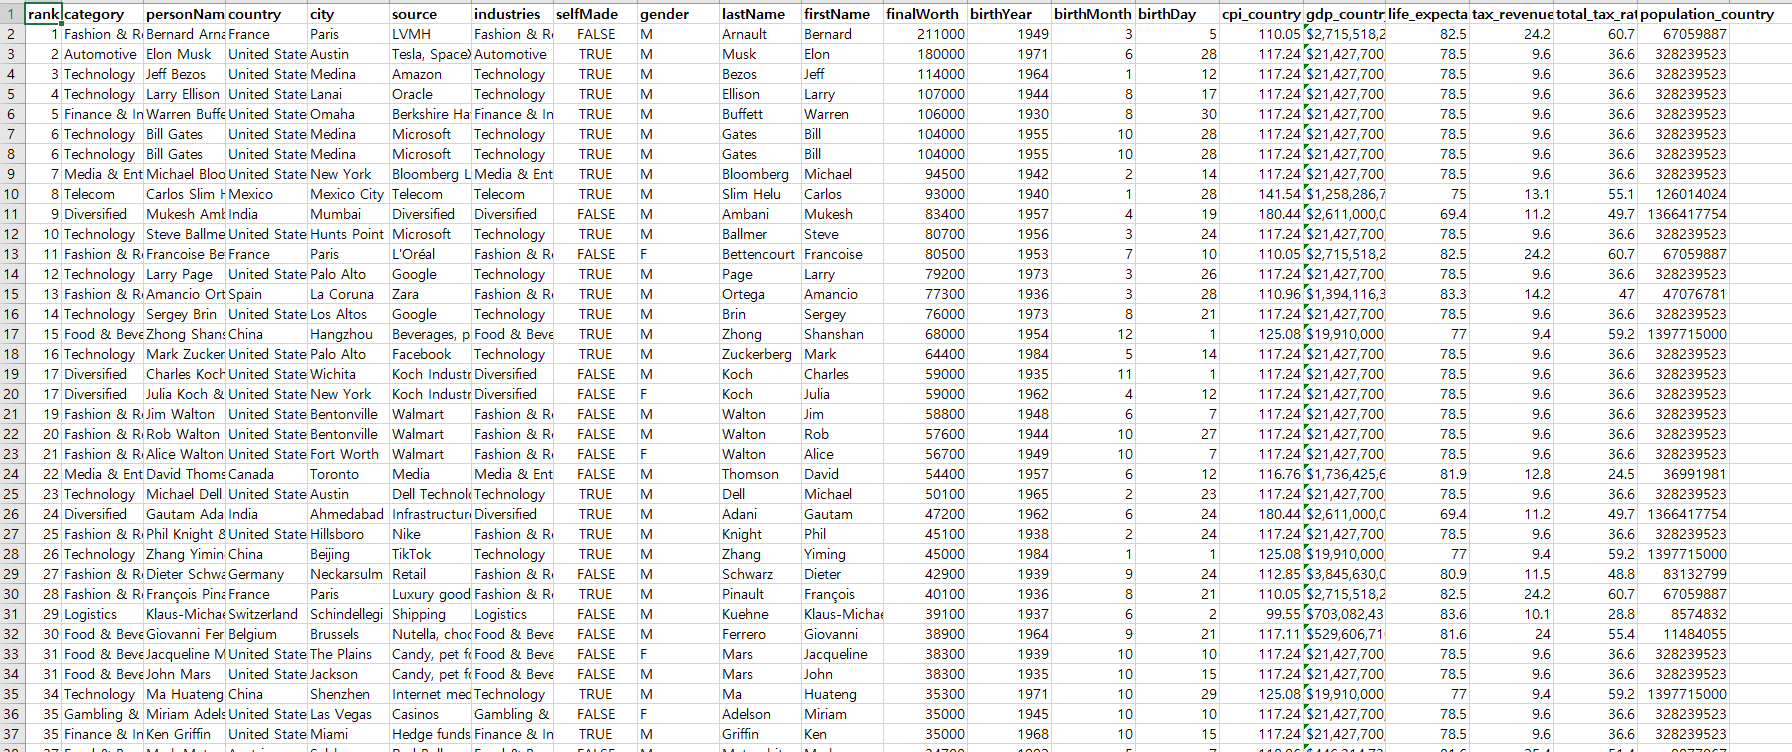
Name of the file : Billionaires Statistics Dataset
Data source : kaggle
Simple data analysis practice using Excel
- Data Cleaning
- Data Analysis
- Data visualization
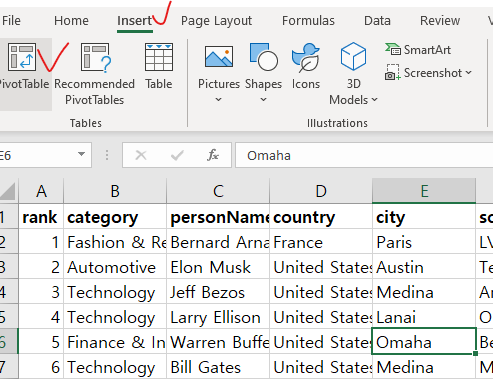
Check data
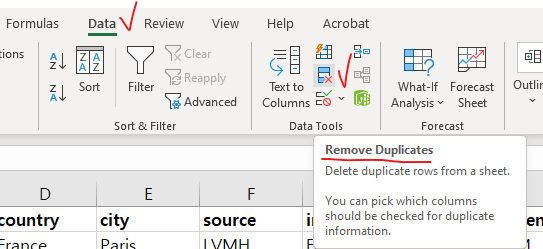
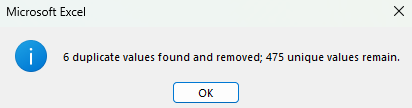
1. Data Cleaning
Find and remove duplicates
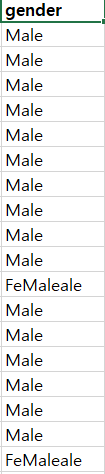
Check and change values (easy to see and understand)
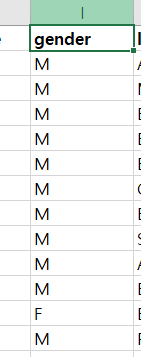
M -> Male / F -> Female
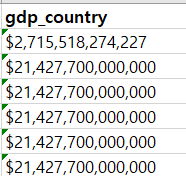
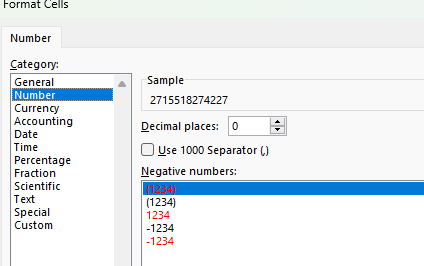
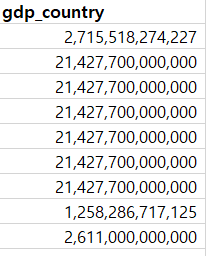
Clean up unnecessary information or convert it into necessary information
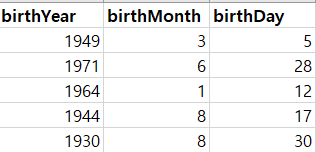
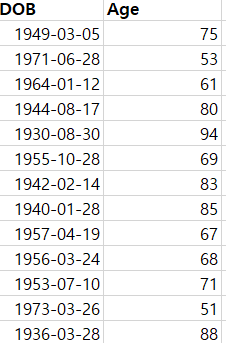
Check and convert data type
2.Data Analysis
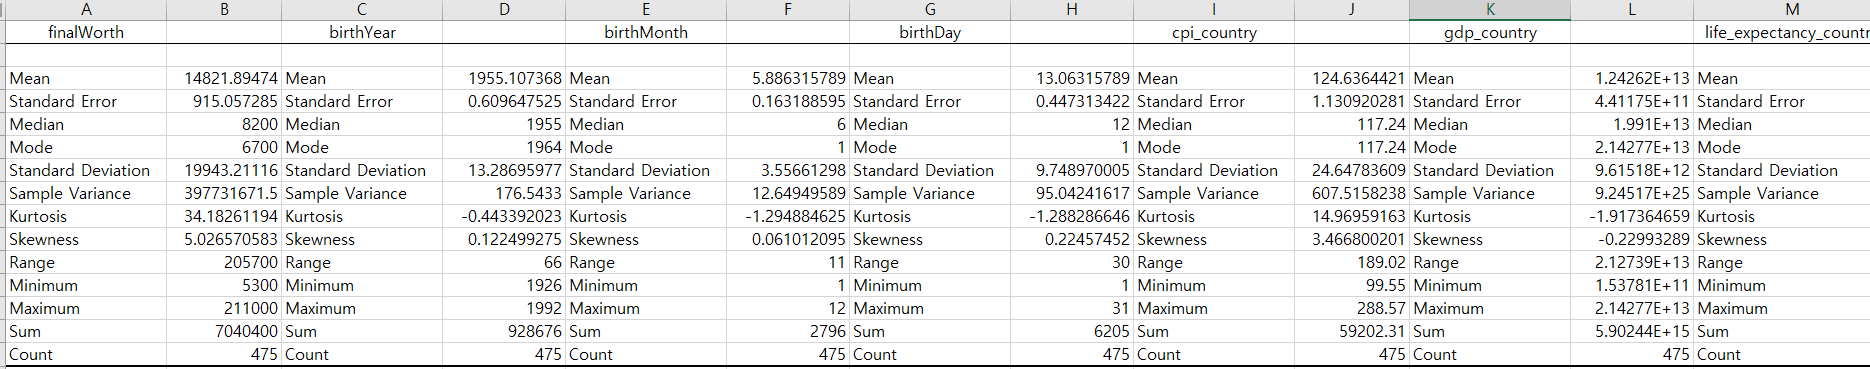
Descrittive statistics
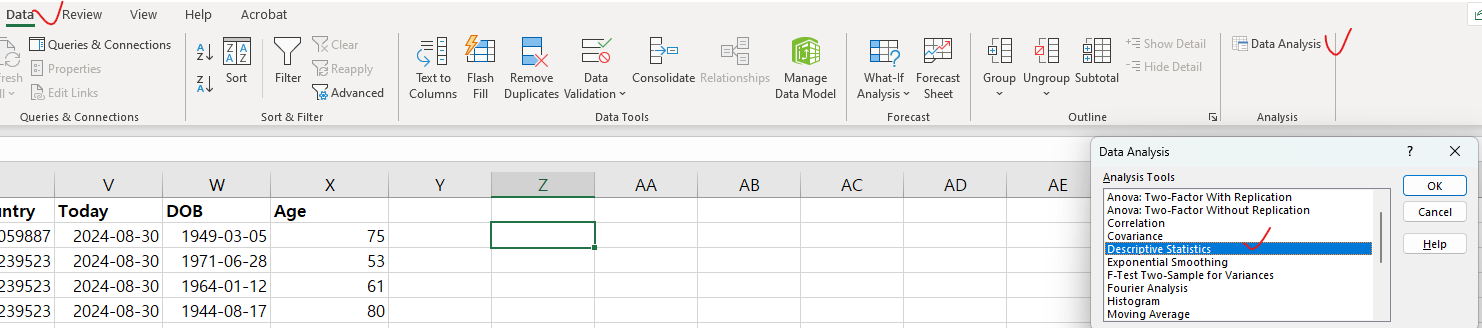
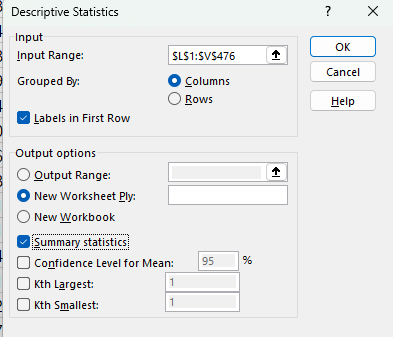
Basic analysis with descrittive statistics
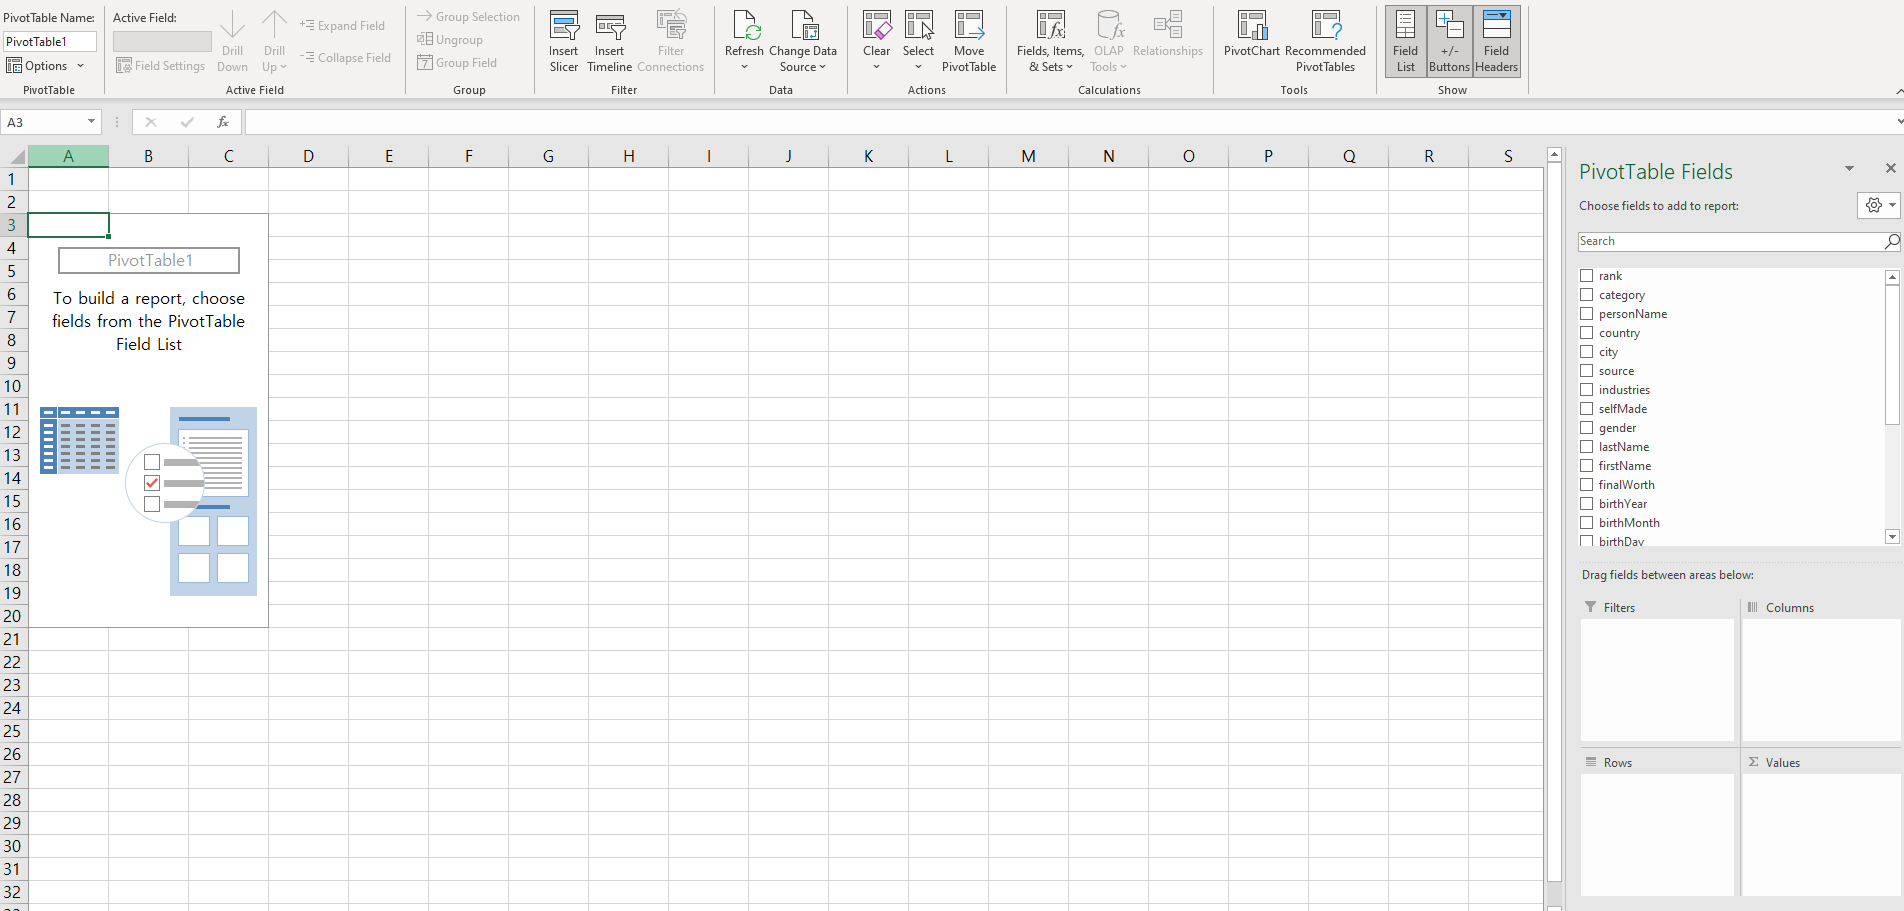
Advanced analysis with pivot tables
Find interesting or meaningful insights
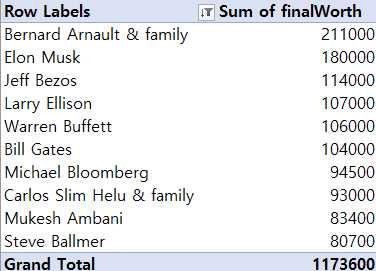
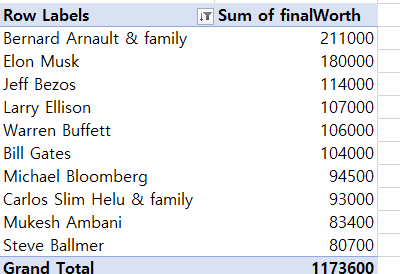
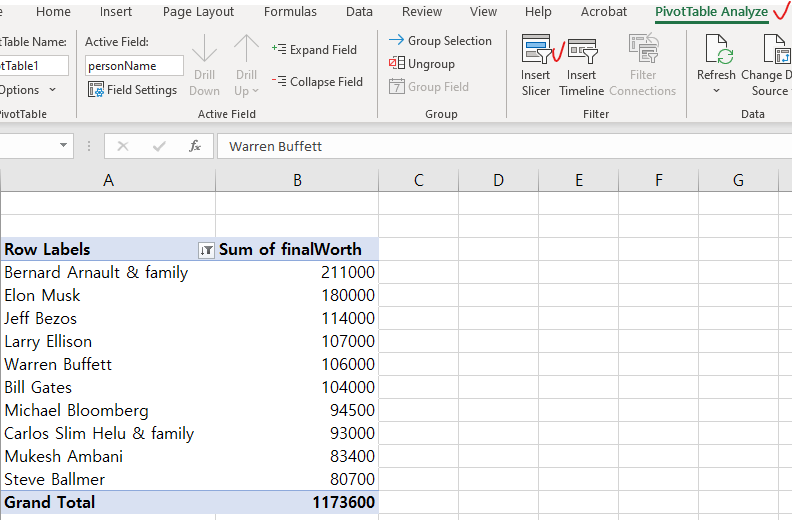
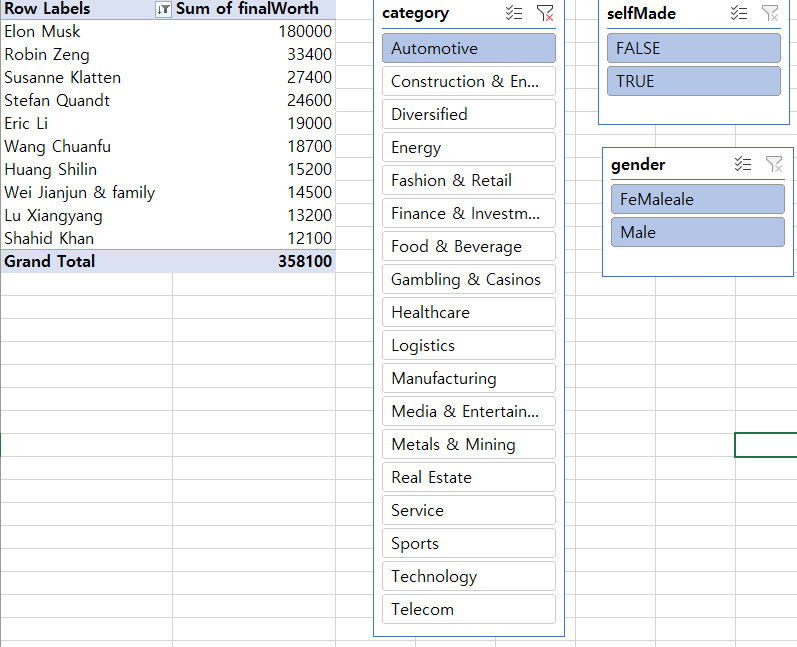
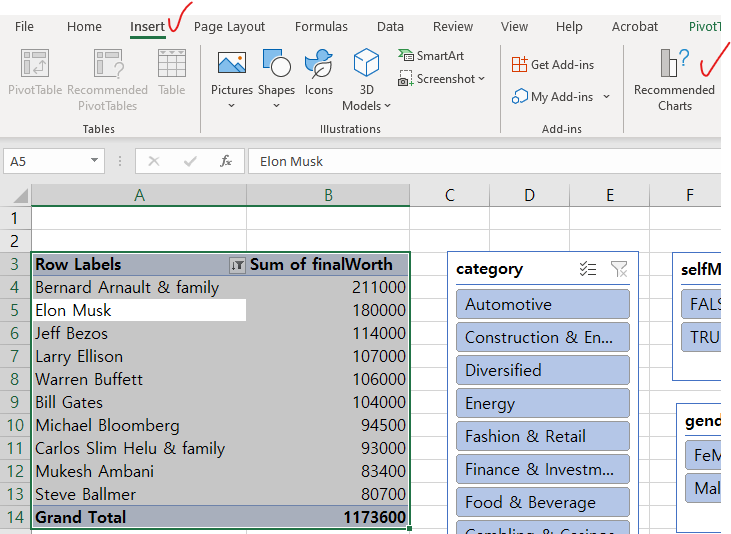
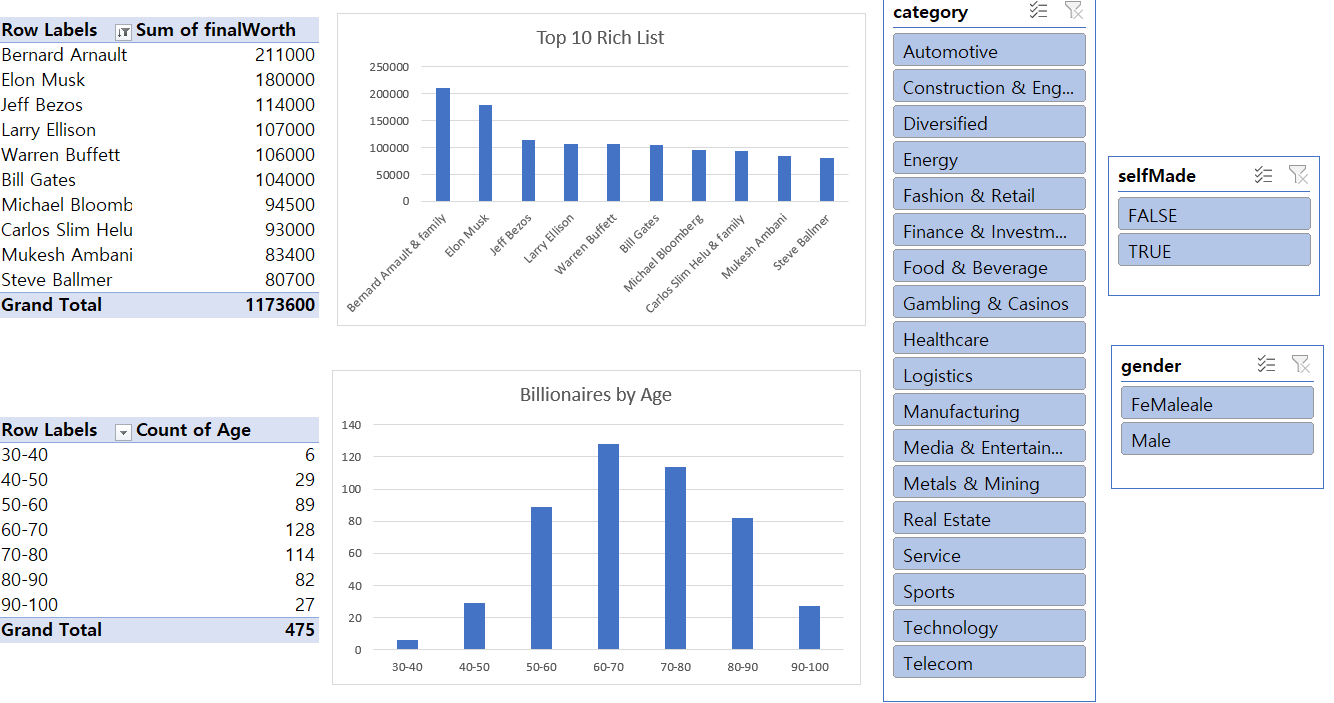
a. Find top 10 overall
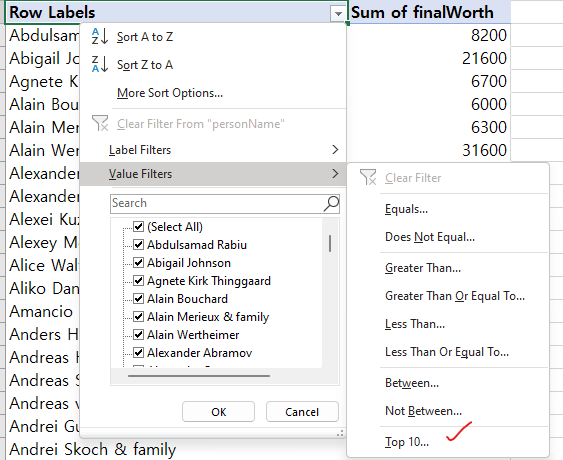
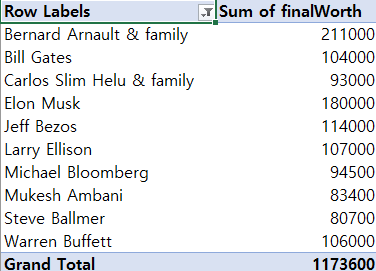
Sort by largest to smallest
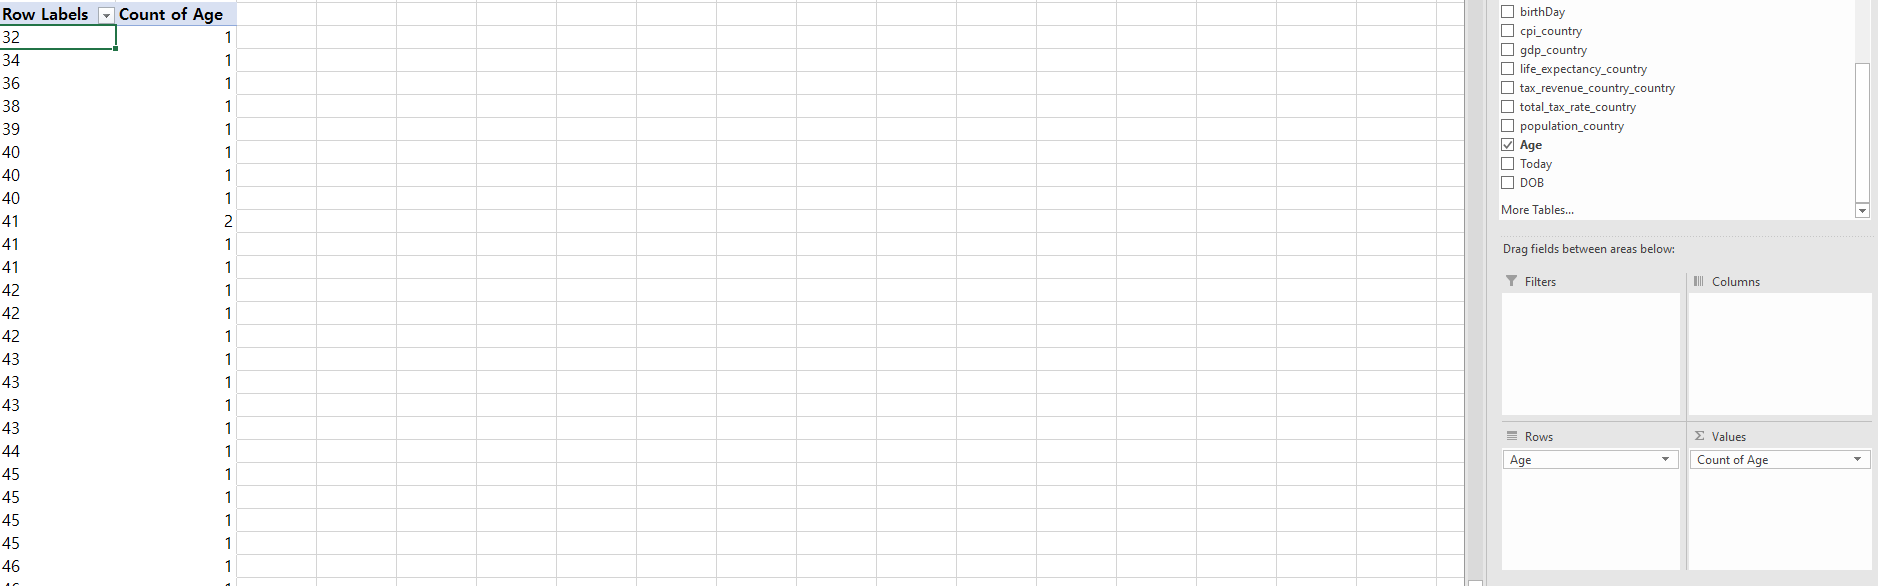
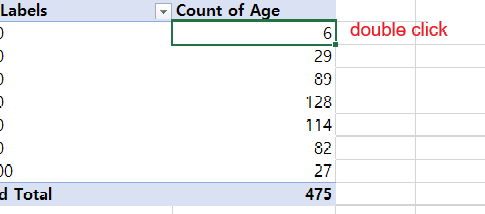
b. billionaires by age
change the value to count
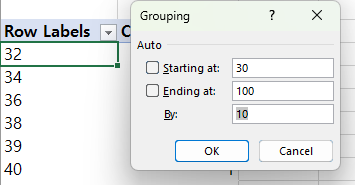
group function
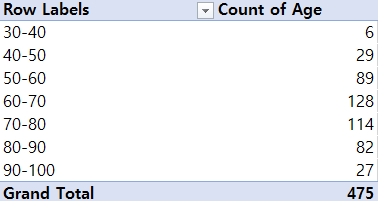
checking detail

3. Data visualization
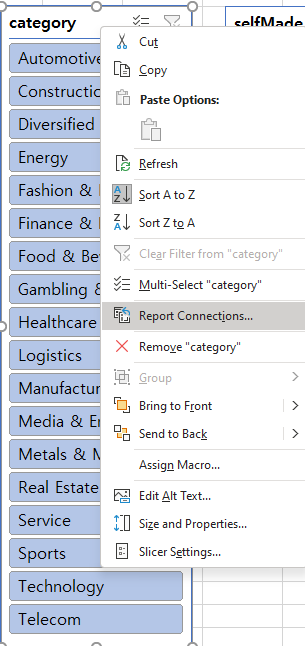
Make it more dynamic (sory by each industry,gender etc...)
Connect this to age table as well
Graphs for visual impact
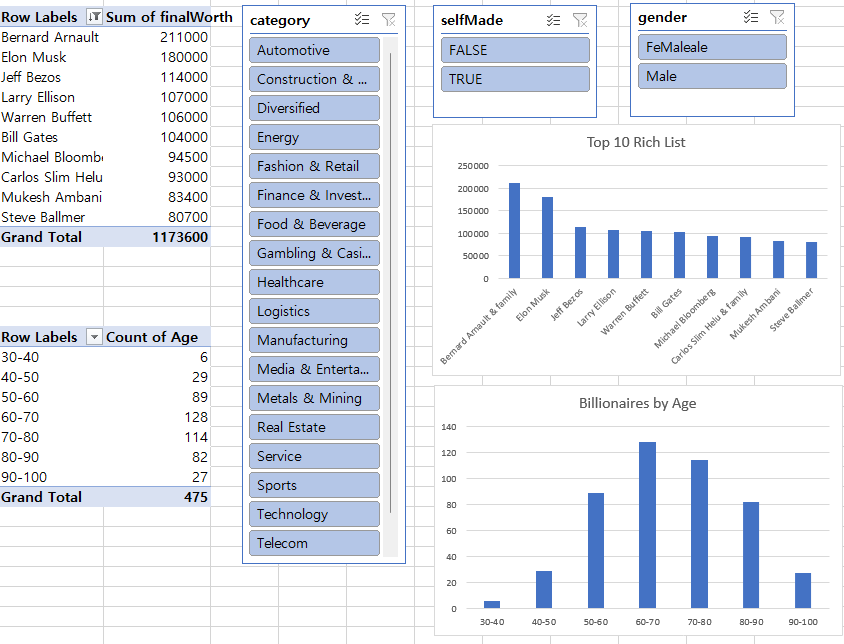
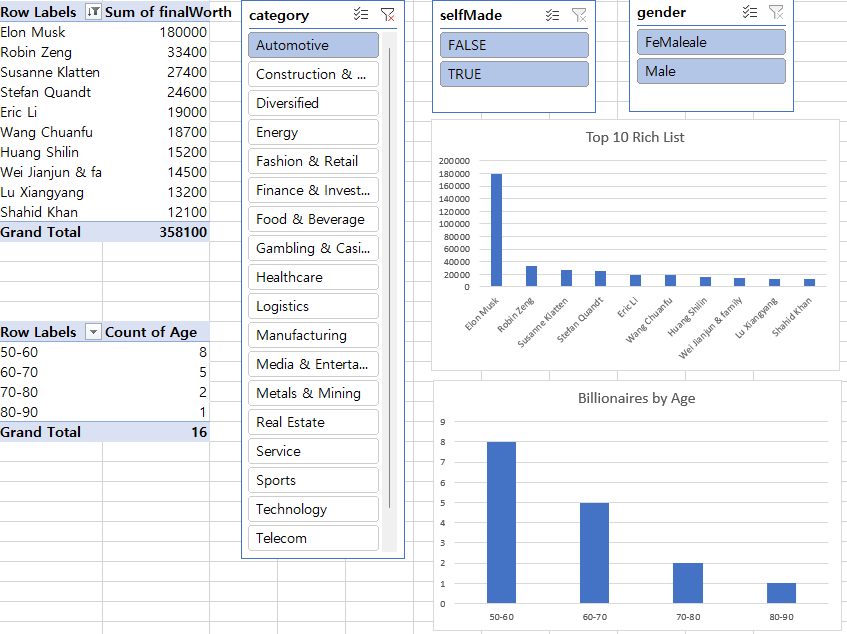
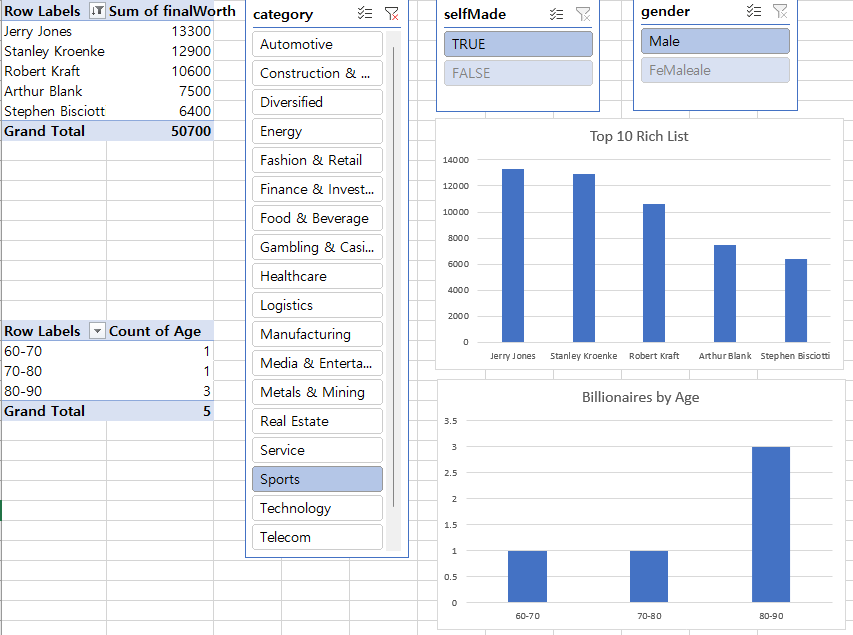
Make it like a dashboard

Full of adventure