1.네이버 영화 평점 사이트 데이터 분석
- 네이버 영화 사이트에서 영화랭킹 탭 이동
- 영화랭킹에서 평점순(현재상영영화) 선택
출처 : https://movie.naver.com/movie/sdb/rank/rmovie.naver?sel=cur&date=20210914
2. 데이터 찾기
필요한 모둘 호출
import pandas as pd
from urllib.request import urlopen
from bs4 import BeautifulSoup
일단 한 페이지만 접근해서 형태 확인 (20210806)
url = "https://movie.naver.com/movie/sdb/rank/rmovie.naver sel=cur&date=20210806"
response = urlopen(url)

soup = BeautifulSoup(response, "html.parser")
print(soup.prettify())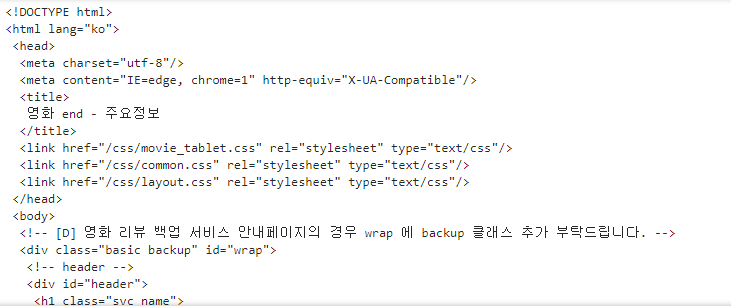
특정 영화 제목과 평점을 가져오기
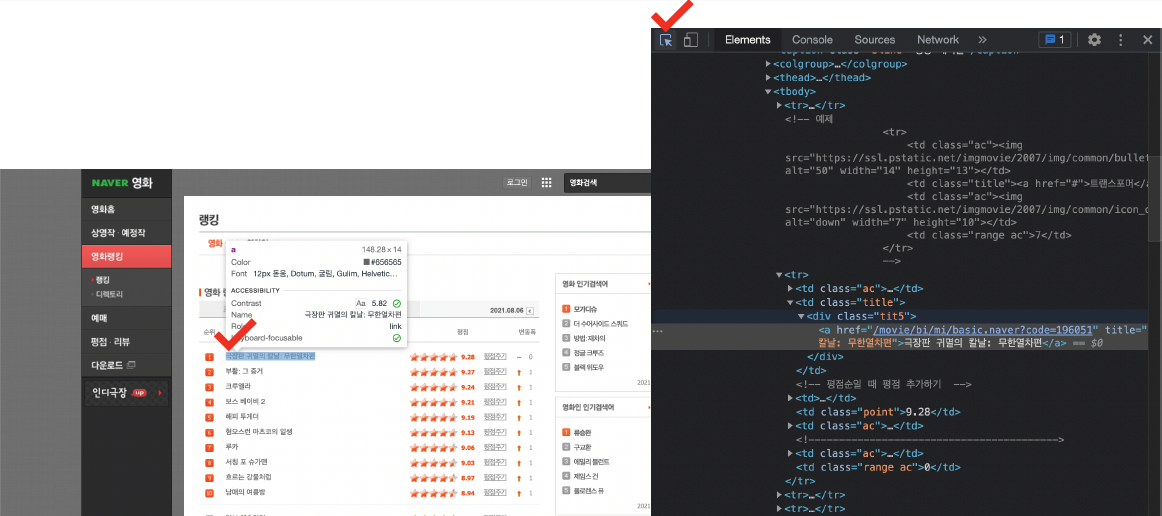
- 영화 제목은 td class = "title" 안에 div class = "tit5" 안에 a 태그 안에
- 영화 평점은 td class="point"
find_all 명령으로 해당 tag 접근
soup.find_all("div", "tit5")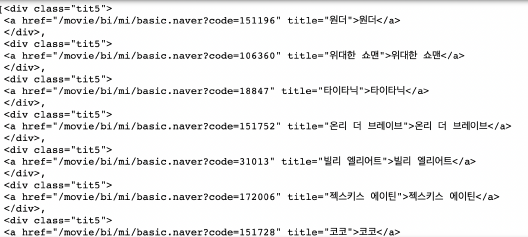
영화 제목은 a 태그에서 string으로 글자를 가져온다
soup.find_all("div", "tit5")[0].a
soup.find_all("div", "tit5")[0].a.string 
td 태그에 point 클래스를 확인하여 영화 평점얻기
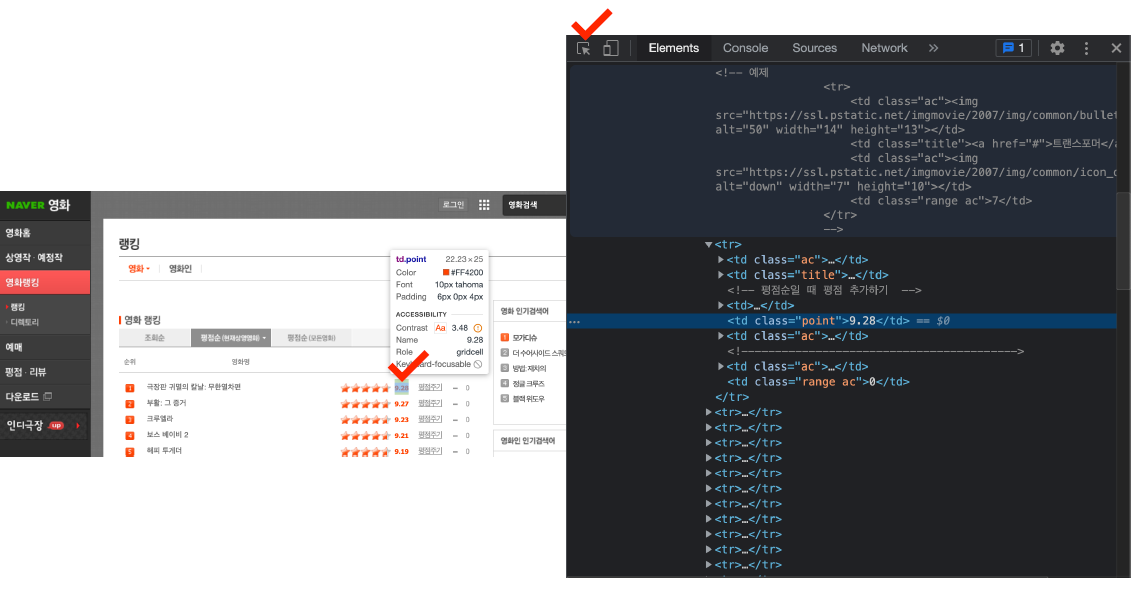
soup.find_all("td", "point")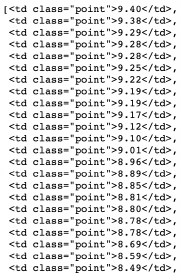
확인
len(soup.find_all("td", "point")), len(soup.find_all("div", "tit5"))
soup.find_all("td", class_="point")[0].text, soup.select("td.point")[0].string
반복문으로 나머지 데이터 다 가져오기
end = len(soup.find_all("div", "tit5"))

movie_name = [soup.select(".tit5")[n].a.string for n in range(0, end)]
movie_name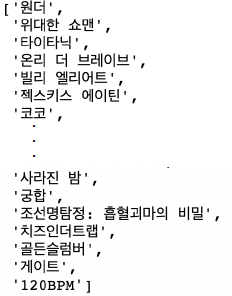
영화평점 데이터 가져오기
end = len(soup.find_all("td", "point"))

movie_point = [soup.find_all("td", "point")[n].string for n in range(0, end)]
movie_point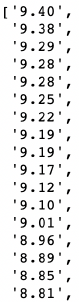
전체 데이터 수 확인
len(movie_name), len(movie_point)
3.자동화 위한 코드
위의 방법으로 날짜만 바꿔주면 원하는 기간 만큼의 데이터를 얻을 수 있다.
date = pd.date_range("2021.01.01", periods=100, freq="D")
date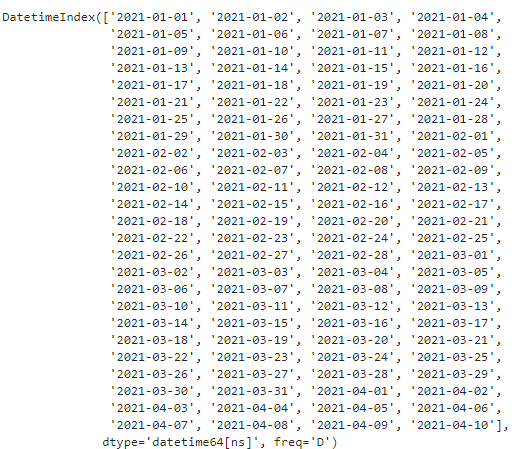
날짜 테이터를 원하는 형태로 출력 가능
date[0]
date[0].strftime("%Y-%m-%d")
date[0].strftime("%Y.%m.%d")
필요한 모듈 호출 후 100일 간으로 데이터 뽑는 반복문 실행
import time
from tqdm import tqdm

movie_date = []
movie_name = []
movie_point = []

for today in tqdm(date):
    url = "https://movie.naver.com/movie/sdb/rank/rmovie.naver?sel=cur&date={date}"
    response = urlopen(url.format(date=today.strftime("%Y%m%d")))
    soup = BeautifulSoup(response, "html.parser")

    end = len(soup.find_all("td", "point"))

    movie_date.extend([today for _ in range(0, end)])
    movie_name.extend([soup.select("div.tit5")[n].find("a").get_text() for n in range(0, end)])
    movie_point.extend([soup.find_all("td", "point")[n].string for n in range(0, end)])

    time.sleep(0.5)
들어온 데이터의 수 확인
len(movie_date), len(movie_name), len(movie_point)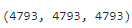
이제 Dataframe으로 만들기
movie = pd.DataFrame({
    "date": movie_date,
    "name": movie_name,
    "point": movie_point
})
movie.tail()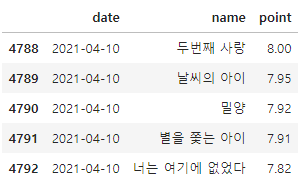
만든 dataframe의 기본 정보 확인
movie.info()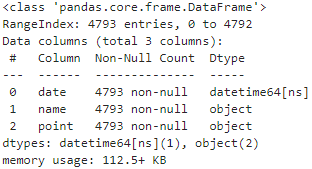
point가 오브젝트 형태니 숫자로 변경해준다.
movie["point"] = movie["point"].astype(float)
movie.info()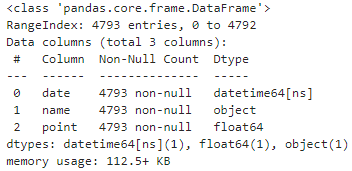
데이터 저장
movie.to_csv("../data/03. naver_movie_data.csv", sep=",", encoding="utf-8")4. 영화 평점 데이터 정리
- 영화 이름으로 index를 설정하고 접수의 합산 구한다
- 100일간 평점 합산 베스트&워스트 10 선정
movie_unique = pd.pivot_table(data=movie, index="name", aggfunc=np.sum)
movie_unique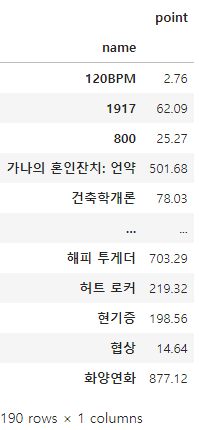
movie_best = movie_unique.sort_values(by="point", ascending=False)
movie_best.head()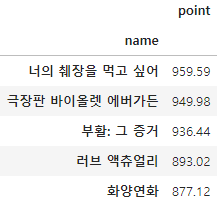
tmp = movie.query("name == ['화양연화']")
tmp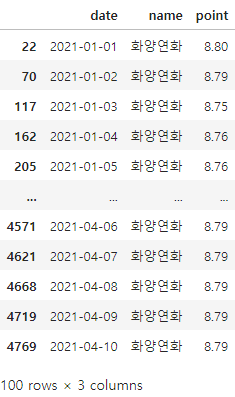
5. 네이버 영화 평점 데이터 시각화
필요한 모듈 호출
import matplotlib.pyplot as plt
import seaborn as sns
%matplotlib inline
from matplotlib import rc
rc("font", family="Malgun Gothic")
날짜에 따른 평점 변화를 선그래프로 표현(시계열)
- 선 그래프 x축 날짜, y축 평점
plt.figure(figsize=(20, 8)) # x 20, y, 8
plt.plot(tmp["date"], tmp["point"])
plt.title("날짜별 평점")
plt.xlabel("날짜")
plt.ylabel("평점")
plt.xticks(rotation="vertical")
plt.legend(labels=["평점 추이"], loc="best")
plt.grid(True)
plt.show()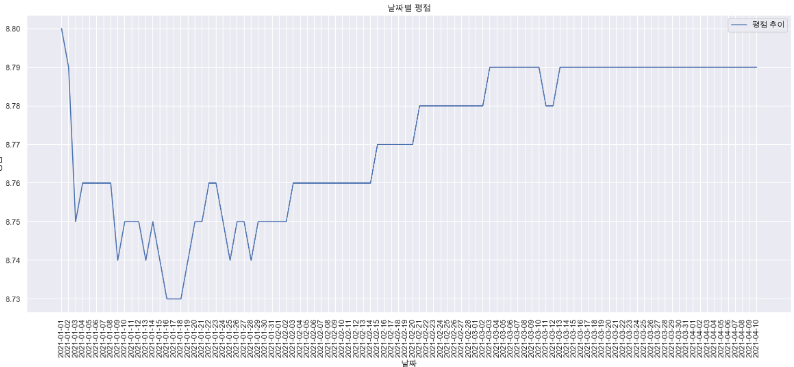
상위 10개 영화
movie_best.head(10)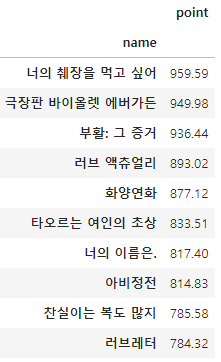
하위 10개 영화
movie_best.tail(10)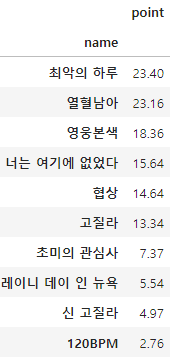
100일 간 영화를 모두 정리
movie_pivot = pd.pivot_table(data=movie, index="date", columns="name", values="point")
movie_pivot.head()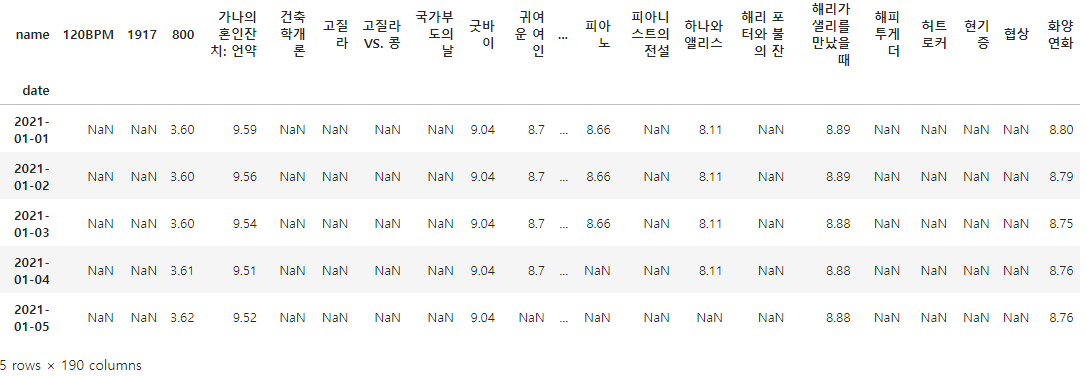
접근의 편의를 위해 excel로 저장
movie_pivot.to_excel("../data/03. movie_pivot.xlsx")추가로 확인하고 싶은 영화 몇개만 그래프로 확인
target_col = ["화양연화", "국가부도의 날", "하나와 앨리스", "늑대와 춤을", "피아노"]
plt.figure(figsize=(20, 8))
plt.title("날짜별 평점")
plt.xlabel("날짜")
plt.ylabel("평점")
plt.xticks(rotation="vertical")
plt.tick_params(bottom="off", labelbottom="off")
plt.plot(movie_pivot[target_col])
plt.legend(target_col, loc="best")
plt.grid(True)
plt.show()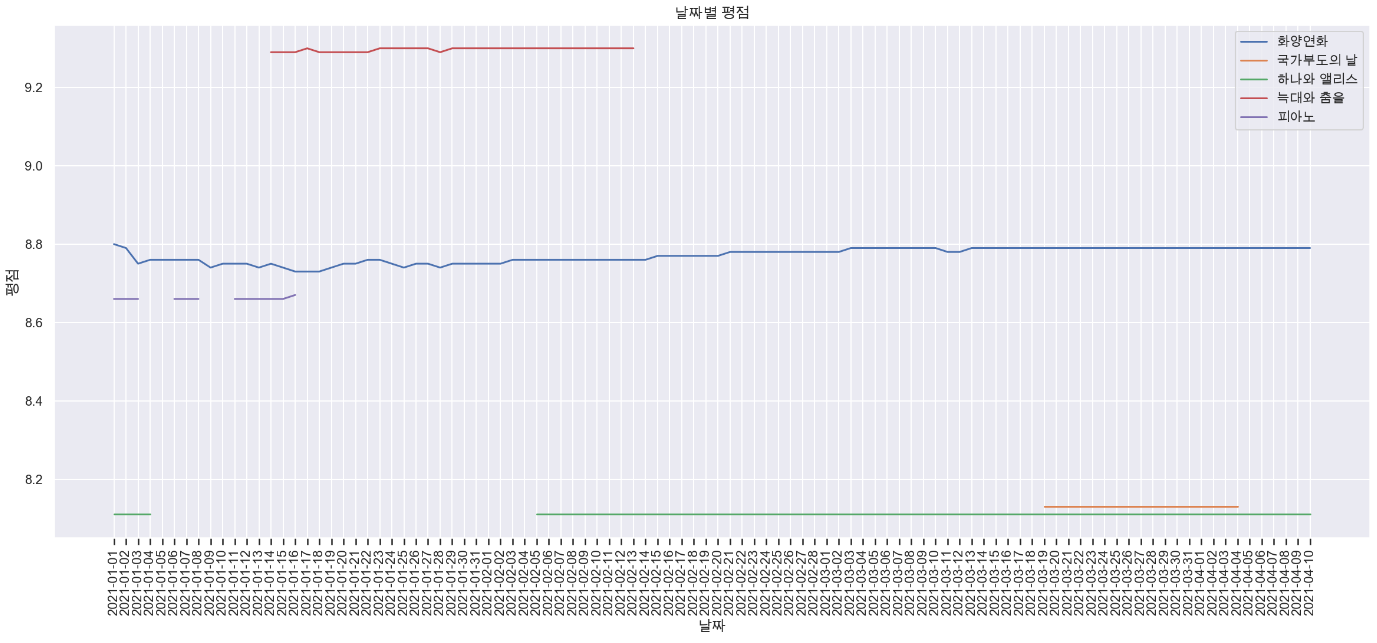

Full of adventure