Mean Shift Clustering 개요
K-Means랑 유사한데 차이점은
K-means는 중심에 소속된 데이터의 평균 거리 중심으로 이동하는 데 반해,
Mean Shift는 중심을 데이터가 모여있는 밀도가 가장 높은 곳으로 이동 시킴
특징
KDE (Kernel Density Estimation)로 확률 밀도 함수 (Probability Density Function)을 찾음
KDE를 이용하여 데이터 포인트들이 데이터 분포가 높은 곳으로 이동하면서 군집화를 수행
별도의 군집화 개수를 지정하지 않고, 데이터 분포도에 기반하여 자동으로 군집 개수 선정
커널 함수를 통해 어떤 변수의 확률 밀도 함수를 추정하는 대표적인 방법
커널 함수는 대표적으로 가우시안 분포 함수 (정규 분포 함수)가 사용됨
sklearn.cluster.MeanShift
class sklearn.cluster.MeanShift(*, bandwidth=None, seeds=None, bin_seeding=False, min_bin_freq=1, cluster_all=True, n_jobs=None, max_iter=300)[source]
bandwidthfloat, default=None
Bandwidth used in the RBF kernel.
If not given, the bandwidth is estimated using sklearn.cluster.estimate_bandwidth; see the documentation for that function for hints on scalability (see also the Notes, below)
Mean Shift Clustering 실습
make_blobs를 통해 군집화 샘플데이터 생성
import numpy as np
from sklearn.datasets import make_blobs
from sklearn.cluster import MeanShift

x,y = make_blobs(n_features=2,n_samples=200,centers=3,
                cluster_std=0.7,random_state=0)

meanshift = MeanShift(bandwidth=1)
cluster_labels = meanshift.fit_predict(x)
print('cluster labels 유형',np.unique(cluster_labels))
이때 커널에서 사용할 bandwidth를 조정해 주어야하는데 sklearn에 있는 estimate_bandwidth를 사용하겠습니다.
sklearn.cluster.estimate_bandwidth
sklearn.cluster.estimatebandwidth(_X, *, quantile=0.3, n_samples=None, random_state=0, n_jobs=None)[source]
## 최적의 bandwidth 값을 찾기위한 라이브러리
from sklearn.cluster import estimate_bandwidth

bandwidth = estimate_bandwidth(x)
print('bandwidth 값 ', round(bandwidth,3))
bandwidth 값 1.816
import pandas as pd

cluster_df = pd.DataFrame(x,columns=['ftr1','ftr2'])
cluster_df['target'] = y

# 최적의 bandwidth 값 계산
best_bandwidth = estimate_bandwidth(x)

meanshift = MeanShift(bandwidth=best_bandwidth)
cluster_labels = meanshift.fit_predict(x)
print('cluster labels 유형',np.unique(cluster_labels))
cluster labels 유형 [0 1 2]
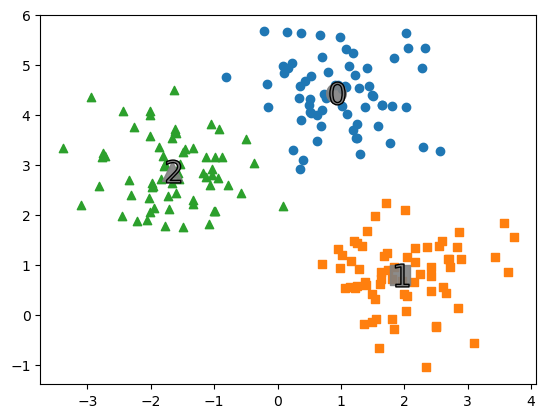
import matplotlib.pyplot as plt

cluster_df['meanshift_label'] = cluster_labels
centers = meanshift.cluster_centers_
unique_labels = np.unique(cluster_labels)
markers = ['o','s','^','x','*']

for label in unique_labels:
    label_cluster = cluster_df[cluster_df['meanshift_label']==label]
    center_x_y = centers[label]
    # 군집별로 다른 마커로 산점도 적용
    plt.scatter(x=label_cluster['ftr1'],y=label_cluster['ftr2'],marker=markers[label])

    # 군집별 중심 표현
    plt.scatter(x=center_x_y[0],y=center_x_y[1],s=200,color='gray',alpha=0.9,marker=markers[label])
    plt.scatter(x=center_x_y[0],y=center_x_y[1],s=270,color='gray',edgecolors='k',marker='$%d$' % label)
plt.show()