roc_curve 는 임계값을 변화함에 따라 fpr과 tpr의 변화를 나타낸 plot으로 y=x를 기준으로 위에그려지는 포물선을 보고 평가할 수있다
이때 roc_curve밑에 값을 auc라고 하는데 이 auc값은 0.5보다 크고 1보다 작은 값으로 1에 가까울수록 좋다고 평가 할 수있지만 1에 너무 가까운 값은 검증단계에서 과적합되었다고 볼 수 있다.
# label,feature
x_train = train_df.drop("Survived",axis=1)
y_train = train_df['Survived']
x_test = test_df
y_test = y_test['Survived']

## logistic regression
lr = LogisticRegression()
lr.fit(x_train,y_train)
pred = lr.predict(x_test)
pred_proba = lr.predict_proba(x_test)
roc_curve는 fprs,tprs,threshold값을 출력해 준다
from sklearn.metrics import roc_curve
import matplotlib.pyplot as plt

# 레이블 값이 1일때의 예측 확률을 추출
pred_proba_class1 = lr.predict_proba(x_test)[:,1]

fprs, tprs, thresholds = roc_curve(y_test,pred_proba_class1)
# 반환된 임계값 배열에서 샘플로 데이터를 추출하되, 임계값을 5step으로 추출.
# threshold[0]은 max(예측확률)+1로 임의 설정됨. 이를 제외하기 위해 np.arange는 1부터 시작

thr_index = np.arange(1,thresholds.shape[0],5)
print('샘플 index로 추출한 임계값:', np.round(thresholds[thr_index],2),"\n")

## 임계값에 따른 fpr.tpr
print('fpr:',np.round(fprs[thr_index],2),"\n")
print('tpr:',np.round(tprs[thr_index],2))
샘플 index로 추출한 임계값: [0.97 0.88 0.83 0.77 0.66 0.63 0.61 0.59 0.57 0.54 0.51 0.41 0.27 0.25
0.22 0.16 0.14 0.13 0.11 0.1 0.1 0.08]
fpr: [0. 0. 0. 0. 0.01 0.01 0.02 0.03 0.05 0.06 0.08 0.14 0.27 0.33
0.39 0.47 0.55 0.65 0.75 0.8 0.92 0.96]
tpr: [0.01 0.25 0.41 0.54 0.64 0.72 0.84 0.87 0.88 0.96 0.99 1. 1. 1.
1. 1. 1. 1. 1. 1. 1. 1. ]
이때 변화에 임계값 변화에 따른 값의 변화를 시각화하면 roc_curve가 그려진다
함수를 만들어서 실습해 보겠습니다.
def roc_curve_plot(y_test,pred_proba_c1):
    fprs, tprs, thresholds = roc_curve(y_test,pred_proba_c1)

    # Roc curve를 plot 곡선으로 기름
    plt.plot(fprs,tprs,label='ROC')
    ## 가운데 대각선 직선을 그림
    plt.plot([0,1],[0,1],"k--",label="ramdom")

    ## fpr x축을 scale을 0.1단위로 변경 x,y축 명 설정
    start,end = plt.xlim()
    plt.xticks(np.round(np.arange(start,end,0.1),2))
    plt.xlim(0,1)
    plt.ylim(0,1)
    plt.xlabel('FPR(1-sensitivity)')
    plt.ylabel('TPR(recall)')
    plt.legend()
    plt.show()

roc_curve_plot(y_test,pred_proba_class1)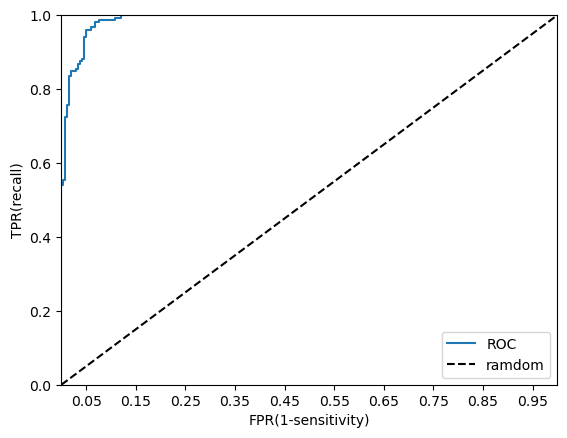
이렇게 그려진 포물선 밑에 값이 auc인데 이값을 구하는 라이브러리가 존재한다.
from sklearn.metrics import roc_auc_score
# 일반적으로 label에 큰값의 proba열을 사용하여 적합
pred_proba = lr.predict_proba(x_test)
roc_score_prob = roc_auc_score(y_test,pred_proba[:,1])
print(f'Roc Auc score {np.round(roc_score_prob,4)}')
Roc Auc score 0.9888

Just Enjoy Yourself