다항 회귀
- 데이터가 단순한 직선 형태가 아닌 비선형의 형태를 갖고 있을 때, 각 변수의 거듭제곱을 새로운 변수로 추가하면 선형 모델을 사용 가능
- 이렇게 확장된 특성을 데이터세트에 선형 모델로 훈련시키는 기법이 다항회귀
import pandas as pd

## 시리얼 데이터 로드
cereal = pd.read_csv('./data/cereal.csv')


## 불필요한 컬럼을 제거하고 sugar가 0이상인 데이터만 추출
cereal = cereal[cereal.columns[3:]]
cereal =cereal[cereal.sugars >=0]
cereal.head()
## 설탕 함유량에 따른 영양등급평가 다항 회귀
## 두 변수의 관계를 확인하기 위한 그래프 시각화
import matplotlib.pyplot as plt
cereal2 = cereal[['sugars', 'rating']]
cereal2.sort_values(by=['sugars'], inplace =True)
cereal2.reset_index(drop=True, inplace =True)
x=cereal2['sugars'].values
y=cereal2['rating'].values
plt.scatter(x,y)
plt.show()
## 데이터의 분할


from sklearn.model_selection import train_test_split
X_train, X_test, y_train, y_test = train_test_split(x, y, test_size =0.3, random_state =1)
print(X_train.shape, X_test.shape)
print(y_train.shape, y_test.shape)
## PolynomialFeatures로 2차 다항식 조건 생성
## x_poly는 교차항과 2차항을 포함한 데이터로 변환
## LinearRegression으로 데이터 학습
from sklearn.preprocessing import PolynomialFeatures
## degree는 다항식의 차수를 결정
poly_reg=PolynomialFeatures(degree=2)
## 데이터를 적합시킨뒤 변환
X_poly=poly_reg.fit_transform(X_train.reshape(-1,1))
from sklearn.linear_model import LinearRegression
reg = LinearRegression()
reg.fit(X_poly, y_train)import numpy as np
## 데이터를 다항 변수로 변환
X_test_poly=poly_reg.transform(X_test.reshape(-1,1))
pred=reg.predict(X_test_poly)
np.set_printoptions(precision=2) # 소수점 둘째자리까지 표현
print(np.concatenate((pred.reshape(len(pred),1), y_test.reshape(len(y_test),1)),1))## 성능평가지표를 통해 모델의 예측력 평가
from sklearn.metrics import mean_squared_error, mean_absolute_error, mean_squared_error
mse = mean_squared_error(y_test, pred)
mae = mean_absolute_error(y_test, pred)
rmse = np.sqrt(mse)
acc = reg.score(poly_reg.transform(X_test.reshape(-1,1)), y_test)
print('MSE\t{}'.format(round(mse,3)))
print('MAE\t{}'.format(round(mae,3)))
print('RMSE\t{}'.format(round(rmse,3)))
print('ACC\t{}%'.format(round(acc *100,3)))## 다항 회귀 분석 결과를 시각화
X_new=np.linspace(0,15,100).reshape(100,1)
X_new_poly=poly_reg.transform(X_new)
y_new = reg.predict(X_new_poly)
plt.plot(x,y, 'o', label ='Actual')
plt.plot(X_new, y_new, 'r-', label ='Prediction')
plt.legend()
plt.xlabel('Sugars_1')
plt.ylabel('Rating')
plt.show()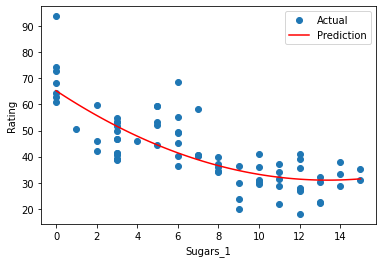
## 고차 다항 회귀 분석
X = cereal.iloc[:,:-1].values
y = cereal.iloc[:,-1].values

from sklearn.model_selection import train_test_split
X_train, X_test, y_train, y_test = train_test_split(X, y, test_size =0.3, random_state =1)
print (X_train.shape, X_test.shape, y_train.shape, y_test.shape)
## standardscaler
from sklearn.preprocessing import StandardScaler
sc = StandardScaler()
X_train = sc.fit_transform(X_train)
X_test = sc.transform(X_test)
## 고차항(2차)
from sklearn.preprocessing import PolynomialFeatures
poly_reg = PolynomialFeatures(degree=2)
from sklearn.linear_model import LinearRegression
X_poly = poly_reg.fit_transform(X_train)
reg = LinearRegression()
reg.fit(X_poly, y_train)import numpy as np
X_test_poly = poly_reg.transform(X_test)
pred = reg.predict(X_test_poly)
from sklearn.metrics import mean_squared_error, mean_absolute_error, mean_squared_error
mse = mean_squared_error(y_test, pred)
mae = mean_absolute_error(y_test, pred)
rmse = np.sqrt(mse)
acc = reg.score(poly_reg.transform(X_test), y_test)
print('MSE\t{}'.format(round(mse,3)))
print('MAE\t{}'.format(round(mae,3)))
print('RMSE\t{}'.format(round(rmse,3)))
print('ACC\t{}%'.format(round(acc *100,3)))평가지표 값이 더 나아진것을 확인 할 수 있다.

Just Enjoy Yourself