개인스터디
문제풀이 세션
SQL - 이준수튜터님
문제 1) CTR 🟢
카카오 광고 분석을 위한 ad_events 테이블이 있습니다.
2022년 동안 발생한 클릭률(Click-Through Rate, CTR)을 계산하는 SQL 쿼리를 작성하세요. 결과는 ad_id 기준으로 오름차 정렬하세요. 소수점 둘째 자리까지 반올림하여 출력하세요.
📌 CTR(클릭률) 공식:
CTR = 100.0 * ( Click 수 / Impression 수 )
풀이
WITH clicks AS
(
SELECT ad_id,
	   COUNT(*) AS cnt_click
FROM ad_events ae
WHERE event_type = 'click'
GROUP BY ad_id
),
impressions AS
(
SELECT ad_id,
	   COUNT(*) AS cnt_impression
FROM ad_events ae
WHERE event_type = 'impression'
GROUP BY ad_id
)
SELECT c.ad_id,
       ROUND(100.0 * (c.cnt_click / i.cnt_impression),2) AS CTR
FROM clicks c INNER JOIN impressions i
ON c.ad_id = i.ad_id
ORDER BY ad_id;
해설
SELECT ad_id,
	   ROUND(SUM(CASE WHEN event_type = 'click' THEN 1 ELSE 0 END) * 100.0 /
	   	     SUM(CASE WHEN event_type = 'impression' THEN 1 ELSE 0 END), 2) AS ctr
FROM ad_events
GROUP BY 1
ORDER BY 1
문제 2) VIP 고객 조회 🟡
쿠팡의 고객 구매 데이터를 분석하여 VIP 고객을 식별하려고 합니다. 모든 제품 카테고리에서 최소 1개 이상의 상품을 구매한 고객을 VIP 고객이라 정의합니다. VIP 고객의 customer_id를 조회하는 SQL 쿼리를 작성하세요. 결과는 고객 ID 기준으로 오름차 정렬하세요.
풀이
WITH total_ctg AS (
  SELECT COUNT(DISTINCT product_category) AS cnt_ctg
  FROM products
),
order_ctg AS (
  SELECT
    co.customer_id,
    COUNT(DISTINCT p.product_category) AS cnt_ctg
  FROM customer_orders co
  JOIN products p ON co.product_id = p.product_id
  GROUP BY co.customer_id
)
SELECT o.customer_id
FROM order_ctg o
INNER JOIN total_ctg c
ON o.cnt_ctg = c.cnt_ctg
ORDER BY o.customer_id;
해설
SELECT co.customer_id,
       COUNT(DISTINCT p.product_category)
FROM customer_orders co
JOIN products p
ON co.product_id = p.product_id
GROUP BY co.customer_id
HAVING COUNT(DISTINCT p.product_category) >=
       (SELECT COUNT(DISTINCT product_category) FROM products)
나는 왜 WITH를 사랑하게 되었는가..
약간 구조적으로 더 효율적일 수 있는 코드를 자꾸 WITH 활용해서 어렵게 가는 것 같다 😅
튜터님 코드가 더 간결해서 실행 속도가 빠를 것 같음
문제 3) 3일 이동 평균 계산 🔴
각 사용자의 블로그 게시글 수에 대한 3일 이동 평균을 계산하여 user_id, post_date, rolling_avg_3d 값을 출력하는 SQL 쿼리를 작성하세요. 결과는 소수점 둘째 자리까지 반올림하여 출력하세요. 결과는 고객 ID, 게시글 작성 날짜 기준으로 오름차 정렬하세요.
📌 이동 평균(rolling average) 정의
- 이동 평균은 시계열 데이터를 분석할 때 일정 기간 동안의 평균을 계산하는 기법입니다.
- 이 문제에서는 각 사용자의 3일 이동평균(3-day rolling average)을 구해야 합니다.
- 즉, 각 날짜의 게시글 수와 그 이전 2일간의 게시글 수 평균을 계산해야 합니다.
- 데이터가 3일보다 적으면 가능한 범위 내에서 평균을 구합니다.
풀이
SELECT user_id,
	   post_date,
	   (SUM(post_count) / COUNT(post_date)) AS rolling_avg_3d
FROM blog_posts
GROUP BY user_id
ORDER BY user_id, post_date
완전 틀려버렸다ㅎ 시간이 부족했다는 변명을 곁들여 봅니다..
해설
SELECT user_id,
	   post_date,
	   ROUND(AVG(post_count) OVER(
	   PARTITION BY user_id
	   ORDER BY post_date
	   ROWS BETWEEN 2 PRECEDING AND CURRENT ROW),2) AS rolling_avg_3d
FROM blog_posts
ORDER BY user_id
ROWS BETWEEN 2 PRECEDING AND CURRENT ROW
지금 행 포함해서 과거 2개 행까지 포함
문제 4) 주문 데이터 수정 🔴
각 주문(order_id)이 다음 행(order_id + 1)의 음식(item)과 바뀌어 저장되는 오류가 발생했습니다. 이 오류를 수정하여 올바른 주문 ID와 음식(item) 쌍을 출력하는 SQL 쿼리를 작성하세요. 결과는 수정된 주문 ID 기준으로 오름차 정렬하세요.
📌 조건
- 짝수 order_id는 이전 order_id - 1의 item과 매칭되어야 합니다.
- 홀수 order_id는 다음 짝수 order_id의 item과 매칭되어야 합니다.
- 마지막 주문(order_id가 홀수일 경우)는 변경하지 않고 그대로 유지해야 합니다.
풀이
이건 아예 못 풀었습니다..lead lag 쓰면 될 거 같다는 생각을 했는데 어려웠음
해설
WITH oc AS
(
SELECT max(order_id) AS max_order_id
FROM orders
)
SELECT CASE
       	WHEN order_id % 2 != 0 AND order_id != max_order_id THEN order_id + 1
       	WHEN order_id % 2 != 0 AND order_id = max_order_id THEN order_id
       	ELSE order_id -1
       END AS corrected_order_id,
       item
FROM orders
CROSS JOIN oc
ORDER BY corrected_order_id
LEAD, LAG 사용 시
- 경민님 쿼리
WITH idrank as (
		SELECT *,
			   RANK() OVER(ORDER BY order_id desc) as rank_id
		FROM orders
)
SELECT order_id as corrected_order_id,
	   CASE
		    WHEN order_id % 2 = 1 AND rank_id <> 1 THEN LEAD(item) OVER (ORDER BY order_id)
	 	    WHEN order_id % 2 = 0 AND rank_id <> 1 THEN LAG(item) OVER (ORDER BY order_id)
	 	    ELSE item
	   END As item
FROM idrank
ORDER BY corrected_order_id;- 동진님 쿼리
SELECT
	order_id AS corrected_order_id
	, COALESCE(CASE WHEN order_id % 2 = 0 THEN even
		  		    ELSE odd END, item) AS item
FROM
(
SELECT
	order_id
	, item
	, LEAD(item) OVER(ORDER BY order_id) AS odd
	, LAG(item) OVER(ORDER BY order_id) AS even
FROM orders
) a
ORDER BY order_id
데이터 전처리 & 시각화 4주차
matplotlib
예제 그래프 그려보기
import matplotlib.pyplot as plt

x = [1,2,3,4,5]
y = [2,4,6,8,10]

plt.plot(x, y)
plt.xlabel('x=axis')
plt.ylabel('y=axis')
plt.title('Example')
plt.show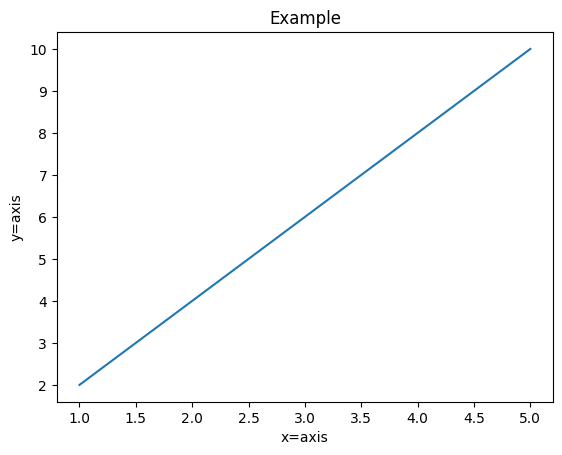
+ pandas
import pandas as pd

df = pd.DataFrame({
    'A' : [1,2,3,4,5],
    'B' : [5,4,3,2,1]
    })
df

df.plot(x='A', y='B') #컬럼 넣어주기
plt.show()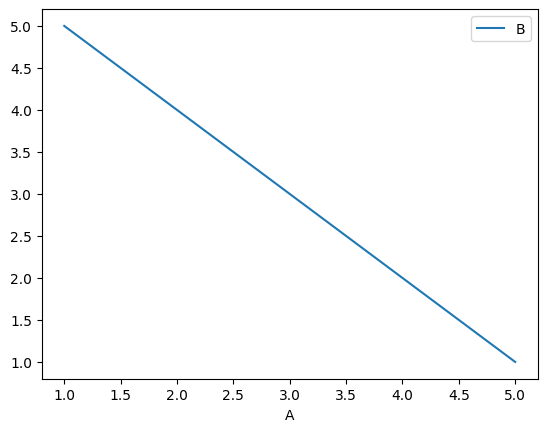
스타일 설정
df.plot(x='A', y='B', color='green', linestyle='--', marker='o')
plt.show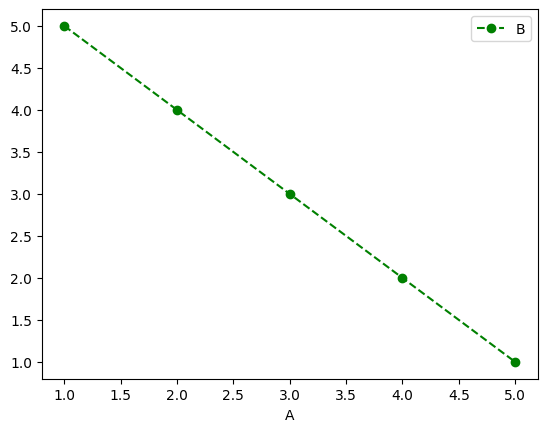
범례 설정
df.plot(x='A', y='B', color='red', linestyle='--', marker='o', label='Data Series')
plt.show
ax = df.plot(x='A', y='B', color='red', linestyle='--', marker='o')
ax.legend(['Data Series']) #legend 메소드 사용 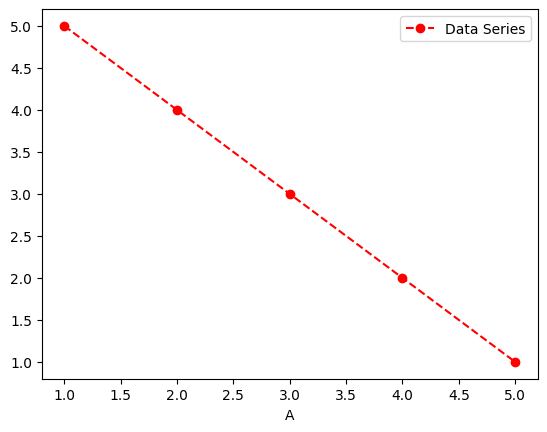
축, 제목 입력
ax = df.plot(x='A', y='B', color='red', linestyle='--', marker='o')
ax.legend(['Data Series'])
ax.set_xlabel('X = axis')
ax.set_ylabel('Y = axis')
ax.set_title('Title')
plt.show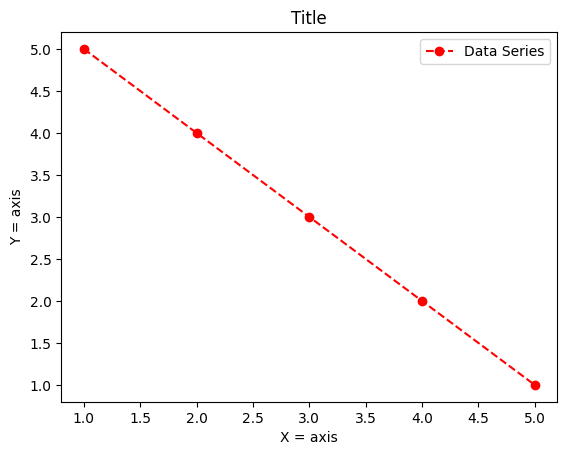
텍스트 입력
ax = df.plot(x='A', y='B', color='red', linestyle='--', marker='o')
ax.legend(['Data Series'])
ax.set_xlabel('X = axis')
ax.set_ylabel('Y = axis')
ax.set_title('Title')
ax.text(3, 3, 'Some text', fontsize = 12)
ax.text(2, 4, 'Some text2', fontsize = 10)
plt.show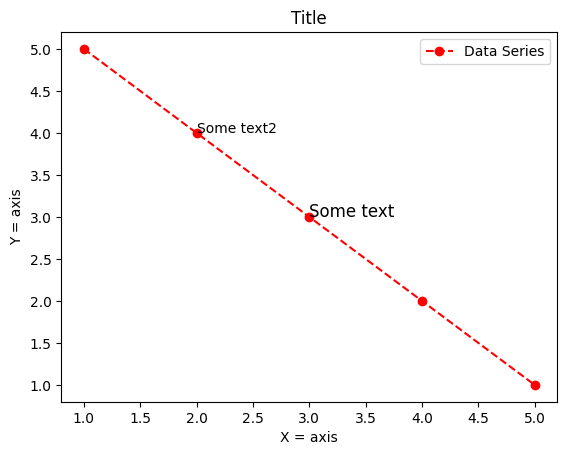
그래프 사이즈 변경
plt.figure(figsize = (8,6))

x = [1,2,3,4,5]
y = [2,4,6,8,10]

plt.plot(x,y)
plt.show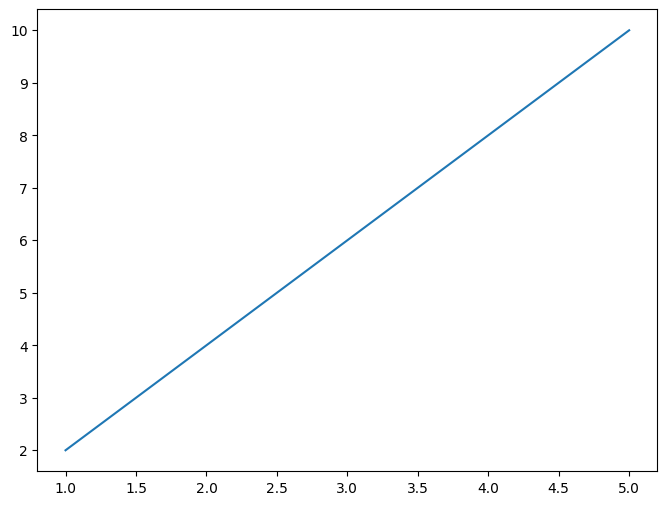
(+) 위에 그린 것은 plt.figure로 해도 변경이 안되는데 어떻게 해야 할까? > subplots 사용
fiog, ax = plt.subplots(figsize = (4,3))
ax = df.plot(x='A', y='B', color='red', linestyle='--', marker='o', ax = ax)
ax.legend(['Data Series'])
ax.set_xlabel('X = axis')
ax.set_ylabel('Y = axis')
ax.set_title('Title')
ax.text(3, 3, 'Some text', fontsize = 12)
ax.text(2, 4, 'Some text2', fontsize = 10)
plt.show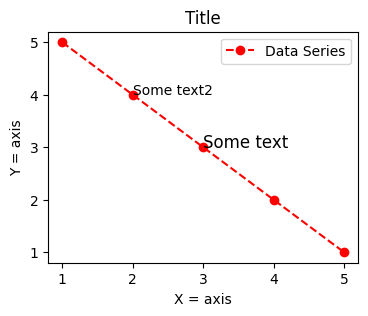
seaborn
import seaborn as sns
# 데이터셋 활용
data = sns.load_dataset('flights')
연도별 승객 수
-
데이터 확인
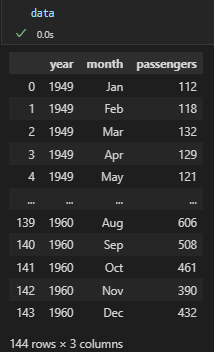
-
groupby
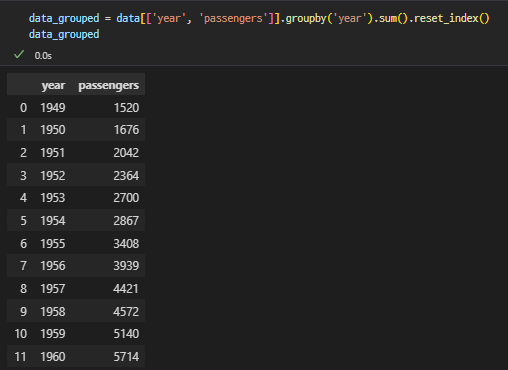
-
선그래프 그리기
plt.plot(data_grouped['year'],data_grouped['passengers'])
plt.xlabel('year')
plt.ylabel('passengers')
plt.show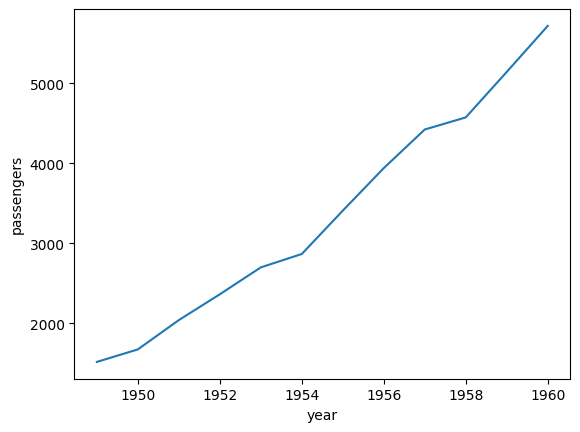
승객수가 우상향한다는 것을 알 수 있음
시간에 따른 변화추세 보기 좋음
바 vs 히스토그램
(+) 한글로 출력하기
pip install koreanize-matplotlib
import koreanize_matplotlib
바그래프
plt.bar(df['도시'],df['인구'])
plt.xlabel('도시')
plt.ylabel('인구')
plt.title('도시별 인구수')
plt.show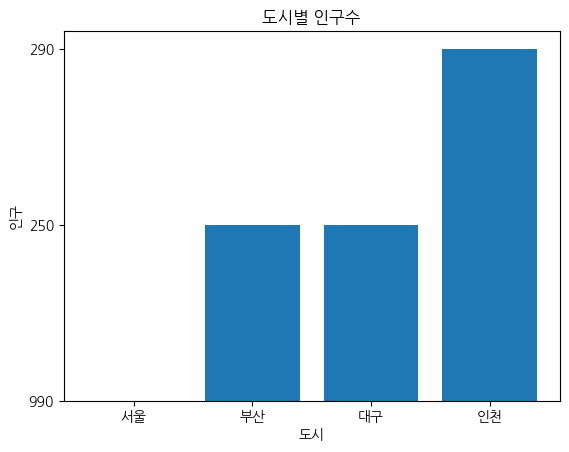
히스토그램
연속형데이터의 분포 확인
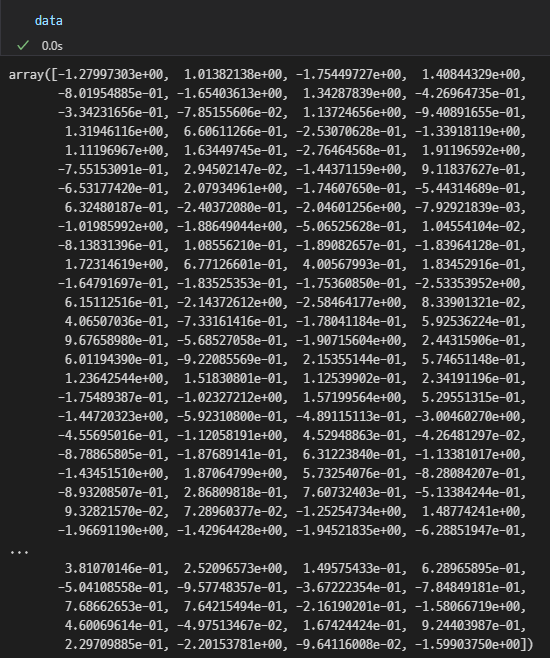
import numpy as np
data = np.random.randn(1000) #넘파이 데이터셋 활용- 데이터 확인
plt.hist(data, bins=30) # 구간별로 여러 데이터가 있을때 몇 개 구간을 둘 건지 설정하는 것
plt.xlabel('value')
plt.ylabel('frequency')
plt.title('Histogram')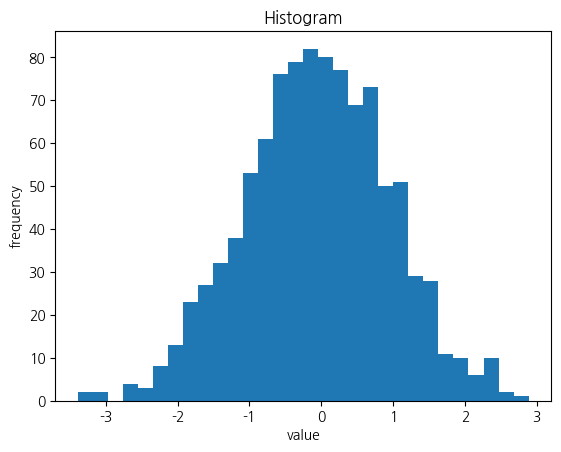
파이차트
sizes = [30,20,25,15,10]
labels = ['A','B','C','D','E']

plt.pie(sizes, labels = labels)
plt.title('Pie Chart')
plt.show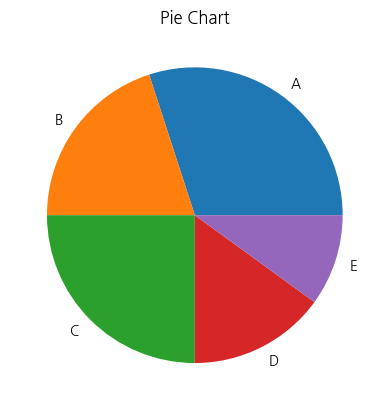
박스플롯
데이터 분포, 이상치를 시각적으로 보여주는 그래프
데이터의 통계적 특성 파악
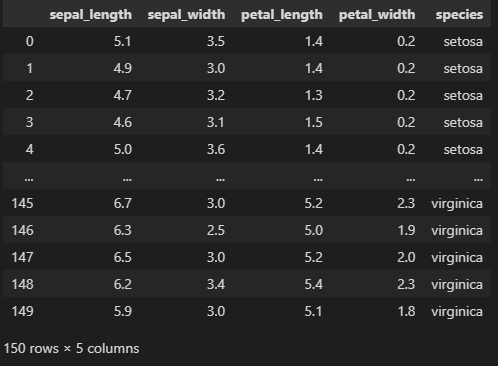
iris = sns.load_dataset('iris') #seaborn 데이터셋 활용
iris-
데이터 확인
-
종별 꽃받침 길이 리스트 만들기
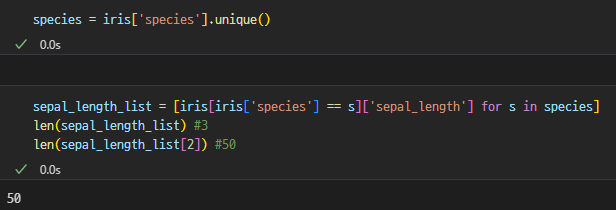
총 3종류, 각 50개의 값이 있다는 것을 알 수 있음
plt.boxplot(sepal_length_list, labels=species)
plt.xlabel('species')
plt.ylabel('sepal length')
plt.title('Box plot')
plt.show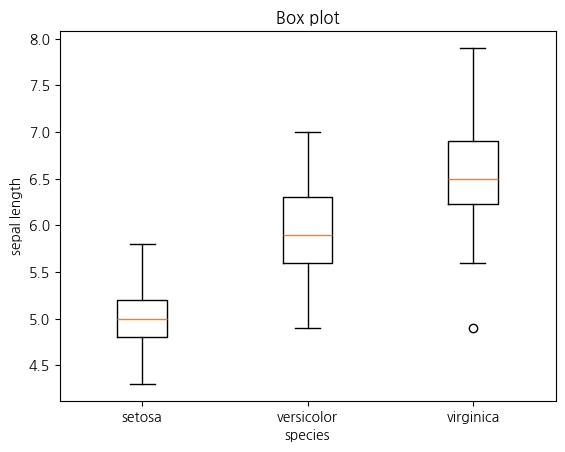
- 가운데에 있는 노란색 선 = 중앙값
- 아래 = 25%, 위 = 75% > 박스 전체는 25~75%
- 길게 뻗어나온 실선 = 최소값, 최대값
- 점 = 이상치
- 보통 이상치 제거 후 분석 시작
seaborn으로 그리기
sns.boxplot(x='species', y='sepal_length', data=iris)
plt.show()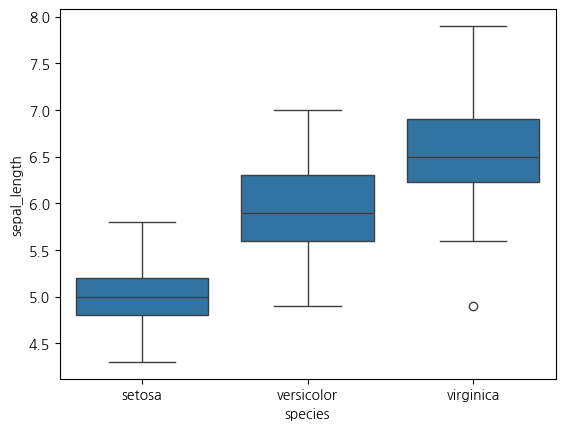
산점도
상관분석, 여러 변수들의 관계성 확인
plt.scatter(iris['petal_length'], iris['petal_width'])
plt.xlabel('Petal Length')
plt.ylabel('Petal Width')
plt.show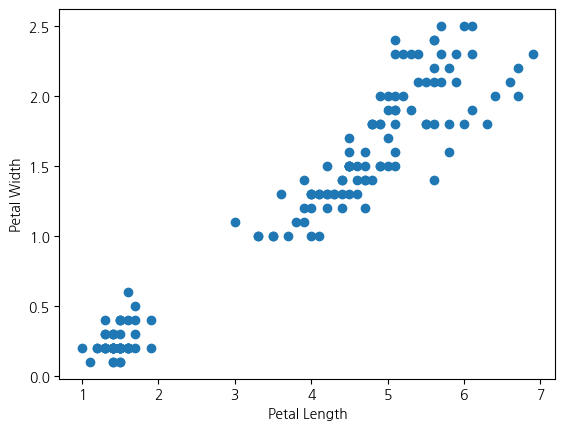
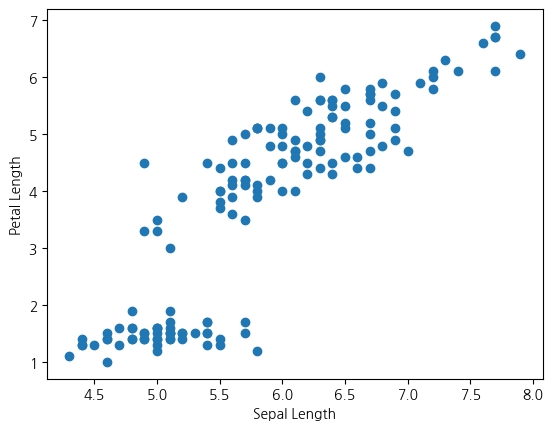
어느 정도 관계성이 있다고 추측할 수 있음
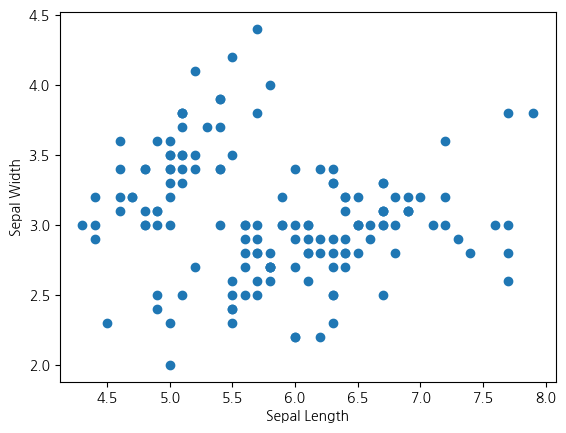
관계성이 없어 보임
수치로 확인하기
iris.corr(numeric_only=True)
# 숫자 형태로만 상관계수 보겠다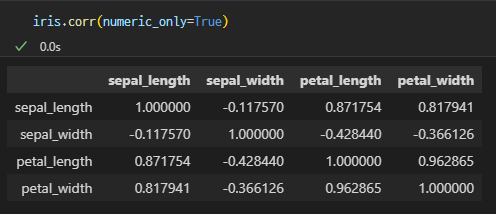
(+) 0.817~로 나타나는 petal_width와 sepal_length 산점도 그려보기
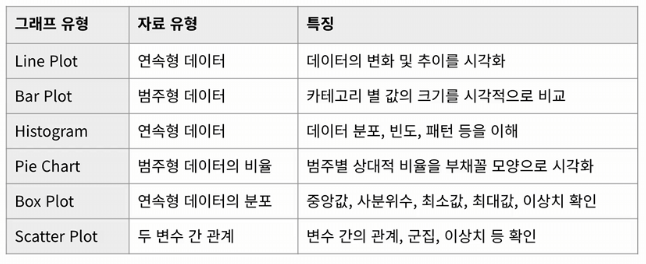
그래프 요약
데일리퀘스트
SQL - 조건에 부합하는 중고거래 상태 조회하기
SQL - 자동차 대여 기록에서 대여중/대여가능 여부 구분하기
Python - 부족한 금액 계산하기
Python - 문자열 다루기 기본
일기
- SQL
코드카타 57,59✅과제해설복기✅ - Python
코드카타 35-36✅과제해설복기✅ - 전처리&시각화
4주차✅
오랜만에 루틴대로 돌아가는 하루 😌 프로젝트가 참 정신이 없긴 없다
오늘은 정들었던 나의 사랑.. 나의 빛.. 어쩌구.. 데잇을 떠나 새 조로 편성되었는데, 내가 조장이 됨 😭 정말 자신이 없지만........분위기 잘 이끌어나갈 수 있을까 걱정이 되지만... ... 기왕 하기로 한 거 열심히 해야지
이제 지각 금지야~!

새로운 주차도 파이티잉🍀🤓