Kaggle에서 해당 데이터를 다운로드 해 MySQL workbench에 import를 했습니다.
https://www.kaggle.com/psparks/instacart-market-basket-analysis
데이터 세트에는 aisles, departments, order_products_prior, orders, products 테이블이 존재. aisles, departments에서는 상품의 카테고리를 의미하고 order_products_prior는 각 주문 번호의 상세 구매 내역, orders는 주문 대표 정보, products는 상품 정보를 포함한다.
이 데이터들을 가지고 어떠한 지표들을 추출할 수 있을까요?
- 전체 주문 수
- 구매자 수
- 상품 별 주문 건수
- 이용자 별 주문 수, 평균 주문 수
- 가장 많이 판매되는 상품 랭킹
- 카트에 첫 번째로 담기는 상품 랭킹
- 시간 별 주문 건수
- 첫 구매 후 다음 구매까지 걸린 평균 일수
- 재주문율이 높은 상품
- Department 별 재구매율이 높은 상품
다음과 같은 지표들을 쿼리로 추출해 보자.
- 전체 주문 수
distinct로 주문 id의 중복을 방지한다.
select count(distinct order_id)
from orders
;- 구매자 수
전체 주문 수와 동일한 방법으로 데이터를 추출한다.
select count(distinct user_id)
from orders
;- 상품 별 주문 건수
-- 상품별 주문 건수

select a.product_name PRODUCT NAME,
count(distinct b.order_id) NUM
from products a
left
join order_products__prior b
on a.product_id = b.product_id
group by 1
products 테이블과 order_products__prior 테이블을 조인
product_name으로 그룹핑,
주문번호(order_id)는 동일 값이 존재할 수 있으므로 distinct로 중복 제거하고 집계
- 이용자 별 주문 수, 평균 주문 수
-- 이용자 별 주문 수

select user_id USERS,
count(distinct order_id) NUM
from orders
group by 1
order by 2 desc
;

-- 이용자 별 평균 주문 수

select avg(NUM)
from
(select user_id USERS,
count(distinct order_id) NUM
from orders
group by 1) base
;- 가장 많이 판매되는 상품 10위
select a.product_name,
count(distinct b.order_id) NUM
from products a
left
join order_products__prior b
on a.product_id = b.product_id
group by 1
order by 2 desc
limit 10
;- 카트에 첫 번째로 담기는 상품 10개
-- case 1

select product_id PRODUCT_ID,
count(add_to_cart_order) F_1st
from
(select product_id,
add_to_cart_order
from order_products__prior
where add_to_cart_order = 1) base
group by 1
order by 2 desc
limit 10
;

-- case 2

select *
from
(select *,
row_number() over(order by F_1st desc) RNK
from
(select product_id,
sum(case when add_to_cart_order = 1 then 1 else 0 end) F_1st
from order_products__prior
group by 1) a) a
where RNK between 1 and 10
;
- 시간 별 주문 건수
-- 시간 별 주문 건수

select order_hour_of_day,
count(distinct order_id) NUM
from orders
group by 1
order by 1
;- 첫 구매 후 다음 구매까지 걸린 평균 일수
-- case 1

select avg(days_since_prior_order) AVG_Order
from orders
where order_number = 2
;

-- case 2

select avg(days_since_prior_order) AVG_Order
from
(select case when order_number = 2 then 1 else 0 end order_num,
days_since_prior_order
from orders) a
where order_num = 1
;- 재주문율이 높은 상품
-- 재주문율이 높은 상품

-- case 1

select *,
row_number() over(order by ratio desc) RNK
from
(select product_id,
reorder/total ratio
from
(select product_id,
count(distinct order_id) total,
sum(reordered) reorder
from order_products__prior
group by 1) a) a
;

-- case 2
select *,
row_number() over(order by ratio desc) RNK
from
(select product_id,
sum(case when reordered = 1 then 1 else 0 end) / count(*) ratio
from order_products__prior
group by 1) a
;- Department 별 재구매율이 높은 상품
-- department 별 재주문율이 높은 상품

select *,
row_number() over(partition by department order by ratio desc) RNK
from
(select department,
product_name,
reorder / total ratio
from
(select a.department,
b.product_name,
count(c.order_id) total,
sum(c.reordered) reorder
from departments a
left
join products b
on a.department_id = b.department_id
left
join order_products__prior c
on b.product_id = c.product_id
group by 1, 2) a) a
;- 주문 건당 평균 구매 상품 수(UPT, Unit Per Transation)
-- 주문 건당 평균 구매 상품 수

-- case 1

select sum(num) / count(order_id) UPT
from
(select order_id,
count(product_id) num
from order_products__prior
group by 1) a
;

-- case 2
select count(product_id) / count(distinct order_id) UPT
from order_products__prior
;
상품 분석
재구매를 많이 하는 상품을 알아보고, 각 상품의 판매 특성에 대해 살펴보자.
먼저 재구매 비중이 높은 상품을 찾아본다. 상품별 재구매 비중(%)과 주문 건수를 계산한다.
select product_id,
sum(reordered) / sum(1) Reorder_rate,
count(distinct order_id) F
from order_products__prior
group by 1
having count(distinct order_id) > 10
;
추가적으로 주문 건수가 10 이하인 상품은 제외하기 위해 having 조건문을 사용했다.
여기에 product_name 컬럼을 추가하기 위해 products 테이블을 조인한다.
select a.product_id,
b.product_name,
sum(a.reordered) / sum(1) Reorder_rate,
count(distinct a.order_id) F
from order_products__prior a
left
join products b
on a.product_id = b.product_id
group by 1, 2
having count(distinct order_id) > 10
;
어떤 상품들이 재구매율이 높은지 파악할 수 있다.
다음 구매까지의 소요 기간과 재구매 관계
재구매와 관가 있는 변수는 무엇이 있을까? 커머스 사이트에서 자주 재구매하는 상품에는 어떤 종류가 있을까? 가장 대표적으로 생수, 세제, 휴지와 같은 생활 필수품이 있을 것이다. 만약 가정에 아이가 있다면 기저귀 같은 상품도 일정한 주기로 구매할 것이다.
'고객이 자주 재구매하는 상품은 그렇지 않은 상품보다 일정한 주기를 가질 것이다'라는 가정을 세우고 수치를 살펴보자. 재구매율이 높은 순서대로 상품을 10가지 그룹으로 구분하고, 각 그룹에서의 구매 소요 기간의 분산을 구해 보자.
분산은 그 확률 변수가 기댓값에서 얼마나 떨어진 곳에 분포하는지를 나타내는 값이다. 즉 분산이 낮을수록 데이터가 평균에 모이게 되고, 분산이 클수록 관측치는 평균에서 멀리 분포한다.
먼저 상품별 재구매율을 계산하고, 가장 높은 순서대로 순위를 매긴다.
select *,
row_number() over(order by reorder_rate desc) RNK
from
(select product_id,
sum(reordered) / sum(1) Reorder_rate
from order_products__prior
group by 1) a
;
각 상품을 10개의 그룹으로 나눈다.
-- 임시 테이블을 만들어 10개의 그룹으로 나누는 쿼리.

create temporary table instacart.product_repurchase_quantile as
select a.product_id,
case when RNK <= 929 then 'Q_1'
when RNK <= 1858 then 'Q_2'
when RNK <= 2786 then 'Q_3'
when RNK <= 3715 then 'Q_4'
when RNK <= 4644 then 'Q_5'
when RNK <= 5573 then 'Q_6'
when RNK <= 6502 then 'Q_7'
when RNK <= 7430 then 'Q_8'
when RNK <= 8359 then 'Q_9'
when RNK <= 9288 then 'Q_10' end RNK_GRP
from
(select *,
row_number() over(order by reorder_rate desc) RNK
from
(select product_id,
sum(reordered) / sum(1) Reorder_rate
from order_products__prior
group by 1) a) a
group by 1, 2
;
-- product_repurchase_quntile 테이블 조회
select * from product_repurchase_quantile
;이제 각 분위 수 별로 재구매 소요 시간의 분산을 구해 본다.
각 분위 수별 재구매 소요 기간의 분산을 구하려면 다음과 같은 정보를 결합해 구해야 한다.
-
상품별 분위 수: product_repurchase_quantile
-
주문 소요 시간: orders
-
주문 번호와 상품 번호: order_products__prior
먼저 order_products__prior에 orders 테이블을 결합해 product_id의 DAYS_SINCE_PRIOR_ORDER를 구한다.
select a.product_id,
b.days_since_prior_order
from order_products__prior a
left
join orders b
on a.order_id = b.order_id
;
여기에 분위수, 상품별 구매 소요 기간의 분산을 계산한다.
select a.product_id,
variance(b.days_since_prior_order) VAR_DAYS,
c.RNK_GRP
from order_products_prior a
left
join orders b
on a.order_id = b.order_id
left
join product_repurchase__quantile c
on a.product_id = c.product_id
group by 1, 3
order by 3
;
각 분위 수, 상품의 구매 소요 기간의 분산을 계산할 수 있다. 우리의 가정은 다음과 같았다.
'재구매율이 높은 상품군은 구매 주기가 일정할 것이다.'
이를 확인하기 위해 재구매율에 따라 상품을 10가지 그룹으로 분할했고, 각 분위 수의 상품별 구매 소요 기간의 분산을 계산했다.
이제 각 분위 수의 상품 소요 기간 분산의 중위 수를 계산한다. 계산한 결과를 보고 분위 수별 구매 소요 기간에 차이가 존재하는지 확인할 수 있다.
Median() 함수를 제공하지 않으므로 avg() 함수를 이용해 평균으로 대체한다.
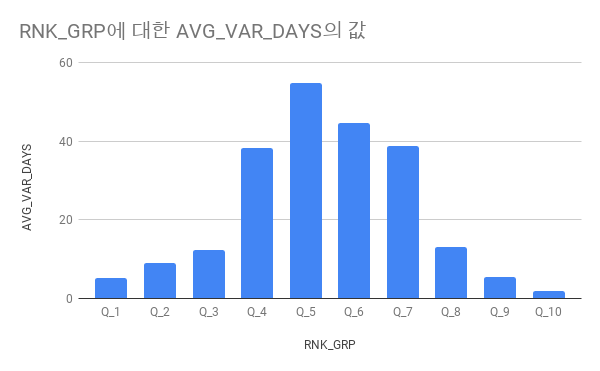
select RNK_GRP,
avg(var_days) AVG_VAR_DAYS
from
(select a.product_id,
variance(b.days_since_prior_order) VAR_DAYS,
c.RNK_GRP
from order_products_prior a
left
join orders b
on a.order_id = b.order_id
left
join product_repurchase__quantile c
on a.product_id = c.product_id
group by 1, 3
order by 3) a
group by 1
order by 1
;
결과를 보면 분위 수에 따라 재구매 주기의 분산에 차이가 있다. 가운데가 볼록한 정규분포표 모양을 띄고 있다.