오답노트. Introduction to Pandas (2877~2891)
Python Basic
2877. Create a DataFrame from List
Write a solution to create a DataFrame from a 2D list called student_data. This 2D list contains the IDs and ages of some students.
The DataFrame should have two columns, student_id and age, and be in the same order as the original 2D list.
The result format is in the following example.
student_data:
[
[1, 15],
[2, 11],
[3, 11],
[4, 20]
]
정답은,
import pandas as pd
def createDataframe(student_data: List[List[int]] ->pd.DataFrame:
	df= pd.DataFrame(student_data, columns=['student_id', 'age'])
    return df
2878. Get the Size of a DataFrame
DataFrame players:
| Column Name | Type |
|---|---|
| player_id | int |
| name | object |
| age | int |
| position | object |
| ... | ... |
Write a solution to calculate and display the number of rows and columns of players.
Return the result as an array:
[number of rows, number of columns]
The result format is in the following example.
정답은,
import pandas as pd
def getDataframeSize(players: pd.DataFrame) -> List[int]:
	return [players.shape[0], players.shape[1]]
2880. Select Data
DataFrame students
| Column Name | Type |
|---|---|
| student_id | int |
| name | object |
| age | int |
Write a solution to select the name and age of the student with student_id = 101.
The result format is in the following example.
정답은
import pandas as pd
def selectData(students: pd.DataFrame) -> pd.DataFrame:
	students[students['student_id'==101]][['name','age']]
2882. Drop Duplicate Rows
DataFrame customers
| Column Name | Type |
|---|---|
| customer_id | int |
| name | object |
| object |
There are some duplicate rows in the DataFrame based on the email column.
Write a solution to remove these duplicate rows and keep only the first occurrence.
The result format is in the following example.
Example 1:
Input:
| customer_id | name | |
|---|---|---|
| 1 | Ella | emily@example.com |
| 2 | David | michael@example.com |
| 3 | Zachary | sarah@example.com |
| 4 | Alice | john@example.com |
| 5 | Finn | john@example.com |
| 6 | Violet | alice@example.com |
Output:
| customer_id | name | |
|---|---|---|
| 1 | Ella | emily@example.com |
| 2 | David | michael@example.com |
| 3 | Zachary | sarah@example.com |
| 4 | Alice | john@example.com |
| 6 | Violet | alice@example.com |
Explanation:
Alic (customer_id = 4) and Finn (customer_id = 5) both use john@example.com, so only the first occurrence of this email is retained.
정답은,
import pandas as pd
def dropDuplicateEmails(customers: pd.DataFrame) -> pd.DataFrame:
	df=pd.Dataframe(customers)
    df.drop_duplicates(subset='email', keep='first', inplace=True)
    return df
2883. Drop Missing Data
DataFrame students
| Column Name | Type |
|---|---|
| student_id | int |
| name | object |
| age | int |
There are some rows having missing values in the name column.
Write a solution to remove the rows with missing values.
The result format is in the following example.
Example 1:
Input:
| student_id | name | age |
|---|---|---|
| 32 | Piper | 5 |
| 217 | None | 19 |
| 779 | Georgia | 20 |
| 849 | Willow | 14 |
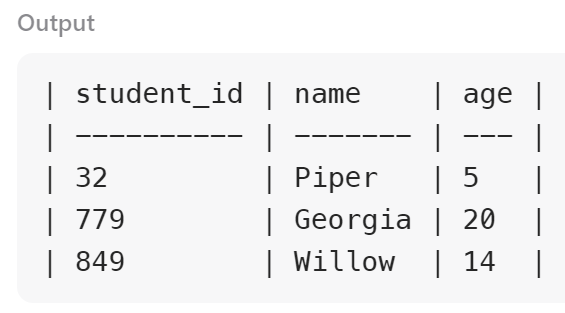
Output:
| student_id | name | age |
|---|---|---|
| 32 | Piper | 5 |
| 779 | Georgia | 20 |
| 849 | Willow | 14 |
Explanation:
Student with id 217 havs empty value in the name column, so it will be removed.
정답은,
import pandas as pd
def dropMissingData(students: pd.DataFrame) -> pd.DataFrame:
    df=pd.DataFrame(students)
    df.dropna(subset=['name'], inplace=True)
    return df
2885. Rename Columns
DataFrame students
| Column Name | Type |
|---|---|
| id | int |
| first | object |
| last | object |
| age | int |
Write a solution to rename the columns as follows:
id to student_id
first to first_name
last to last_name
age to age_in_years
The result format is in the following example.
Example 1:
Input:
| id | first | last | age |
|---|---|---|---|
| 1 | Mason | King | 6 |
| 2 | Ava | Wright | 7 |
| 3 | Taylor | Hall | 16 |
| 4 | Georgia | Thompson | 18 |
| 5 | Thomas | Moore | 10 |
Output:
| student_id | first_name | last_name | age_in_years |
|---|---|---|---|
| 1 | Mason | King | 6 |
| 2 | Ava | Wright | 7 |
| 3 | Taylor | Hall | 16 |
| 4 | Georgia | Thompson | 18 |
| 5 | Thomas | Moore | 10 |
Explanation:
The column names are changed accordingly.
정답은,
import pandas as pd
def renameColumns(students: pd.DataFrame) -> pd.DataFrame:
    df = pd.DataFrame(students)
    df.rename(columns={'id':'student_id', 'first':'first_name', 'last':'last_name', 'age':'age_in_years'}, inplace=True)
    return df
2886. Change Data Type
DataFrame students
| Column Name | Type |
|---|---|
| student_id | int |
| name | object |
| age | int |
| grade | float |
Write a solution to correct the errors:
The grade column is stored as floats, convert it to integers.
The result format is in the following example.
Example 1:
Input:
DataFrame students:
| student_id | name | age | grade |
|---|---|---|---|
| 1 | Ava | 6 | 73.0 |
| 2 | Kate | 15 | 87.0 |
Output:
| student_id | name | age | grade |
|---|---|---|---|
| 1 | Ava | 6 | 73 |
| 2 | Kate | 15 | 87 |
Explanation:
The data types of the column grade is converted to int.
정답은,
import pandas as pd
def changeDatatype(students: pd.DataFrame) -> pd.DataFrame:
    students['grade']=students['grade'].astype(int)
    return students
2887. Fill Missing Data
DataFrame products
| Column Name | Type |
|---|---|
| name | object |
| quantity | int |
| price | int |
Write a solution to fill in the missing value as 0 in the quantity column.
The result format is in the following example.
Example 1:
Input:
| name | quantity | price |
|---|---|---|
| Wristwatch | None | 135 |
| WirelessEarbuds | None | 821 |
| GolfClubs | 779 | 9319 |
| Printer | 849 | 3051 |
Output:
| name | quantity | price |
|---|---|---|
| Wristwatch | 0 | 135 |
| WirelessEarbuds | 0 | 821 |
| GolfClubs | 779 | 9319 |
| Printer | 849 | 3051 |
Explanation:
The quantity for Wristwatch and WirelessEarbuds are filled by 0.
정답은,
import pandas as pd
def fillMissingValues(products: pd.DataFrame) -> pd.DataFrame:
    products['quantity'].fillna(0, inplace=True)
    return products
2889. Reshape Data: Pivot
DataFrame weather
| Column Name | Type |
|---|---|
| city | object |
| month | object |
| temperature | int |
Write a solution to pivot the data so that each row represents temperatures for a specific month, and each city is a separate column.
The result format is in the following example.
Example 1:
Input:
| city | month | temperature |
|---|---|---|
| Jacksonville | January | 13 |
| Jacksonville | February | 23 |
| Jacksonville | March | 38 |
| Jacksonville | April | 5 |
| Jacksonville | May | 34 |
| ElPaso | January | 20 |
| ElPaso | February | 6 |
| ElPaso | March | 26 |
| ElPaso | April | 2 |
| ElPaso | May | 43 |
Output:
| month | ElPaso | Jacksonville |
|---|---|---|
| April | 2 | 5 |
| February | 6 | 23 |
| January | 20 | 13 |
| March | 26 | 38 |
| May | 43 | 34 |
Explanation:
The table is pivoted, each column represents a city, and each row represents a specific month.
정답은,
import pandas as pd
def pivotTable(weather: pd.DataFrame) -> pd.DataFrame:
    return weather.pivot(index='month', columns='city', values='temperature')
2890. Reshape Data: Melt
DataFrame report
| Column Name | Type |
|---|---|
| product | object |
| quarter_1 | int |
| quarter_2 | int |
| quarter_3 | int |
| quarter_4 | int |
Write a solution to reshape the data so that each row represents sales data for a product in a specific quarter.
The result format is in the following example.
Example 1:
Input:
| product | quarter_1 | quarter_2 | quarter_3 | quarter_4 |
|---|---|---|---|---|
| Umbrella | 417 | 224 | 379 | 611 |
| SleepingBag | 800 | 936 | 93 | 875 |
Output:
| product | quarter | sales |
|---|---|---|
| Umbrella | quarter_1 | 417 |
| SleepingBag | quarter_1 | 800 |
| Umbrella | quarter_2 | 224 |
| SleepingBag | quarter_2 | 936 |
| Umbrella | quarter_3 | 379 |
| SleepingBag | quarter_3 | 93 |
| Umbrella | quarter_4 | 611 |
| SleepingBag | quarter_4 | 875 |
Explanation:
The DataFrame is reshaped from wide to long format. Each row represents the sales of a product in a quarter.
정답은,
import pandas as pd
def meltTable(report: pd.DataFrame) -> pd.DataFrame:
    return pd.melt(report, id_vars=['product'], var_name='quarter', value_name='sales')
2891. Method Chaining
DataFrame animals
| Column Name | Type |
|---|---|
| name | object |
| species | object |
| age | int |
| weight | int |
Write a solution to list the names of animals that weigh strictly more than 100 kilograms.
Return the animals sorted by weight in descending order.
The result format is in the following example.
Example 1:
Input:
DataFrame animals:
| name | species | age | weight |
|---|---|---|---|
| Tatiana | Snake | 98 | 464 |
| Khaled | Giraffe | 50 | 41 |
| Alex | Leopard | 6 | 328 |
| Jonathan | Monkey | 45 | 463 |
| Stefan | Bear | 100 | 50 |
| Tommy | Panda | 26 | 349 |
Output:
| name |
|---|
| Tatiana |
| Jonathan |
| Tommy |
| Alex |
Explanation:
All animals weighing more than 100 should be included in the results table.
Tatiana's weight is 464, Jonathan's weight is 463, Tommy's weight is 349, and Alex's weight is 328.
The results should be sorted in descending order of weight.
In Pandas, method chaining enables us to perform operations on a DataFrame without breaking up each operation into a separate line or creating multiple temporary variables.
Can you complete this task in just one line of code using method chaining?
정답은,
import pandas as pd
def findHeavyAnimals(animals: pd.DataFrame) -> pd.DataFrame:
    return animals[animals['weight']>100].sort_values('weight', ascending=False)[['name']]