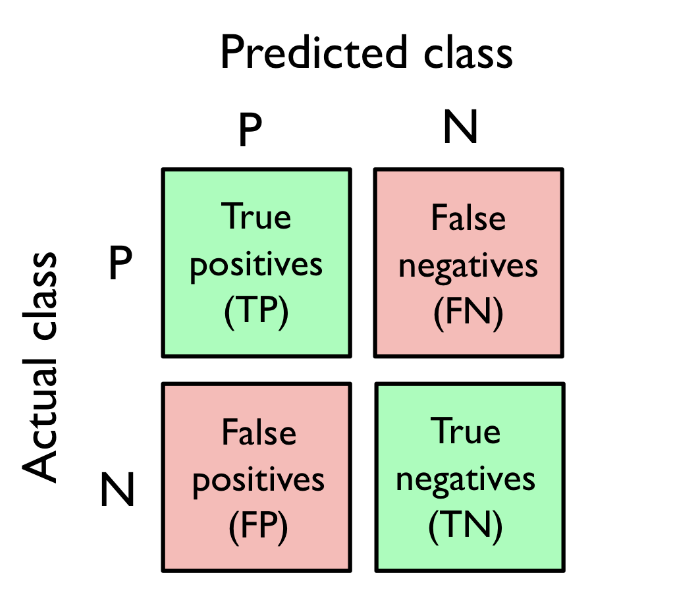
confusion matrix (오차 행렬)
- True Positive, True Negative, False Positive, False Negative 별 갯수를 적은 행렬
confusion_matrix함수를 통한 예제
from sklearn.metrics import confusion_matrix

pipe_svc.fit(X_train, y_train)
y_pred = pipe_svc.predict(X_test)
confmat = confusion_matrix(y_true=y_test, y_pred=y_pred)
print(confmat)
[[71 1]
[ 2 40]]ERR, ACC
-
ECC (예측 오차) : 전체 중 잘못 분류된 비율
-
ACC (정확도): 전체 중 올바르게 분류된 비율
TPR, FPR, PRE, REC
-
TPR(True Positive Rate) : 진짜 양성 비율
- REC (재현율),
recall이라고도 표현 - positive 중 올바르게 분류한 비율
- REC (재현율),
-
FPR (False Positive Rate) : 거짓 양성 비율
- negative 중 positive 라고 잘못 분류한 비율
-
PRE (정확도. 정밀도)
precision- positive 로 판별한 항목 중 진짜 positive 비율
F1-score
- PRE 와 REC 를 조합한 점수
- scikit-learn 의 metrics 를 통해 사용
from sklearn.metrics import precision_score, recall_score, f1_score

print('재현율(TRP=REC): %.3f' % recall_score(y_true=y_test, y_pred=y_pred))
print('정밀도(PRE): %.3f' % precision_score(y_true=y_test, y_pred=y_pred))
print('F1: %.3f' % f1_score(y_true=y_test, y_pred=y_pred))
ROC (Receiver Operating Characteristic)
- 분류기 임계값을 바꾸어가면 FPR, TPR 점수 계산
- ROC 곡선의 아래 면적 ROC AUC(ROC Area Under the Curve) 를 계산해 분류 모델의 성능을 계산
roc_curve,roc_auc_score함수로 ROC, ROC AUC 계산
reference
- 서적 '머신러닝 교과서 with 파이썬, 사이킷런, 텐서플로 개정 3판'
