
DataFrame
: 큰 데이터들을 처리하기 위해 사용. 데이터들을 테이블형태로 표현해주고, SQL 문을 통해 데이터를 관리할 수 있다.
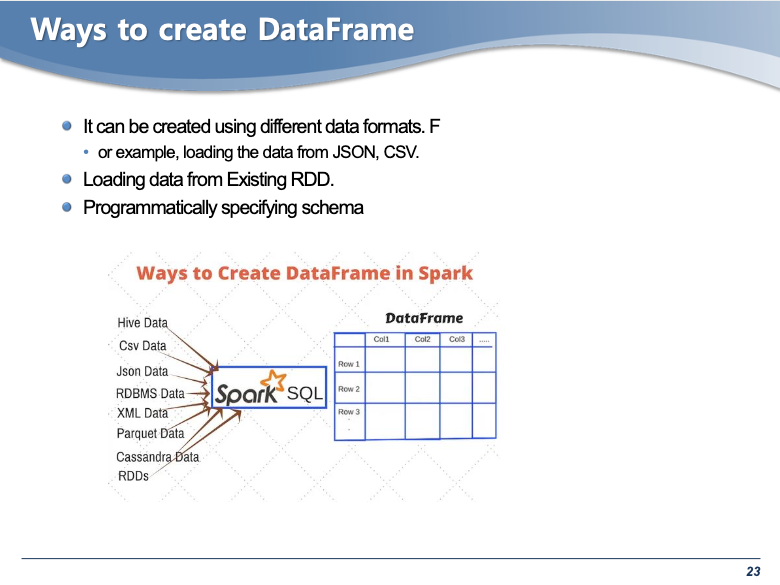
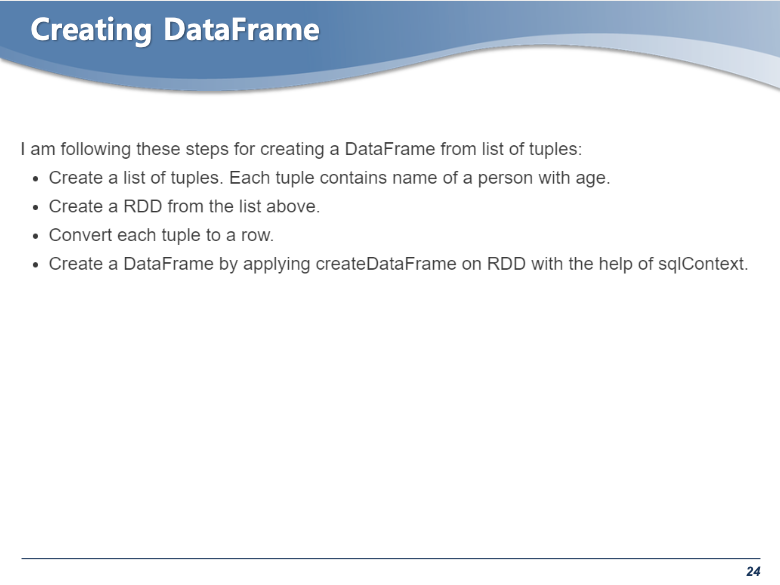
- 여러가지 방법으로 DataFrame을 만들 수 있다. 여기서는 RDD 를 이용해서 데이터프레임을 만드는 것을 설명
from pyspark.sql import Rowl = [('Ankit', 25),('Jalfaizy',22),('saurabh',20),('Bala',26)]
rdd = sc.parallelize(l)
people = rdd.map(lambda x : Row(name=x[0], age=int(x[1])))
schemaPeople = sqlContext.createDataFrame(people)# 만들어진 데이터 프레임을 확인할 수 있음
print(type(schemaPeople))
schemaPeople.printSchema()
print(schemaPeople.collect())
print(schemaPeople.count())<class 'pyspark.sql.dataframe.DataFrame'>
root
|-- age: long (nullable = true)
|-- name: string (nullable = true)
[Row(age=25, name='Ankit'), Row(age=22, name='Jalfaizy'), Row(age=20, name='saurabh'), Row(age=26, name='Bala')]
4# 파일로부터 데이터프레임을 만드는 방법
# Parquet 파일 또는 Json 파일로 부터 데이터프레임을 주로 생성한다.
peopleDF = spark.read.parquet("./people-10m.parquet")# 데이터프레임은 스키마를 가지고 있어서 아래 명령어로 확인할 수 있음
peopleDF.printSchema()root
|-- id: integer (nullable = true)
|-- firstName: string (nullable = true)
|-- middleName: string (nullable = true)
|-- lastName: string (nullable = true)
|-- gender: string (nullable = true)
|-- birthDate: timestamp (nullable = true)
|-- ssn: string (nullable = true)
|-- salary: integer (nullable = true)# 테이블형태로 확인할 수 있음
# head 명령어를 사용하게 되면 row 데이터 스트럭쳐로 보여줘 보기 힘듬
peopleDF.show(5)
peopleDF.head(5)+---+---------+----------+----------+------+-------------------+-----------+------+
| id|firstName|middleName| lastName|gender| birthDate| ssn|salary|
+---+---------+----------+----------+------+-------------------+-----------+------+
| 1| Pennie| Carry|Hirschmann| F|1955-07-02 13:30:00|981-43-9345| 56172|
| 2| An| Amira| Cowper| F|1992-02-08 14:00:00|978-97-8086| 40203|
| 3| Quyen| Marlen| Dome| F|1970-10-11 13:00:00|957-57-8246| 53417|
| 4| Coralie| Antonina| Marshal| F|1990-04-11 13:00:00|963-39-4885| 94727|
| 5| Terrie| Wava| Bonar| F|1980-01-16 14:00:00|964-49-8051| 79908|
+---+---------+----------+----------+------+-------------------+-----------+------+
only showing top 5 rows
[Row(id=1, firstName='Pennie', middleName='Carry', lastName='Hirschmann', gender='F', birthDate=datetime.datetime(1955, 7, 2, 13, 30), ssn='981-43-9345', salary=56172),
Row(id=2, firstName='An', middleName='Amira', lastName='Cowper', gender='F', birthDate=datetime.datetime(1992, 2, 8, 14, 0), ssn='978-97-8086', salary=40203),
Row(id=3, firstName='Quyen', middleName='Marlen', lastName='Dome', gender='F', birthDate=datetime.datetime(1970, 10, 11, 13, 0), ssn='957-57-8246', salary=53417),
Row(id=4, firstName='Coralie', middleName='Antonina', lastName='Marshal', gender='F', birthDate=datetime.datetime(1990, 4, 11, 13, 0), ssn='963-39-4885', salary=94727),
Row(id=5, firstName='Terrie', middleName='Wava', lastName='Bonar', gender='F', birthDate=datetime.datetime(1980, 1, 16, 14, 0), ssn='964-49-8051', salary=79908)]print(peopleDF.count()) # 인스턴스의 개수를 알려준다.
print(peopleDF.columns) # 컬럼만을 보여준다.
print(peopleDF.describe().show(5)) # show(5)와 같은 결과10000000
['id', 'firstName', 'middleName', 'lastName', 'gender', 'birthDate', 'ssn', 'salary']#select 문을 통해 데이터를 확인할 수 있음
peopleDF.select('firstName', 'birthDate').show(5)+---------+-------------------+
|firstName| birthDate|
+---------+-------------------+
| Pennie|1955-07-02 13:30:00|
| An|1992-02-08 14:00:00|
| Quyen|1970-10-11 13:00:00|
| Coralie|1990-04-11 13:00:00|
| Terrie|1980-01-16 14:00:00|
+---------+-------------------+
only showing top 5 rowspeopleDF.select('gender').distinct().count()2# filter 는 여러가지 형태로 사용가능
peopleDF.filter(peopleDF['gender']=="F").count()
peopleDF.filter(peopleDF.gender == 'F').count()
peopleDF.filter("gender == 'F'").count()# filter 안에 펑션을 넣을 수도 있음
from pyspark.sql.functions import year
peopleDF.filter(year("birthDate") > "1995").count()849353# and 를 사용하여 조건을 추가할 수도 있음
test1 = peopleDF.select("firstName").filter("gender = 'M'" and year("birthDate")>"1960")
test1.show(5)+---------+
|firstName|
+---------+
| An|
| Quyen|
| Coralie|
| Terrie|
| Chassidy|
+---------+
only showing top 5 rows# select 문을 사용한 결과에 filter 펑션을 적용하는 것도 가능.
peopleDF.select("firstName", year("birthDate")).filter("gender='M'" and year("birthDate")>"1960").show(10)+---------+---------------+
|firstName|year(birthDate)|
+---------+---------------+
| An| 1992|
| Quyen| 1970|
| Coralie| 1990|
| Terrie| 1980|
| Chassidy| 1990|
| Geri| 1970|
| Patria| 1985|
| Terese| 1967|
| Wava| 1963|
| Sophie| 1979|
+---------+---------------+
only showing top 10 rows#GroupBy를 이용해서 특정 컬럼을 그룹핑 할 수 있음
peopleDF.groupBy("gender").count().show()+------+-------+
|gender| count|
+------+-------+
| F|5187302|
| M|4812698|
+------+-------+# firstName을 알파벳순으로 정렬한 후 groupBy
peopleDF.orderBy('firstName').groupBy("firstName").count().show(5)+---------+-----+
|firstName|count|
+---------+-----+
| Aaron| 4020|
| Abbey| 1273|
| Abbie| 1288|
| Abby| 1235|
| Abdul| 3966|
+---------+-----+
only showing top 5 rows# firstName으로 그룹핑 한 후에, 가장 많이 나온 순으로 정렬해서 볼 수 있다.
peopleDF.groupBy("FirstName").count().orderBy("count", ascending=False).show(5)+---------+-----+
|FirstName|count|
+---------+-----+
| Sammie| 5462|
| Daryl| 5442|
| Bobbie| 5432|
| Lee| 5411|
| Troy| 5408|
+---------+-----+
only showing top 5 rows# count() 을 사용하면 count 이름의 column이 생기게 된다.
# 특정 수치 이상의 count를 가진 값을 출력하는 명령어
# column에 접근하기 위해서 col을 import.
from pyspark.sql.functions import col
peopleDF.groupBy("firstName").count().filter(col("count") > "5430")\
.orderBy("count", ascending=False).show(6)+---------+-----+
|firstName|count|
+---------+-----+
| Sammie| 5462|
| Daryl| 5442|
| Bobbie| 5432|
+---------+-----+# Multiline command는 \을 이용해서 가능
peopleDF\
.select("firstname", "lastName")\
.filter("gender = 'M'")\
.show(5)+---------+--------+
|firstname|lastName|
+---------+--------+
| Jasper|Neubigin|
| Robert| Kipling|
| Abdul| Pachta|
| Earle|Gieraths|
| Mickey| Wotton|
+---------+--------+
only showing top 5 rowstestDF1 = peopleDF\
.select("firstname", "lastName", "birthDate")\
.filter("gender = 'M'")
testDF1.show(5)+---------+--------+-------------------+
|firstname|lastName| birthDate|
+---------+--------+-------------------+
| Jasper|Neubigin|1961-02-20 13:30:00|
| Robert| Kipling|1986-01-02 14:00:00|
| Abdul| Pachta|1956-01-28 13:30:00|
| Earle|Gieraths|1958-04-17 13:30:00|
| Mickey| Wotton|1976-08-29 13:00:00|
+---------+--------+-------------------+
only showing top 5 rows# display를 사용하면 이차워 그래프와 같은 visualization 이 가능
# (jupyter notebook에서는 안되는 것 같음)
from pyspark.sql.functions import year
testDF2 = testDF1.\
filter(year("birthDate")>"1990")
testDF2.show(5)+---------+---------+-------------------+
|firstname| lastName| birthDate|
+---------+---------+-------------------+
| Theron| Aplin|1995-03-16 14:00:00|
| Valentin| Yakunin|1999-04-06 13:00:00|
| Emmett| Grgic|1991-04-22 13:00:00|
| Nelson| Kelf|1995-08-17 13:00:00|
| Sonny|Kornousek|1994-11-04 14:00:00|
+---------+---------+-------------------+
only showing top 5 rowsdisplay(testDF2)DataFrame[firstname: string, lastName: string, birthDate: timestamp]
from pyspark.sql.functions import year
display(
    peopleDF
        .select("firstName", "middleName", "lastName", "birthDate", "gender")
        .filter("gender = 'F'")
        .filter(year("birthDate") > "1990")
)
DataFrame[firstName: string, middleName: string, lastName: string, birthDate: timestamp, gender: string]marysDF = peopleDF\
.select(year("birthDate").alias('birthYear'))\
.filter("firstName = 'Mary'")\
.filter("gender = 'F'")\
.orderBy('birthYear')\
.groupBy('birthYear')\
.count()display(marysDF)DataFrame[birthYear: int, count: bigint]from pyspark.sql.functions import col
dordonDF = peopleDF\
.select(year("birthDate").alias("birthYear"), "firstName")\
.filter((col("firstName") == 'Donna') | (col("firstName") == 'Dorothy'))\
.orderBy('birthYear')\
.groupBy('birthYear', 'firstName')\
.count()\
.show(5)+---------+---------+-----+
|birthYear|firstName|count|
+---------+---------+-----+
| 1952| Donna| 24|
| 1952| Dorothy| 21|
| 1953| Donna| 37|
| 1953| Dorothy| 38|
| 1954| Dorothy| 29|
+---------+---------+-----+
only showing top 5 rowsTemporary Views
- 데이터프레임을 만든 후, sql를 사용할 수 있도록 만들어 주는 형식.
- spark session이 끝나고나면 없어진다.

'당신을 한 줄로 소개해보세요'를 이 블로그로 대신 해볼까합니다.