📌 흑백 이미지 분류
📍 샘플 확인
- 2차원 images -> 넘파이 배열로 다운로드
!wget https://bit.ly/fruits_300_data -O fruits_300.npy

import numpy as np
import matplotlib.pyplot as plt

fruits = np.load('fruits_300.npy')
print(fruits.shape)
(300, 100, 100) // samples x 가로 x 세로
- 한 열을 출력 (맨 위 이미지의 맨 윗부분)
print(fruits[0,0,:])[ 1 1 1 1 1 1 1 1 1 1 1 1 1 1 1 1 2 1
2 2 2 2 2 2 1 1 1 1 1 1 1 1 2 3 2 1
2 1 1 1 1 2 1 3 2 1 3 1 4 1 2 5 5 5
19 148 192 117 28 1 1 2 1 4 1 1 3 1 1 1 1 1
2 2 1 1 1 1 1 1 1 1 1 1 1 1 1 1 1 1
1 1 1 1 1 1 1 1 1 1]
-> 높은 값 = 밝은 색
- 이미지 하나를 출력 (흑백)
plt.imshow(fruits[0], cmap='gray')
plt.show()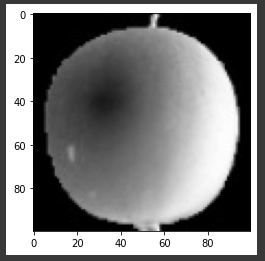
plt.imshow(fruits[0], cmap='gray_r') # 색상 반전
plt.show()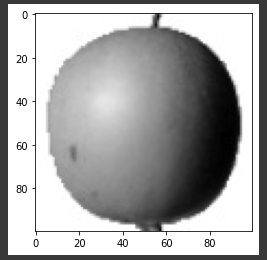
📍 샘플 차원 변경
- fruits = 0~99 사과, 100~199 파인애플, 200~299 바나나
-> 각 과일에 대해 가로x세로를 1열로
apple = fruits[0:100].reshape(-1, 100*100)
pineapple = fruits[100:200].reshape(-1, 100*100)
banana = fruits[200:300].reshape(-1, 100*100)

print(apple.shape)
(100, 10000)
- 각 과일 이미지 100개
-> 이미지 하나당 10000개 픽셀의 평균
plt.hist(np.mean(apple, axis=1), alpha=0.8)
plt.hist(np.mean(pineapple, axis=1), alpha=0.8)
plt.hist(np.mean(banana, axis=1), alpha=0.8)
plt.legend(['apple', 'pineapple', 'banana'])
plt.show()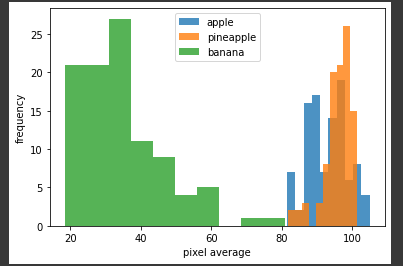
-> 픽셀값으로 사진 구분 불가
📍 평균 이미지 그리기
- 과일별 100개 이미지의 평균 이미지
- 1열로 바꾼 배열을 다시 100x100으로
- subplots(행,열) : 부분 그래프 여러개로 하나의 이미지
- axs로 3개의 이미지를 참조해서 imshow()
apple_mean = np.mean(apple, axis=0).reshape(100,100)
pineapple_mean = np.mean(pineapple, axis=0).reshape(100,100)
banana_mean = np.mean(banana, axis=0).reshape(100,100)

fig, axs = plt.subplots(1, 3, figsize=(20, 5))
axs[0].imshow(apple_mean, cmap='gray_r')
axs[1].imshow(pineapple_mean, cmap='gray_r')
axs[2].imshow(banana_mean, cmap='gray_r')
plt.show()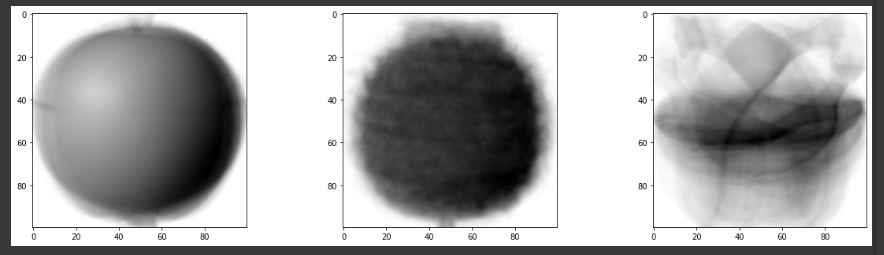
-> 평균 이미지와 새로운 이미지를 비교해 분류 가능
📍 평균과 가까운 사진 고르기
- abs_diff : 차이의 크기 배열 (300x100x100)
-> |300개 과일 이미지 배열 - 사과 평균 이미지| - abs_mean : 샘플마다 차이의 평균
-> abs_diff의 두번째, 세번째 차원에 대해
abs_diff = np.abs(fruits - apple_mean)
abs_mean = np.mean(abs_diff, axis=(1,2))
print(abs_mean.shape)
(300,)
-> 이미지 샘플마다 기준 이미지와의 픽셀 차이 평균
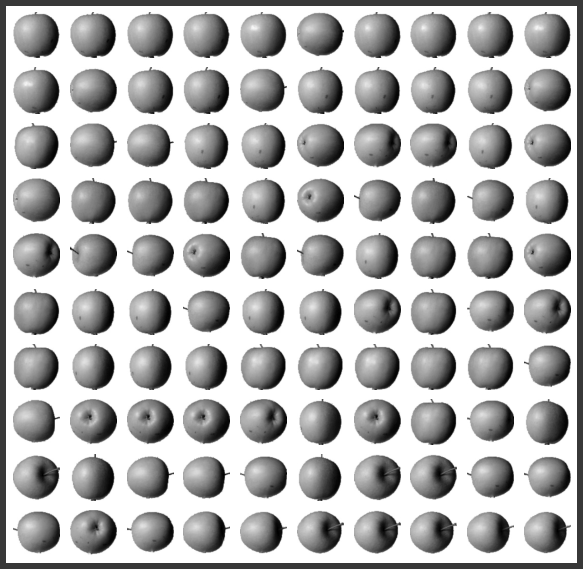
- 차이 배열을 오름차순 sort후, 작은 순으로 100개 index 저장
(사과 이미지가 100개이므로)
apple_index = np.argsort(abs_mean)[:100]
fig, axs = plt.subplots(10, 10, figsize=(10,10))
for i in range(10):
  for j in range(10):
    axs[i, j].imshow(fruits[apple_index[i*10 + j]], cmap='gray_r')
    axs[i, j].axis('off')

plt.show()