📌 차원 축소
- 차원
벡터 : 원소의 갯수
배열 : 축의 갯수
📍 주성분 분석(PCA)
- Principal Component Analysis
- 주성분 : 데이터가 가장 많이 위치하는 방향, vector
- 특성이 2개일때 주성분은 1개 = 차원 축소
- 주성분의 요소 갯수는 특성의 갯수와 동일
- n_components : 찾을 주성분 갯수
from sklearn.decomposition import PCA

pca = PCA(n_components=50)
pca.fit(fruits_2d)

print(pca.components_.shape)
(50, 10000)
- 10000개 차원을 100x100으로 그림
draw_fruits(pca.components_.reshape(-1, 100, 100))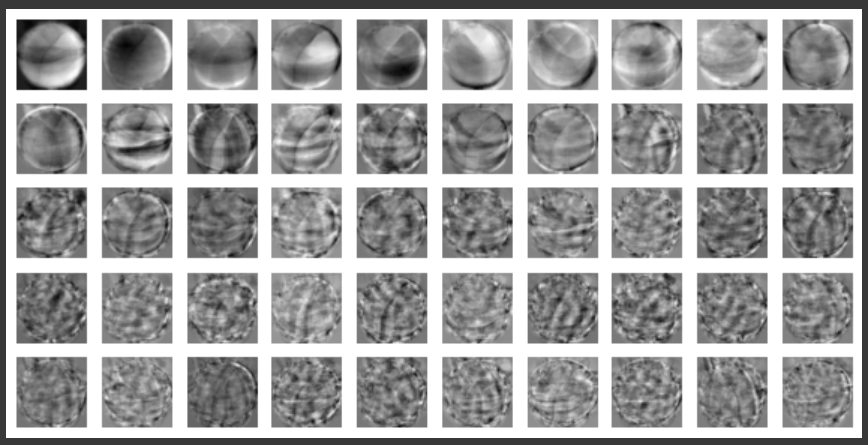
- transform : 50개 주성분을 찾았으니 50개 특성으로 변환
fruits_pca = pca.transform(fruits_2d)
print(fruits_pca.shape)
(300, 50)
📍 재구성 (복원)
- inverse_transform : 축소된 데이터를 다시 원본 크기로 재구성
fruits_inverse = pca.inverse_transform(fruits_pca)
print(fruits_inverse.shape)

fruits_reconstruct = fruits_inverse.reshape(-1, 100, 100)
draw_fruits(fruits_reconstruct)
📍 설명된 분산
- explained_variance_ratio_ : 50개 특성이 보존하는 분산의 합
print(np.sum(pca.explained_variance_ratio_))
plt.plot(pca.explained_variance_ratio_)
0.9215462358239324
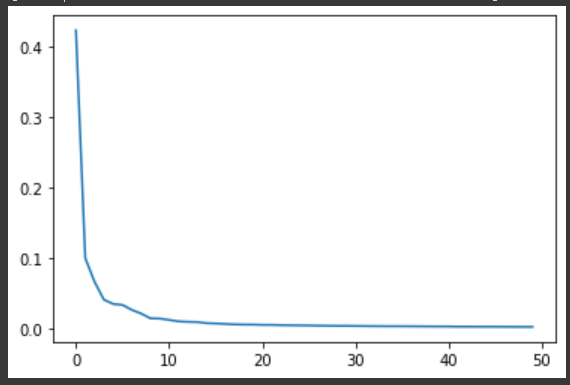
-> 10개 외의 특성은 크게 중요하지 않은 주성분
📍 분류기와 함께 사용
- 차원 축소로 정확도 증가, 훈련 시간 단축
- 로지스틱 회귀 -> 교차 검증
from sklearn.linear_model import LogisticRegression
from sklearn.model_selection import cross_validate

lr = LogisticRegression()
target = np.array([0]*100 + [1]*100 + [2]*100)

scores = cross_validate(lr, fruits_2d, target)
print(np.mean(scores['test_score']), np.mean(scores['fit_time']))

scores = cross_validate(lr, fruits_pca, target)
print(np.mean(scores['test_score']), np.mean(scores['fit_time']))
0.9966666666666667 1.1434682369232179 // 축소 전
1.0 0.03203639984130859 // 축소 후
- n_components = 실수
-> 주성분의 갯수를 미리 지정하지 않고, 설명된 분산의 총 비율을 입력하면 알아서 계산해줌
pca = PCA(n_components=0.5)
pca.fit(fruits_2d)
print(pca.n_components_)

fruits_pca = pca.transform(fruits_2d)
print(fruits_pca.shape)
2 // 2개 특성만 있으면 50% 분산 가능
(300, 2)
scores = cross_validate(lr, fruits_pca, target)
print(np.mean(scores['test_score']), np.mean(scores['fit_time']))
0.99 0.04648008346557617
-> 2개 특성만 사용해도 좋은 분류기 훈련이 가능
📍 군집과 함께 사용
from sklearn.cluster import KMeans
km = KMeans(n_clusters=3, random_state=42)
km.fit(fruits_pca)

print(np.unique(km.labels_, return_counts=True))
(array([0, 1, 2], dtype=int32), array([110, 99, 91]))
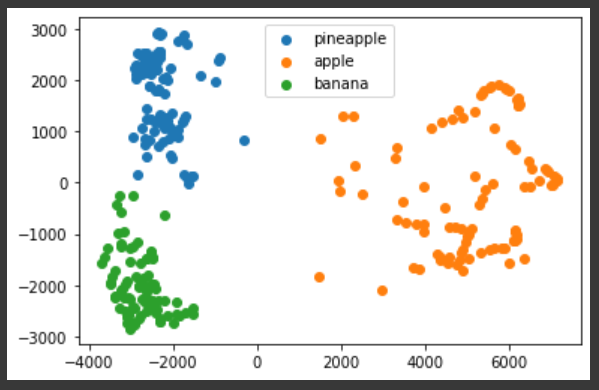
📍 시각화
- 차원이 작아야 그래프로 그리기 가능
- 주성분(특성) 2개 -> x : pca1, y : pca2
for label in range(0, 3):
  data = fruits_pca[km.labels_ == label]
  plt.scatter(data[:, 0], data[:, 1])
plt.legend(['pineapple', 'apple', 'banana'])
plt.show()