1. 교차검증
과적합
- 모델이 학습 데이터에만 과도하게 최적화된 현상. 일반화된 데이터에서 모델의 예측 성능이 떨어짐
Holdout
- 데이터를 학습용, 테스트용 두 가지로 나누는 것
- 여전히 과적합의 가능성이 있음
K-fold Cross Validation
- 전체 데이터셋을 랜덤하게 섞은 후 K개의 균등한 부분집합(folds)로 나눔
- 총 k번 모델을 교차검증하며 k-1개의 fold를 학습용, 나머지 1개의 데이터를 검증(validation)용으로 사용함
- 매 반복마다 accuracy, F1-score같은 평가 지표를 기록
- k번의 성능 점수의 평균과 분산/표준편차를 이용해 최종 성능 추정치를 얻음

- Python 실습
# 와인 데이터 로드
import pandas as pd

df = pd.read_csv("/kaggle/input/wine-quality-data-set-red-white-wine/wine-quality-white-and-red.csv")
df['taste'] = [1 if i > 5 else 0 for i in df['quality']]
df['type'] = df['type'].replace({'red': 0, 'white':1})
df.head()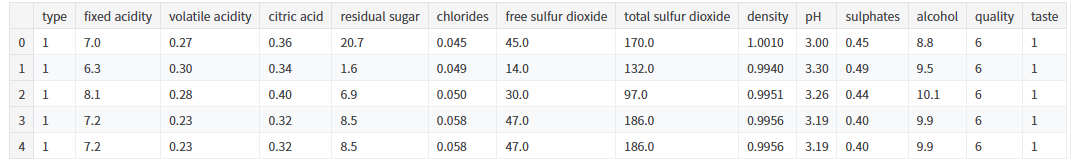
X = df.drop(['quality','taste'], axis=1)
y = df['taste']

# 의사결정 나무

from sklearn.model_selection import train_test_split
from sklearn.tree import DecisionTreeClassifier
from sklearn.metrics import accuracy_score

X_train, X_test, y_train, y_test = train_test_split(X, y, test_size=0.2, random_state = 23)
clf = DecisionTreeClassifier(max_depth = 2, random_state=23)
clf.fit(X_train, y_train)

y_pred_tr = clf.predict(X_train)
y_pred_ts = clf.predict(X_test)

accuracy_score(y_train,y_pred_tr), accuracy_score(y_test,y_pred_ts)

# 결과: (0.7354242832403309, 0.7269230769230769)
# K-fold corss validation
from sklearn.model_selection import KFold
kfold = KFold(n_splits = 5 ) # K-fold 객체 생성, K값 설정
clf_cv = DecisionTreeClassifier(max_depth=2, random_state = 23)# Kfold는 idx를 반환하므로 각 fold가 가진 idx를 기준으로 학습
# Split(): 파라미터에 대해 K개로 fold를 나누는 메서드
# for문이 k번 반복되며 각각에 대한 모델학습 및 평가
import numpy as np
cv_accuracy = []
for train_idx, test_idx in kfold.split(X):
X_train, X_test = X.iloc[train_idx], X.iloc[test_idx]
y_train, y_test = y.iloc[train_idx], y.iloc[test_idx]
clf_fit = clf_cv.fit(X_train, y_train)
pred = clf_fit.predict(X_test)
cv_accuracy.append(accuracy_score(y_test, pred))
print(f'avg by fold: {cv_accuracy}')
print(f'avg: {np.mean(cv_accuracy)}')
print(f'std: {np.std(cv_accuracy)}')
# 편하게 하는 방법
from sklearn.model_selection import cross_val_score

skfold = StratifiedKFold(n_splits=5)
clf_cv = DecisionTreeClassifier(max_depth=2, random_state = 23)

cross_val_score(clf_cv, X, y, scoring=None, cv = skfold)


# scoring: 모델을 평가할 기준
from sklearn.model_selection import cross_validate
cross_validate(clf_cv, X, y, scoring=None, cv = skfold, return_train_score=True)
# fit time: 각 fold에서 학습하는데 걸린 시간
# score time: 각 fold에서 평가를 계산하는데 걸린 시간
# test score: 검증에서의 성능 점수 / 보통 모델 성능을 평가할 때 사용하는 값
# train_score: 해당 fold에서 train 데이터의 성능
train_score는 높지만 test_score는 낮다면 학습/테스트 데이터에서 모델 성능차이가 크므로 과적합을 의심할 수 있다.
두 score가 모두 낮다면 과소적합을 의심할 수 있다.
3. 하이퍼파라미터 튜닝
하이퍼파라미터
- 모델의 성능을 확보하기위해 사람이 직접 조절하는 설정값
- 결정나무의 예에서 max_depth를 튜닝해볼 수있다.
- GridSerachCV를 이용해 각 하이퍼파라미터에 대한 시뮬레이션을 할 수 있다.
4. Python 실습
from sklearn.model_selection import GridSearchCV
from sklearn.tree import DecisionTreeClassifier

# 하이퍼파라미터값을 dict 형태로 선언
params = {'max_depth': [2,4,7,10]}
clf = DecisionTreeClassifier(max_depth = 2, random_state = 23)

# GridSearchCV 객체를 생성하고 estimator, 사용할 하이퍼파라미터 목록, cv값을 주기
gridsearch = GridSearchCV(estimator = clf, param_grid = params, cv = 5)
gridsearch.fit(X,y)
# 가독성이 더 높은 형태로 print하기
import pprint
pp = pprint.PrettyPrinter(indent=4)
pp.pprint(gridsearch.cv_results_)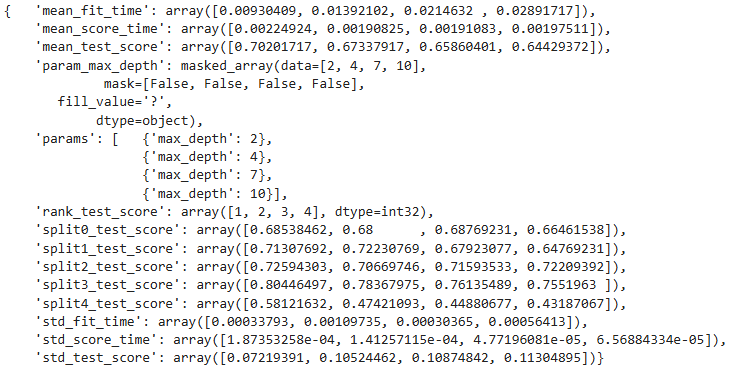
gridsearch.best_estimator_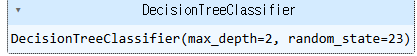
gridsearch.best_score_

# 결과: {'max_depth': 2}
# pipline 만들기
from sklearn.pipeline import Pipeline
from sklearn.tree import DecisionTreeClassifier
from sklearn.preprocessing import StandardScaler
estimators =[('scaler', StandardScaler()),
('clf', DecisionTreeClassifier(random_state=23))
]
pipe = Pipeline(estimators)
pipeparam_grid = {'clf__max_depth' : [2,4,7,10]}
GridSearch = GridSearchCV(estimator=pipe, param_grid = param_grid, cv = 5)
GridSearch.fit(X,y)GridSearch.best_estimator_GridSearch.best_score_
# 결과: 0.702017172973293GridSearch.cv_results_
import pandas as pd

score_df = pd.DataFrame(GridSearch.cv_results_)
score_df[['params', 'rank_test_score', 'mean_test_score','std_test_score']]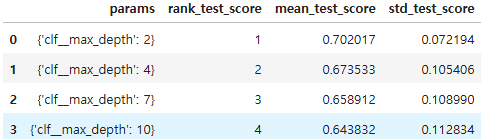

Data analysis, statistics