Pipeline
- Jupyter Notebook을 사용하면 데이터 전처리, 하이퍼 파리미터 튜닝 등 여러 반복을 진행하다보면 혼란을 야기할 수 있다.
- Sklearn에는 Pipeline을 이용해 여러 단계 (전처리 -> 학습 -> 예측)을 하나의 객체로 묶을 수 있다.
- 코드와 노트의 일관성과 가독성을 향상시킨다.
Python 실습
# 데이터 불러오기
import pandas as pd

df = pd.read_csv("/kaggle/input/wine-quality-data-set-red-white-wine/wine-quality-white-and-red.csv")
df['color'] = df['type'].replace({'red':0,'white':1})
df['taste'] = [1 if i > 5 else 0 for i in df['quality']]
df.tail()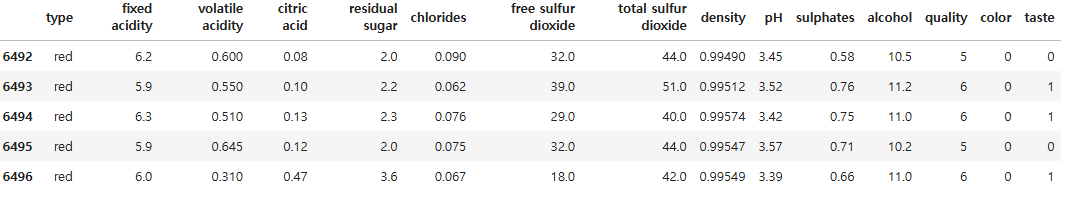
from sklearn.pipeline import Pipeline
from sklearn.tree import DecisionTreeClassifier
from sklearn.preprocessing import StandardScaler

# 실행할 단계의 이름과 객체를 변수로 선언
estimator = [('scaler', StandardScaler()),
              ('clf', DecisionTreeClassifier())]

# pipline 객체를 생성
pipe = Pipeline(estimator)
파이프라인 단계 속성 확인
pipe.steps
pipe[0]
pipe['scaler']
# 결과: [('scaler', StandardScaler()), ('clf', DecisionTreeClassifier())]# 스텝이름 + __ + 파라미터로 각 클래스의 파라미터틀 설정
pipe.set_params(clf__max_depth = 2)
pipe.set_params(clf__random_state = 13)# 데이터 분리
from sklearn.model_selection import train_test_split
X = df.drop(['type','quality','taste'], axis = 1)
y = df['taste']
X_train, X_test, y_train, y_test = train_test_split(X, y, test_size = 0.2, random_state = 23)
# 모델 생성
pipe.fit(X_train, y_train)
y_pred_tr = pipe.predict(X_train)
y_pred_ts = pipe.predict(X_test)
accuracy_score(y_train,y_pred_tr),accuracy_score(y_test,y_pred_ts)# 시각화
from sklearn.tree import plot_tree
import matplotlib.pyplot as plt
plt.figure(figsize=(12,8))
plot_tree(pipe['clf'], filled=True,
feature_names = X_train.columns,
class_names = ['red','white'],
rounded = True
)
plt.show()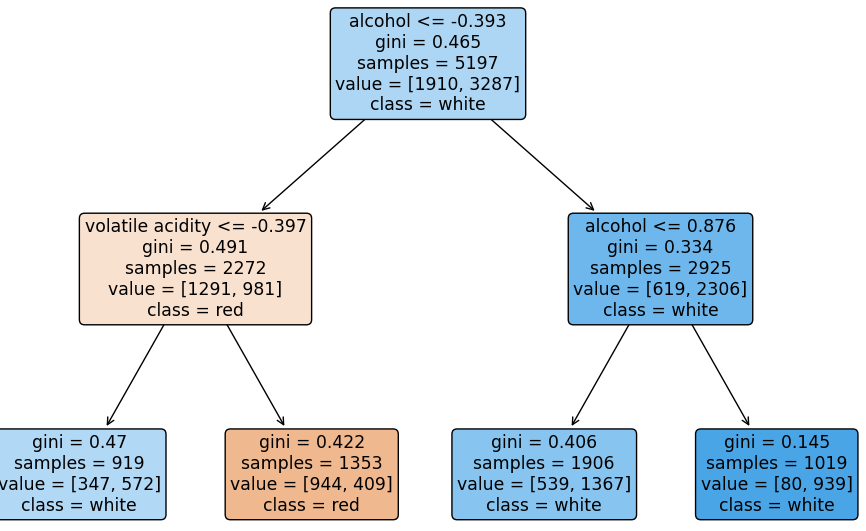

Data analysis, statistics