# Needleman–Wunsch DP-filling Visualization (matplotlib only)
# Author: You + ChatGPT
# Requirements: numpy, matplotlib (pip install numpy matplotlib)
import numpy as np
import matplotlib.pyplot as plt
from matplotlib import animation
# (NEW) Notebook-friendly embed; safe if not in IPython
_IN_IPY = False
try:
from IPython.display import HTML, display
plt.rcParams["animation.html"] = "jshtml"
_IN_IPY = True
except Exception:
pass
# -----------------------------
# 1) Scoring scheme
# -----------------------------
MATCH = 1
MISMATCH = -1
GAP = -2
# -----------------------------
# 2) Core algorithm (DP build + traceback)
# - yields every step for visualization
# -----------------------------
def needleman_wunsch_dp_steps(seq1, seq2, match=MATCH, mismatch=MISMATCH, gap=GAP):
"""
Build the NW DP matrix and yield intermediate states after each cell fill.
Returns:
S (np.ndarray): final score matrix
P (np.ndarray): pointer matrix with codes {0: diag, 1: up, 2: left, -1: none}
steps (list): list of (i, j) in the order they were filled
Yields:
(S_copy, (i,j)) at each cell fill for animation
"""
m, n = len(seq1), len(seq2)
S = np.zeros((m+1, n+1), dtype=int)
P = -1 * np.ones((m+1, n+1), dtype=int) # -1: none, 0:diag, 1:up, 2:left
# init borders (global alignment)
for i in range(1, m+1):
S[i, 0] = S[i-1, 0] + gap
P[i, 0] = 1 # up
for j in range(1, n+1):
S[0, j] = S[0, j-1] + gap
P[0, j] = 2 # left
steps = []
# fill DP
for i in range(1, m+1):
for j in range(1, n+1):
s = match if seq1[i-1] == seq2[j-1] else mismatch
diag = S[i-1, j-1] + s
up = S[i-1, j] + gap
left = S[i, j-1] + gap
best = max(diag, up, left)
S[i, j] = best
if best == diag:
P[i, j] = 0
elif best == up:
P[i, j] = 1
else:
P[i, j] = 2
steps.append((i, j))
yield (S.copy(), (i, j)) # yield state for animation
# final state (done filling)
yield (S.copy(), None)
return S, P, steps
def traceback_alignment(seq1, seq2, P):
"""
Reconstruct alignment from pointer matrix P.
Returns aligned strings (a1, a2) and path of visited cells from bottom-right to top-left.
"""
i, j = len(seq1), len(seq2)
a1, a2 = [], []
path = [(i, j)]
while i > 0 or j > 0:
ptr = P[i, j]
if i > 0 and j > 0 and ptr == 0: # diag
a1.append(seq1[i-1]); a2.append(seq2[j-1])
i -= 1; j -= 1
elif i > 0 and (ptr == 1 or j == 0): # up
a1.append(seq1[i-1]); a2.append('-')
i -= 1
else: # left
a1.append('-'); a2.append(seq2[j-1])
j -= 1
path.append((i, j))
a1.reverse(); a2.reverse()
path.reverse()
return ''.join(a1), ''.join(a2), path
# -----------------------------
# 3) Visualization utilities
# -----------------------------
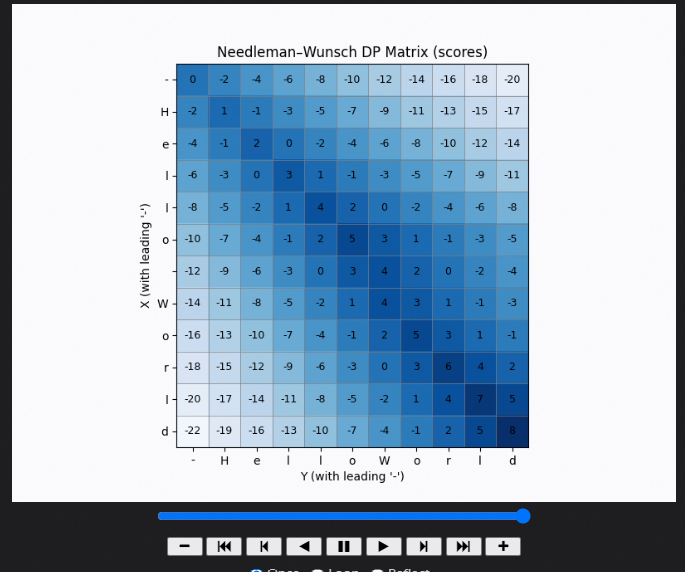
def draw_heatmap(ax, S, seq1, seq2, highlight=None, path=None):
"""
Draw DP matrix S as heatmap with text labels.
highlight: (i, j) cell to highlight while filling
path: list of (i, j) cells on traceback path to overlay
"""
ax.clear()
im = ax.imshow(S, cmap='Blues') # color map for scores
ax.set_title("Needleman–Wunsch DP Matrix (scores)")
ax.set_xlabel("Y (with leading '-')")
ax.set_ylabel("X (with leading '-')")
# axis ticks/labels
ylabels = ['-'] + list(seq1)
xlabels = ['-'] + list(seq2)
ax.set_xticks(np.arange(len(xlabels)))
ax.set_yticks(np.arange(len(ylabels)))
ax.set_xticklabels(xlabels)
ax.set_yticklabels(ylabels)
# grid lines
ax.set_xticks(np.arange(-.5, len(xlabels), 1), minor=True)
ax.set_yticks(np.arange(-.5, len(ylabels), 1), minor=True)
ax.grid(which='minor', color='gray', linestyle='-', linewidth=0.5)
ax.tick_params(which='minor', bottom=False, left=False)
# annotate values
for i in range(S.shape[0]):
for j in range(S.shape[1]):
ax.text(j, i, str(S[i, j]), ha='center', va='center', fontsize=9)
# highlight currently filled cell
if highlight is not None:
i, j = highlight
rect = plt.Rectangle((j-0.5, i-0.5), 1, 1, fill=False, edgecolor='red', linewidth=2)
ax.add_patch(rect)
# draw traceback path
if path:
ys = [p[0] for p in path]
xs = [p[1] for p in path]
ax.plot(xs, ys, marker='o', markersize=3, linewidth=1.5, color='orange')
return im
def animate_dp(seq1, seq2, interval=100, save_path=None):
"""
Animate DP filling. If save_path is provided (e.g., 'nw_fill.mp4' or 'nw_fill.gif'),
save the animation; otherwise show inline (Jupyter).
"""
fig, ax = plt.subplots(figsize=(8, 6))
gen = needleman_wunsch_dp_steps(seq1, seq2)
all_states = [state for state in gen] # precompute for animation & final read
final_S, _ = all_states[-1] # last state tuple: (S, None)
def init():
return []
def update(frame_idx):
S, hl = all_states[frame_idx]
draw_heatmap(ax, S, seq1, seq2, highlight=hl)
return []
anim = animation.FuncAnimation(
fig, update, init_func=init,
frames=len(all_states), interval=interval,
blit=False, repeat=False
)
if save_path:
if save_path.lower().endswith('.gif'):
anim.save(save_path, writer='pillow', fps=max(1, int(1000/interval)))
else:
anim.save(save_path, writer='ffmpeg', fps=max(1, int(1000/interval)))
plt.close(fig)
print(f"Saved animation to: {save_path}")
else:
if _IN_IPY:
# Show inline in notebooks
from IPython.display import HTML, display
display(HTML(anim.to_jshtml()))
else:
# Pop up a window for scripts
plt.show()
# keep alive by returning anim (caller assigns it)
return anim, final_S
def show_final_with_traceback(seq1, seq2):
"""
Compute full DP once more, show final heatmap + traceback path + aligned strings.
"""
m, n = len(seq1), len(seq2)
S = np.zeros((m+1, n+1), dtype=int)
P = -1 * np.ones((m+1, n+1), dtype=int)
for i in range(1, m+1):
S[i, 0] = S[i-1, 0] + GAP
P[i, 0] = 1
for j in range(1, n+1):
S[0, j] = S[0, j-1] + GAP
P[0, j] = 2
for i in range(1, m+1):
for j in range(1, n+1):
s = MATCH if seq1[i-1] == seq2[j-1] else MISMATCH
candidates = [S[i-1, j-1] + s, S[i-1, j] + GAP, S[i, j-1] + GAP]
best = np.argmax(candidates)
S[i, j] = candidates[best]
P[i, j] = best # 0 diag, 1 up, 2 left
a1, a2, path = traceback_alignment(seq1, seq2, P)
fig, ax = plt.subplots(figsize=(8, 6))
draw_heatmap(ax, S, seq1, seq2, highlight=None, path=path)
ax.set_title(f"Final DP + Traceback\nScore={S[m, n]}\n{a1}\n{a2}")
if _IN_IPY:
plt.show()
else:
plt.show()
return a1, a2, S[m, n]
# -----------------------------
# 4) Run (Example)
# -----------------------------
seqX = "Hello World" # with space
seqY = "HelloWorld" # no space
# Keep a reference to avoid GC; also works in scripts & notebooks
anim_obj, final_S = animate_dp(seqX, seqY, interval=120, save_path=None) # or save_path='nw_fill.gif'
# Show final DP with traceback path and print final alignment
a1, a2, score = show_final_with_traceback(seqX, seqY)
print("Aligned X:", a1)
print("Aligned Y:", a2)
print("Final Score:", score)
Hi!