해당 내용은 Udemy 강의 'Pandas 및 Python을 이용한 데이터 분석:마스터 클래스'를 수강 후 정리한 내용입니다.
FINAL BREAKOUT ROOM CHALLENGE:
- Use the stock_daily_prices.csv data that is included in the course/workshop package, plot a graph containing all prices of AAPL, sp500 and GOOG on one graph
- Plot a subplot containing all prices of AAPL, sp500 and GOOG in individual graphs
- Add legends indicating S&P500, AAPL and GOOG
- Place the legend in the "upper center" location
# load data
import matplotlib.pyplot as plot
import pandas as pd

stock_df = pd.read_csv('stock_daily_prices.csv')
stock_df
# plot a graph containing all prices of AAPL, sp500 and GOOG on one graph
stock_df.plot(x='Date', y=['AAPL', 'sp500', 'GOOG'], linewidth=1, figsize=(12, 6))
plt.title('FINAL BREAKOUT ROOM CHALLENGE 1')
plt.ylabel('Price')
plt.grid()
plt.legend(loc='upper center')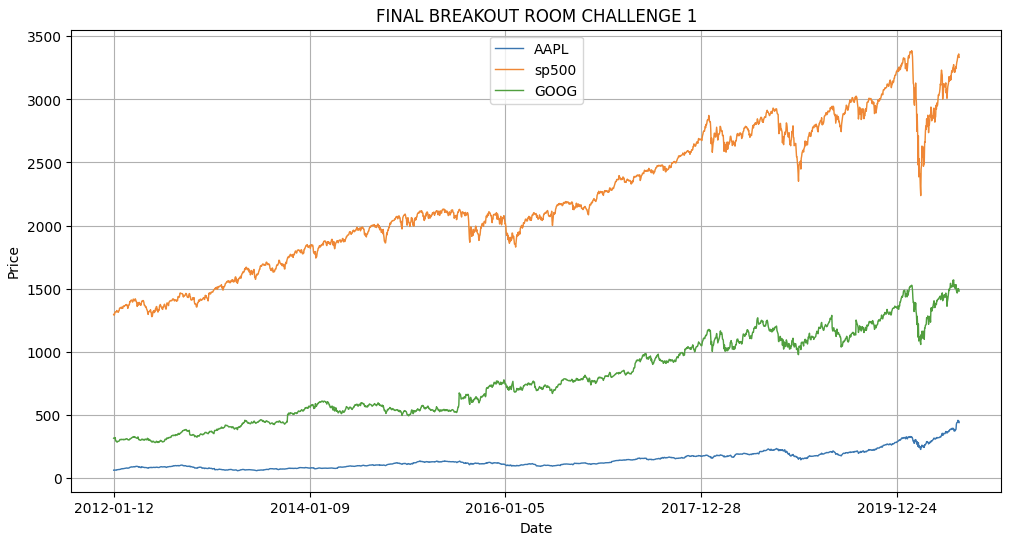
# Plot a subplot containing all prices of AAPL, sp500 and GOOG in individual graphs

stock_df.plot(x='Date', y=['AAPL', 'sp500', 'GOOG'], title='FINAL BREAKOUT ROOM CHALLENGE 2',
              subplots=True, linewidth=1, figsize=(12, 6), grid=True)

plt.legend(loc='upper center')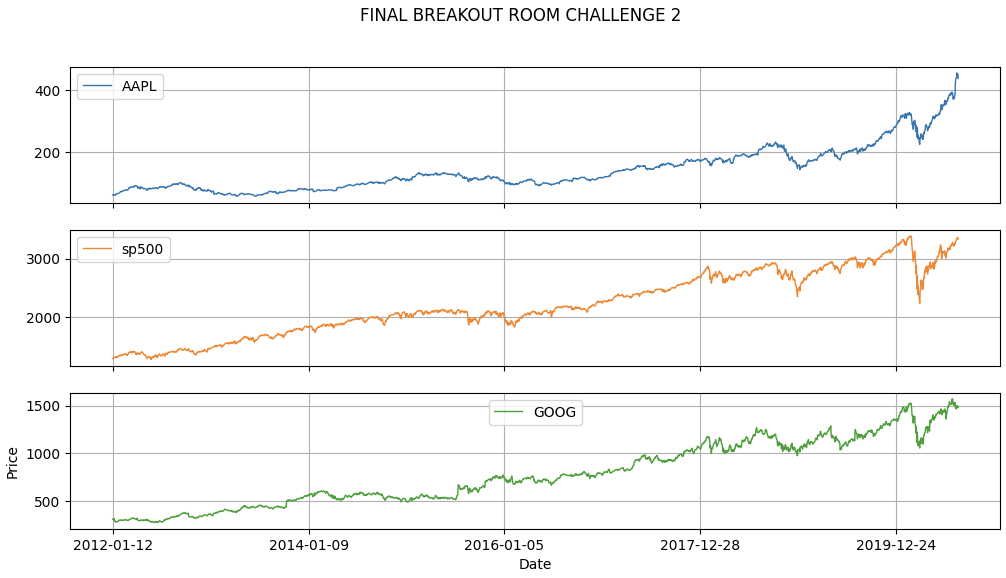

데이터를 향해, 한 걸음씩 천천히.