221115
702 실습
결측치처리 고민
결측치가 너무 많다고 삭제를 하는게 나은 방법이 아닐 수 있다.
이상치, 특잇값을 찾는다면 오히려 특정 값이 신호가 될 수도 있다.
번주형 값이라면 결측치가 많더라도 채우지 않고 인코딩 해주면 나머지 없는 값은 알아서 0으로 채워지게 된다.
그대신 희소한 행렬리 생성될 수 있다.
단, 수치 데이터인데 결측치라면 잘못채웠을 때, 모델이 오해할 수 있으니 주의가 필요하다.
Q. 왜도와 첨도의 정확한 수치까지 알아야할 필요가 있나요?
=> 정확한 수치까지 모르더라도 시각화를 해보면 알 수 있다. 그런데 변수가 100개 그 이 상이라면?
Anscombe's Quartet 데이터를 생각해 보면? 요약된 기술 통계는 데이터를 자세히 설명하지 못하는 부분도 있다.
그래서 왜도와 첨도는 변수가 수백개 될 때 전체적으로 왜도와 첨도가 높은 값을 추출해서 전처리 할 수 있다.
Q. 결측치를 0으로 채우면 안되는 데이터는 무엇일까?
=> 현실세계에서도 0이 될 수 없는 값들! 즉 domain 지식이 필요하다.
예를들면, 당뇨병 데이터에 있던 대부분의 0으로 된 데이터가 현실세계에서 생각했을 때 0이 될 수 없는 값이다. 혈당, 인슐린수치, 혈압 등등.
여기에서는 화장실 수, 2층면적, 지하면적, 주차장면적 은 해당 시설이 없다면 0이 될 수 있다.
그래서 전처리를 할 때 현실세계에서 해당 값이 0이 될 수 있는지 없는지를 고민해 보고 전처리를 해야한다.
일부 수치형 데이터를 확인해보자
squared_features = ['YearRemodAdd', 'LotFrontage',
              'TotalBsmtSF', '1stFlrSF', '2ndFlrSF', 'GrLivArea','GarageArea', 'TotalSF']
df[squared_features].hist(figsize=(12, 8), bins=50)
plt.show()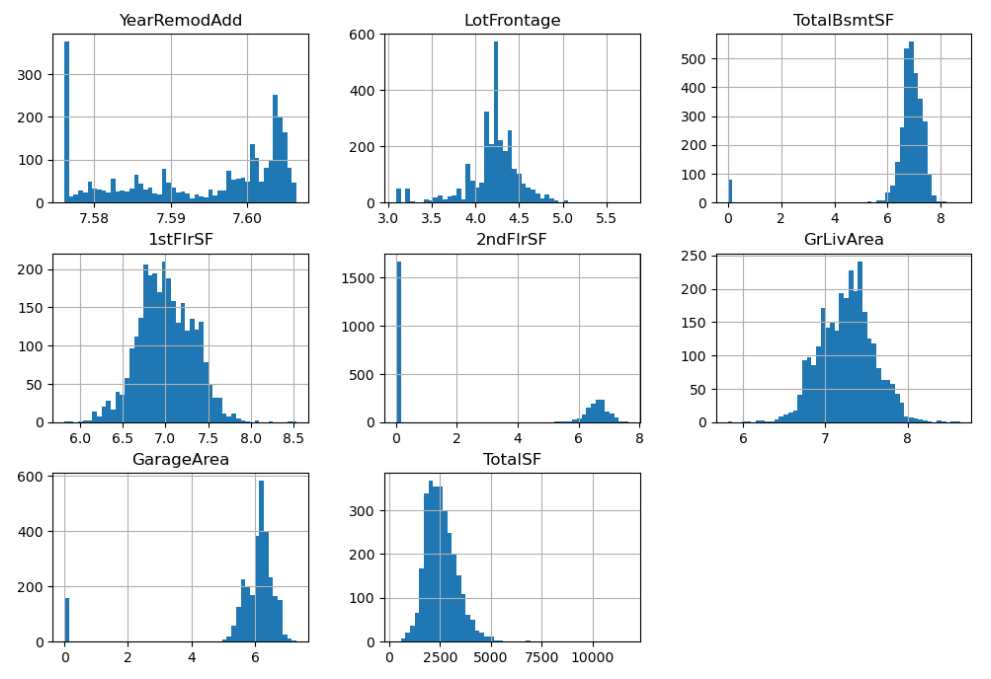
- GarageArea는 0이 많은게 오히려 현실적이다. 지하 공간이 없을 수도 있으니까.
- 2ndFlrSF 도 2층 이 없으면 2층 면적도 없으니까 0일수 있다.
- TotalSF 전체면적을 보면 0 값이 없으니 현실적이라고 할 수 있다.
값을 강조해서 보기 위해서 제곱을 해준다.
df_squared = df[squared_features] ** 2
df_squared.hist(figsize=(12, 8), bins=50);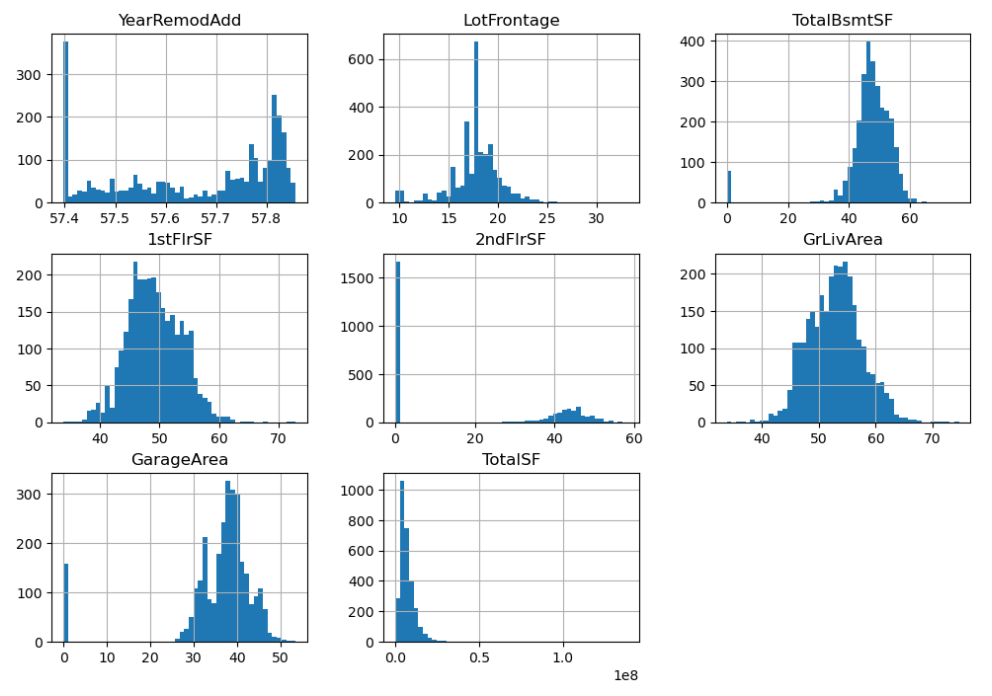
append 와 extend 차이
a = []
a.append([1,2,3])
a
>>> [[1, 2, 3]]

a = []
a.extend([1,2,3])
a
>>> [1, 2, 3]
append()는 전체를 넣어주고, extend()는 내용물을 풀어서 넣어준다.
Q.피처의 값에서 하나의 값이 많을 경우에도 해당 피처를 사용해야 할까요?
A. 다른 데이터에서도 같은 값이 들어있는 변수가 있을 때도 있다. 이런 값은 사용, 제거 둘 다 해보고 점수차이가 없다면 제외하는게 낫다.
만약 희소하게 등장하는 값이 중요한 역할을 한다면 예를들어 이상치 탐지라든지 특정 징후를 표현한다면 두는게 나을 수도 있다. 시각화해서 다른 변수와 함께 보는게 좋다.
pairplot을 볼 때도 수치 변수끼리의 상관을 보여주듯이 일단 비교해 보고 사용여부를 결정하는게 낫다.
수치형 데이터, 범주형 데이터 구하기
# 1. 수치형 데이터

# 내가 시도한 방벙
num_columns = df.select_dtypes(include="number").columns.tolist()
large_nunique = df.nunique()[(df.nunique()>150)].index.tolist()
num_not_cat = set(num_columns) & set(large_nunique)
num_not_cat = list(num_not_cat)
num_not_cat

# 강사님 방법
num_cate_feature = df[log_features].nunique()
num_cate_feature = num_cate_feature[num_cate_feature < 20].index
num_cate_feature

num_log_feature = list(set(log_features) - set(num_cate_feature))
num_log_feature

# 2. 범주형 데이터
df_cate = df.select_dtypes(include="object")
# 정렬을 하고 결측치가 있는 데이터를 제거하기 위해 슬라이싱을 사용
feature_cate = df_cate.isnull().mean().sort_values()[:-2].index
feature_cate- 범주형 데이터는 원핫인코딩 작업을 하기 때문에 결측치를 남겨두어도 상관은 없다.
- 없는 값은 변수로 생성하지 않기 때문이다.
ETL 과 ELT
참고
https://dining-developer.tistory.com/50
https://blog.naver.com/freepsw/222276087707
https://www.itworld.co.kr/news/160710
- E/Extract(추출) : 원본 데이터베이스 또는 데이터 소스에서 데이터를 가져오는 것을 말한다. ETL을 사용하면 데이터가 임시 스테이징 영역으로 들어가고, ELT를 사용하면 즉시 데이터가 Lake 스토리지 시스템으로 이동한다.
- T/Transform(변환) : 데이터의 구조를 변경하는 프로세스를 의미한다. 용도에 맞는 필터링, Resahping, 정재 등의 단계를 통해 필요한 형태로 변환한다.
- L/Load(적재) : 데이터를 스토리지에 저장하는 프로세스를 의미한다.
제출해보기
모델생성
from sklearn.ensemble import RandomForestRegressor

model = RandomForestRegressor(random_state=42, max_depth=18, max_features=0.8)
model
KFold 로 분할해주기
- KFold 에서 random state 를 정해주면 분할을 고정 할 수 있다.
from sklearn.model_selection import KFold

kf = KFold(n_splits=5, shuffle=True, random_state=42)
kf
cross validation
- cv 에 kfold 적용
from sklearn.model_selection import cross_val_predict

y_valid_predict = cross_val_predict(model, X_train, y_train, cv=kf, n_jobs=-1)
y_valid_predict- cv : int, cross-validation generator or an iterable, default=None
교차검증을 어떻게 할지를 결정한다.- None, to use the default 5-fold cross validation
- int, to specify the number of folds in a (Stratified)KFold
- CV splitter
- An iterable that generates (train, test) splits as arrays of indices
점수구하기
- rmse
rmse = (((y_train - y_valid_predict)**2).mean())** 0.5
rmse
>>> 0.15238672288125962

from sklearn.metrics import mean_squared_error

mean_squared_error(y_train, y_valid_predict) ** 0.5
>>> 0.15238672288125957- r2 score
# 1에 가까울 수록 좋다.
from sklearn.metrics import r2_score

r2_score(y_train, y_valid_predict)
>>> 0.8543640637503126- 시각화로 비교해보기
_ = sns.regplot(x=y_train, y=y_valid_predict)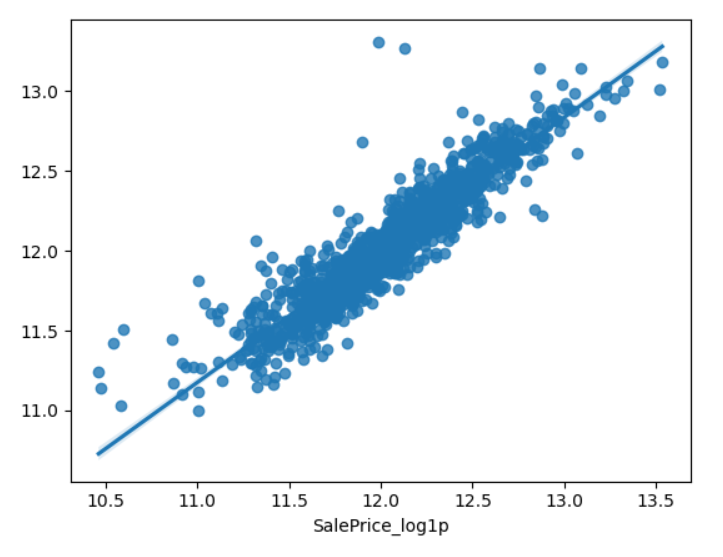
_ = sns.kdeplot(y_train)
_ = sns.kdeplot(y_valid_predict)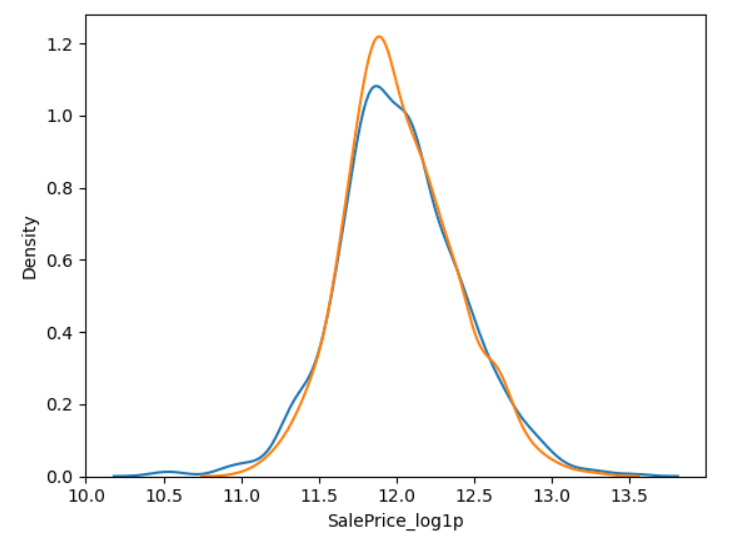
- 피쳐중요도보기
- 피쳐가 엄청 많아서 알아보기 힘들기 때문에, 이럴때는 Series 로 만들어서 처리해준다.
fi = pd.Series(model.feature_importances_)
fi.index = model.feature_names_in_
fi.nlargest(20)

fi.nlargest(20).plot.barh()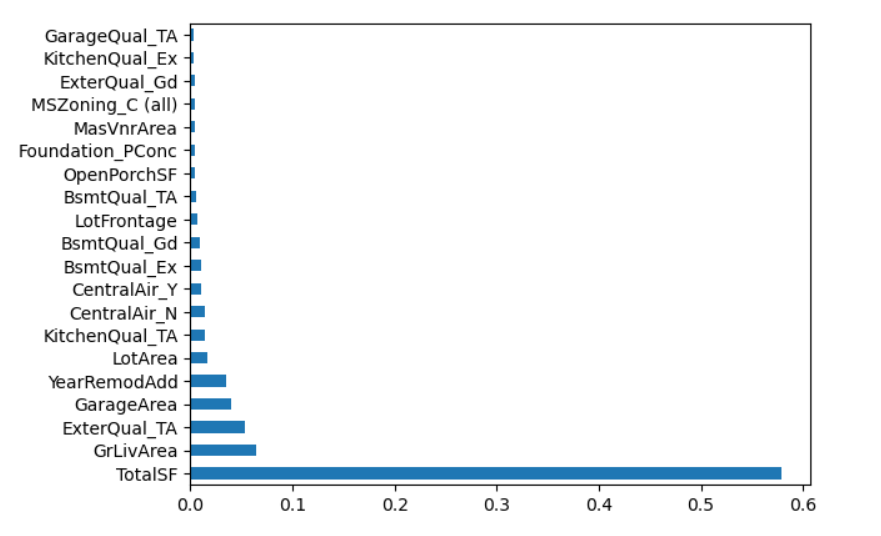
<702 실습 정리>
수치형
- 결측치 대체(Imputation)
- 수치형 변수를 대체할 때는 원래의 값이 너무 왜곡되지 않는지도 주의가 필요합니다.
- 중앙값(중간값), 평균값 등의 대표값으로 대체할 수도 있지만,
- 당뇨병 실습에서 했던 회귀로 예측해서 채우는 방법도 있습니다.
- 당뇨병 실습에서 했던 인슐린을 채울 때 당뇨병 여부에 따라 대표값을 구한 것 처럼
- 여기에서도 다른 변수를 참고해서 채워볼 수도 있습니다.
- 스케일링 - Standard, Min-Max, Robust
- 변환 - log
- 이상치(너무 크거나 작은 범위를 벗어나는 값) 제거 혹은 대체
- 오류값(잘못된 값) 제거 혹은 대체
- 이산화 - cut, qcut
범주형
- 결측치 대체(Imputation)
- 인코딩 - label, ordinal, one-hot-encoding
- 범주 중에 빈도가 적은 값은 대체하기