
개요
- 라이브러리 및 데이터 불러오기
- 탐색적 데이터 분석(EDA)
문제에서 주어지는 데이터를 불러오고 EDA 하는 방법에 대한 흐름과 문법들을 잘 기억해놓자!
EDA (데이터 3개일 때)
데이터 : 성인 인구조사 소득 예측
.
주어진 3개의 데이터 파일
- X_train.csv
- X_test.csv
- y_train.csv
- id : 고유의 id 값
- age : 나이
- workclass : 고용 형태
- fnlwgt : 사람 대표성을 나타내는 가중치 (final weight의 약자)
- education : 교육 수준
- education_num : 교육 수준 수치
- marital_status: 결혼 상태
- occupation : 업종
- relationship : 가족 관계
- race : 인종
- sex : 성별
- capital_gain : 양도 소득
- capital_loss : 양도 손실
- hours_per_week : 주당 근무 시간
- native_country : 국적
- income : 수익(예측해야 하는 값)
- "> 50K" : 1
- "<= 50K" : 0
📌 데이터 불러오기
- 라이브러리 불러오기
# 판다스 라이브러리
import pandas as pd

- 데이터 불러오기
# 데이터 불러오기
X_train = pd.read_csv("/content/drive/MyDrive/Colab Notebooks/edadata/data_atype/X_train.csv")
y_train = pd.read_csv("/content/drive/MyDrive/Colab Notebooks/edadata/data_atype/y_train.csv")
X_test = pd.read_csv("/content/drive/MyDrive/Colab Notebooks/edadata/data_atype/X_test.csv")

📌 데이터 샘플 확인
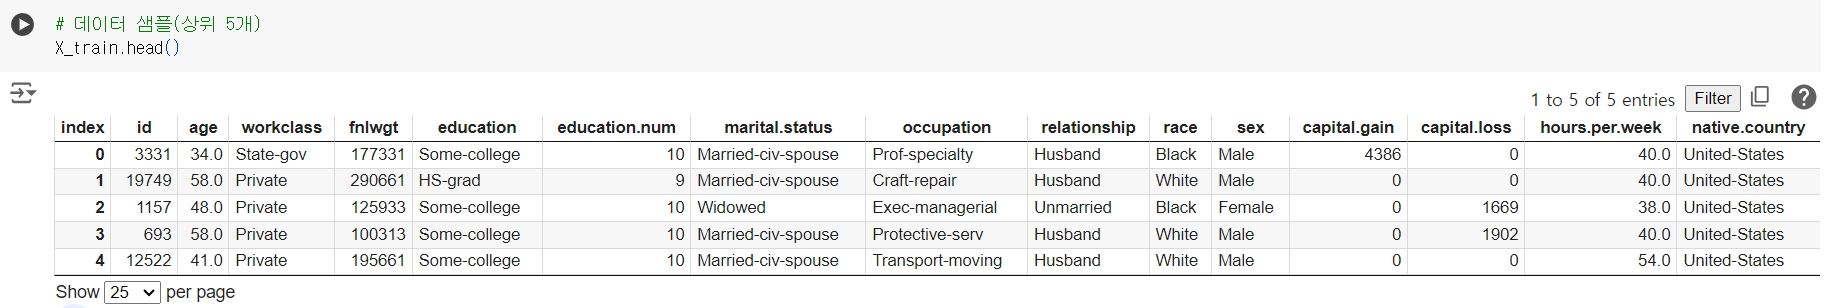
- 상위 5개
# 데이터 샘플(상위 5개)
X_train.head()
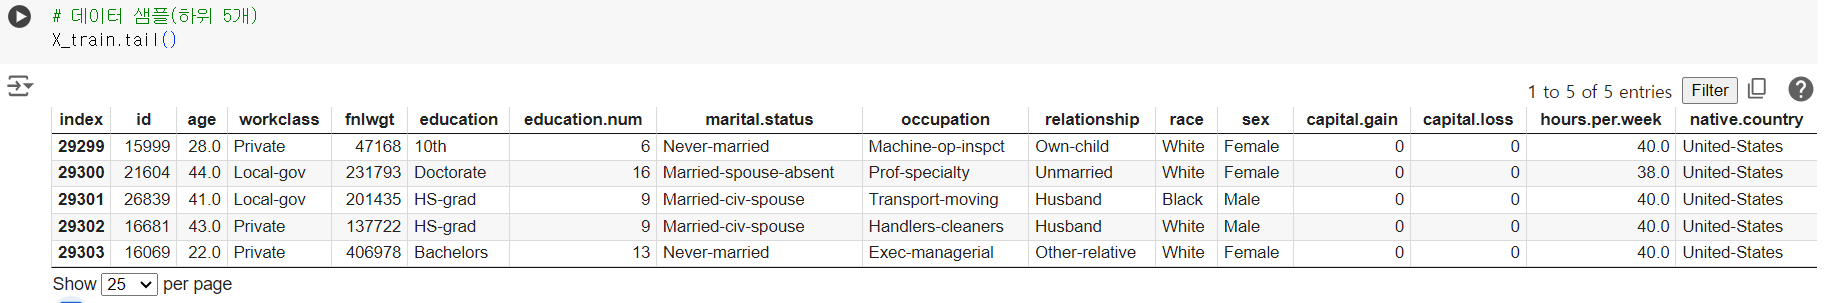
- 하위 5개
# 데이터 샘플(하위 5개)
X_train.tail()
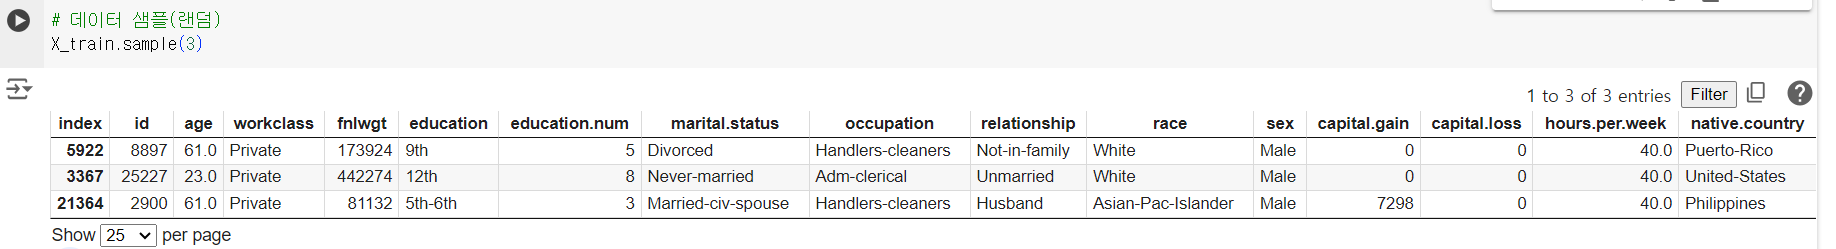
- 랜덤 3개
# 데이터 샘플(랜덤)
X_train.sample(3)
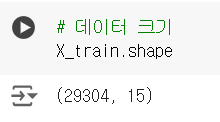
📌 데이터 크기
.shape(괄호 없음 주의!)
# 데이터 크기
X_train.shape
📌 데이터 타입
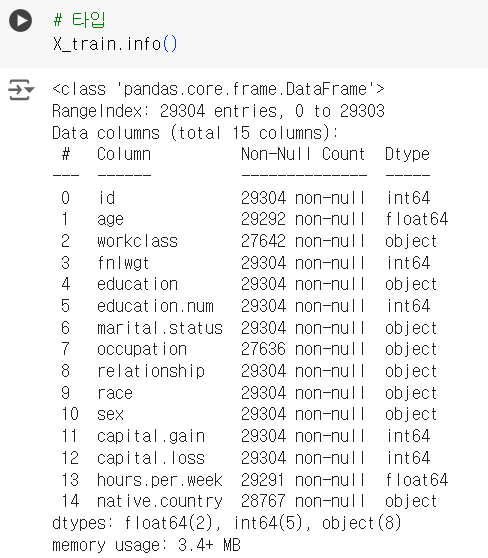
.info()
# 타입
X_train.info()
📌 수치형 컬럼 기초 통계
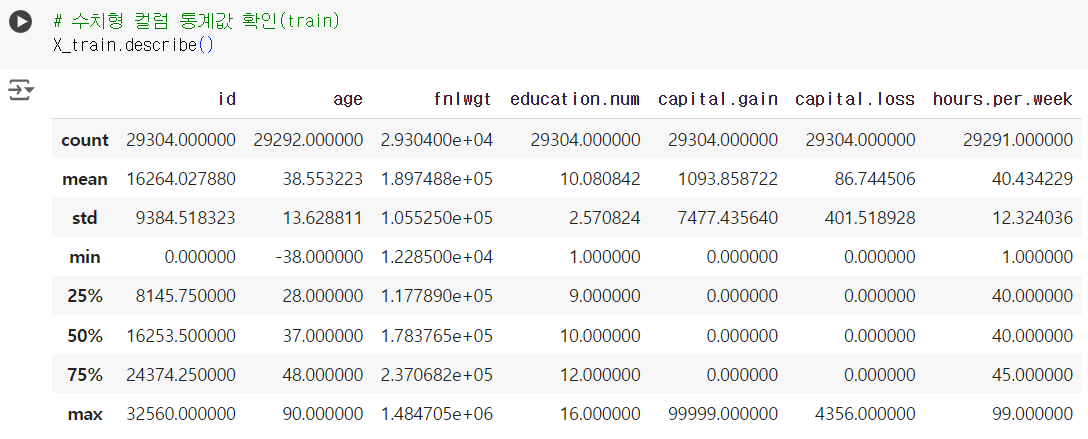
.describe()
# 수치형 컬럼 통계값 확인(train)
X_train.describe()
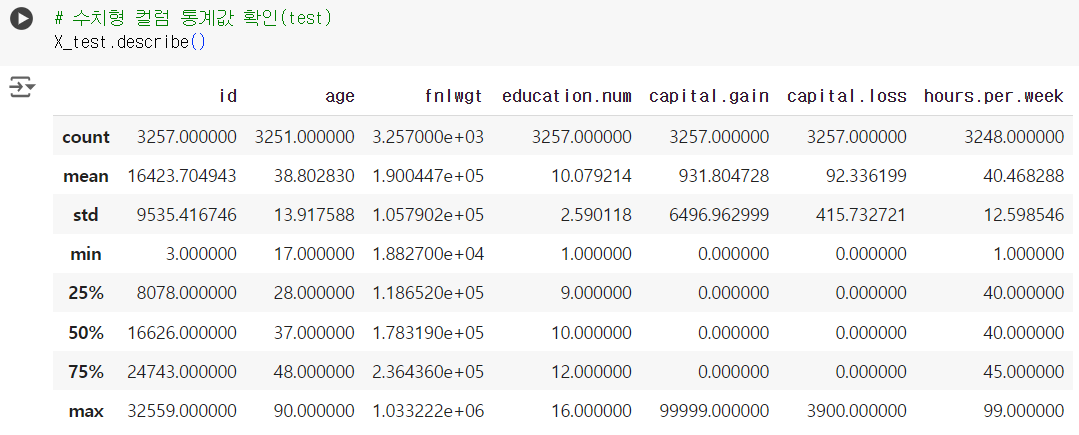
# 수치형 컬럼 통계값 확인(test)
X_test.describe()
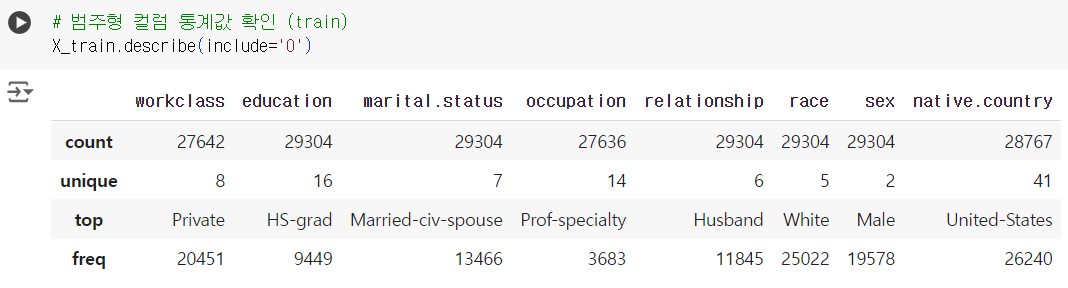
📌 범주형 컬럼 기초 통계
.describe(include = 'O')(대문자 O 주의!)
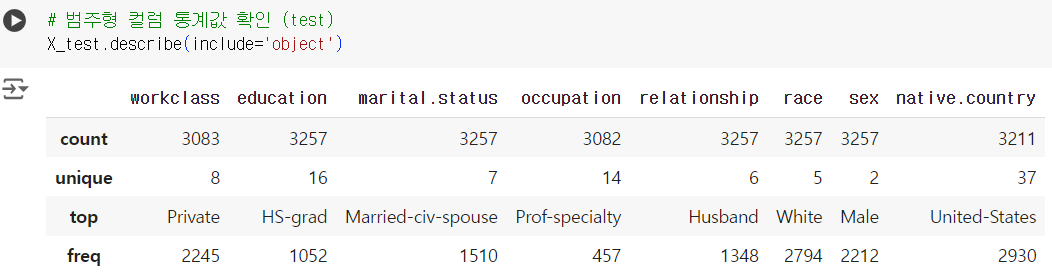
# 범주형 컬럼 통계값 확인 (train)
X_train.describe(include='O')
include = 'object'로도 사용 가능
# 범주형 컬럼 통계값 확인 (test)
X_test.describe(include='object')
📌 결측치
-
.isnull(): 모든 데이터 중 결측치에 대해 True, False로 반환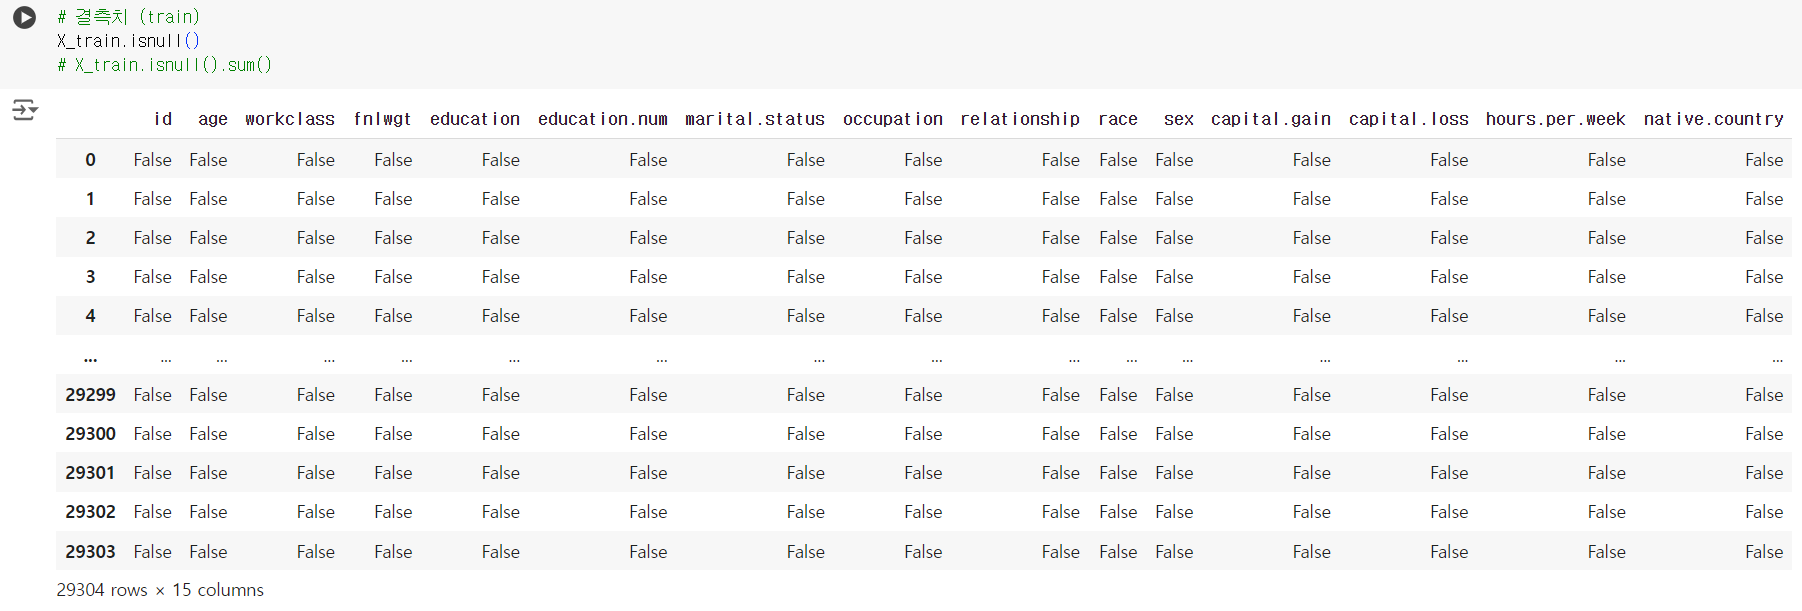
-
.isnull().sum(): 칼럼별 결측치의 갯수를 보고 싶을 때 사용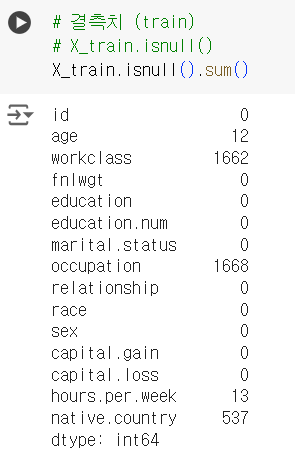
# 결측치 (train)
# X_train.isnull()
X_train.isnull().sum()
📌 y_train 데이터
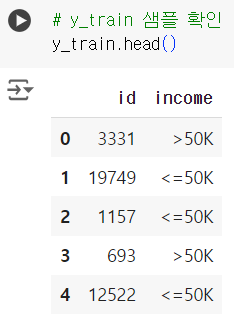
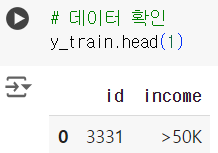
- 샘플 확인 : income 에 대한 값들을 50K 기준으로 고소득, 저소득으로 나누는 것(분류)으로 확인
# y_train 샘플 확인
y_train.head()
📌 타겟값 확인
-.value_counts() (count's' 주의!)
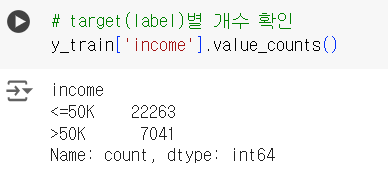
# target(label)별 개수 확인
y_train['income'].value_counts()
📌 상관관계
.corr()
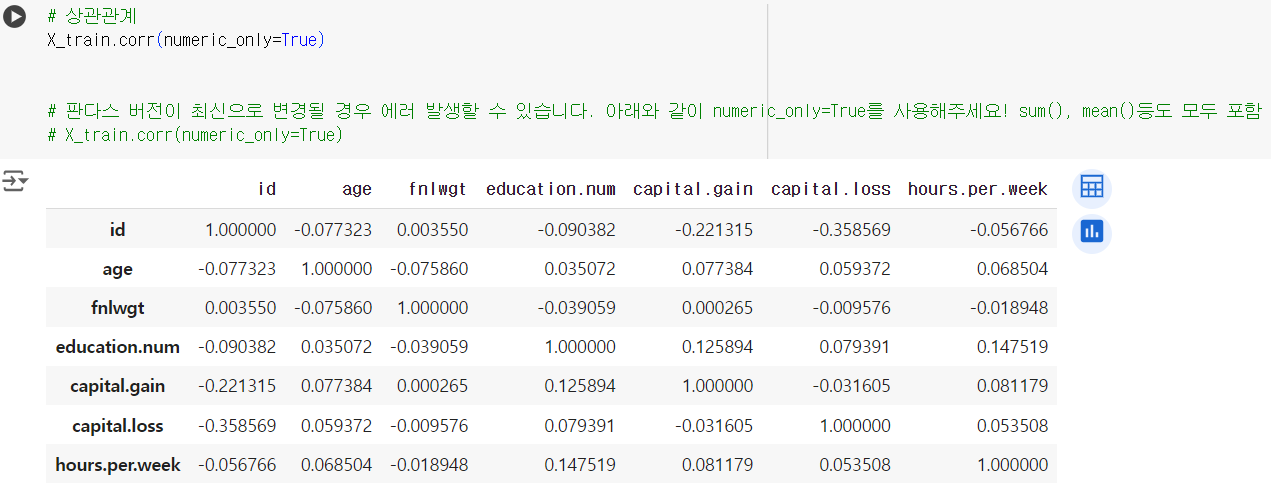
# 상관관계
X_train.corr(numeric_only=True)
# 최신 판다스에서 오류 발생 시 numeric_only=True 사용 # sum(), mean() 등 포함
EDA (데이터 2개일 때)
📌 데이터 불러오기
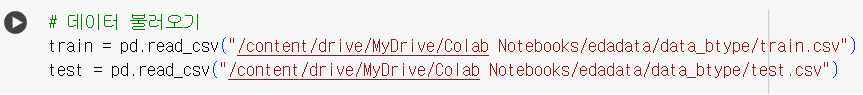
# 데이터 불러오기
train = pd.read_csv("/content/drive/MyDrive/Colab Notebooks/edadata/data_btype/train.csv")
test = pd.read_csv("/content/drive/MyDrive/Colab Notebooks/edadata/data_btype/test.csv")
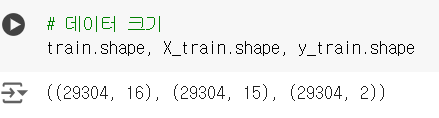
📌 데이터 크기
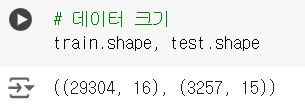
# 데이터 크기
train.shape, test.shape
📌 데이터 샘플
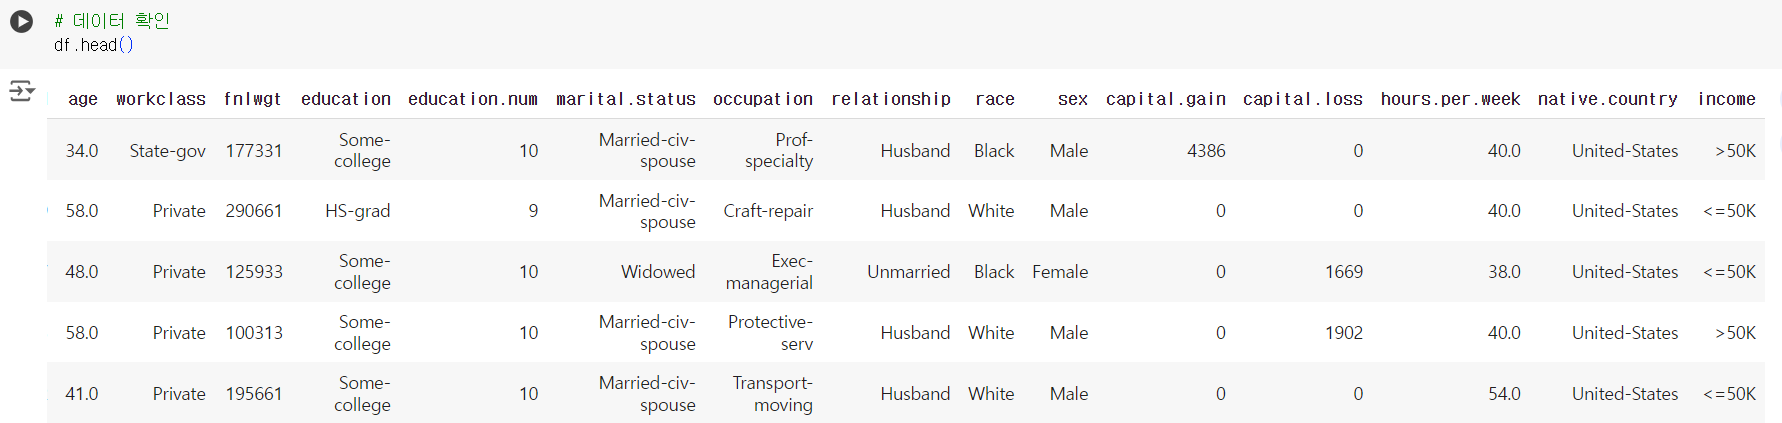
- 데이터가 2개로 주어질 경우 train 데이터에 예측해야할 칼럼이 포함되어 있다.
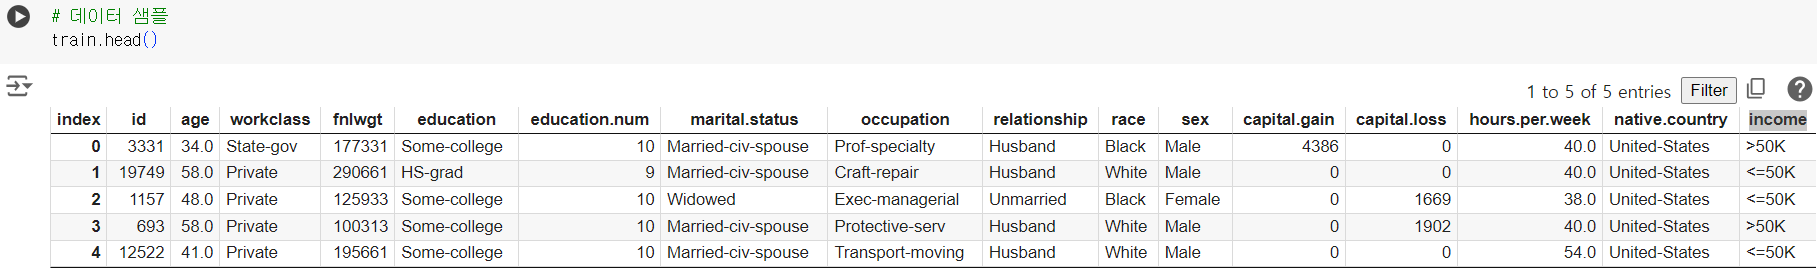
# 데이터 샘플
train.head()
📌 타겟값 확인
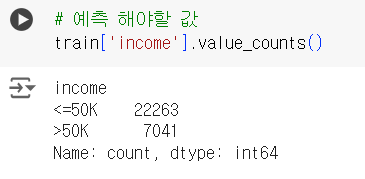
# 예측 해야할 값
train['income'].value_counts()
- 데이터가 2개로 주어져 예측 칼럼이 train 테이블에 포함되어 있다면,
아래와 같은 조건에 따른 EDA 들도 가능 !
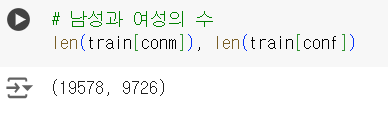
# 조건
con0 = train['income'] == "<=50K" #0 : 하위 소득
con1 = train['income'] == ">50K" #1 : 상위 소득
conf = train['sex'] == "Female" # 여성
conm = train['sex'] == "Male" #남성

# 남성과 여성의 수
len(train[conm]), len(train[conf])
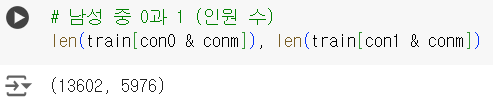
# 남성 중 0과 1 (인원 수)
len(train[con0 & conm]), len(train[con1 & conm])
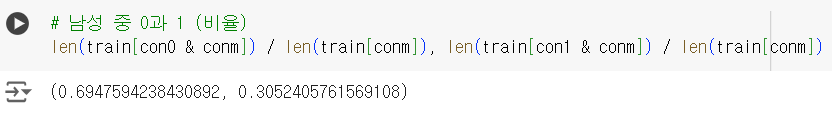
# 남성 중 0과 1 (비율)
len(train[con0 & conm]) / len(train[conm]), len(train[con1 & conm]) / len(train[conm])
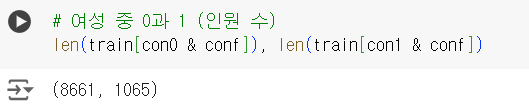
# 여성 중 0과 1 (인원 수)
len(train[con0 & conf]), len(train[con1 & conf])
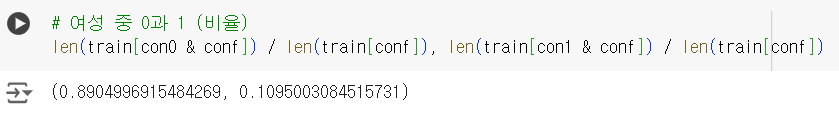
# 여성 중 0과 1 (비율)
len(train[con0 & conf]) / len(train[conf]), len(train[con1 & conf]) / len(train[conf])
📌 기타 EDA
- 추가적으로 기준을 달리 하거나 그룹을 묶어 다양한 EDA를 시도해볼 것!

데이터 병합 및 분리
📌 데이터 합치기
.concat()axis = 0 은 위아래로 합치고, 1은 좌우로 합친다.
# X_train y_train 합치는 것 예시
df = pd.concat([X_train, y_train['income']], axis = 1)
df.shape

- income 칼럼이 없던 X_train 데이터에 y_train 테이블을 합쳐
데이터 2개가 주어질 때처럼 income 칼럼 병합
📌 데이터 분리하기
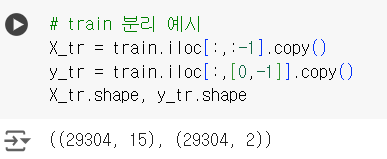
.iloc()또는.loc()활용하기.copy()로 복사본 생성 (원본 데이터에 영향을 주지 않기 위해)
# train 분리 예시
X_tr = train.iloc[:,:-1].copy()
y_tr = train.iloc[:,[0,-1]].copy()
X_tr.shape, y_tr.shape

커피 좋아하는 데이터 꿈나무