
파이썬 시각화의 표준인 Matplotlib과 Seaborn
왜 시각화가 필요한가?
-> describe()로 본 평균과 표준편차가 같더라도, 실제 데이터 분포는 완전히 다를 수 있다.
import pandas as pd
import matplotlib.pyplot as plt
import seaborn as sns
class VisualDataAnalyzer:
def __init__(self, file_path: str):
self.df = pd.read_csv(file_path)
print(f"[성공] {file_path} 데이터를 시각화 모드로 불러왔습니다.")
def plot_histogram(self, column: str):
plt.figure(figsize=(10, 6))
sns.histplot(data=self.df, x=column, kde=True)
plt.title(f"Distribution of {column}")
plt.show()
def plot_scatter(self, x_col: str, y_col: str):
plt.figure(figsize=(10, 6))
sns.scatterplot(data=self.df, x=x_col, y=y_col)
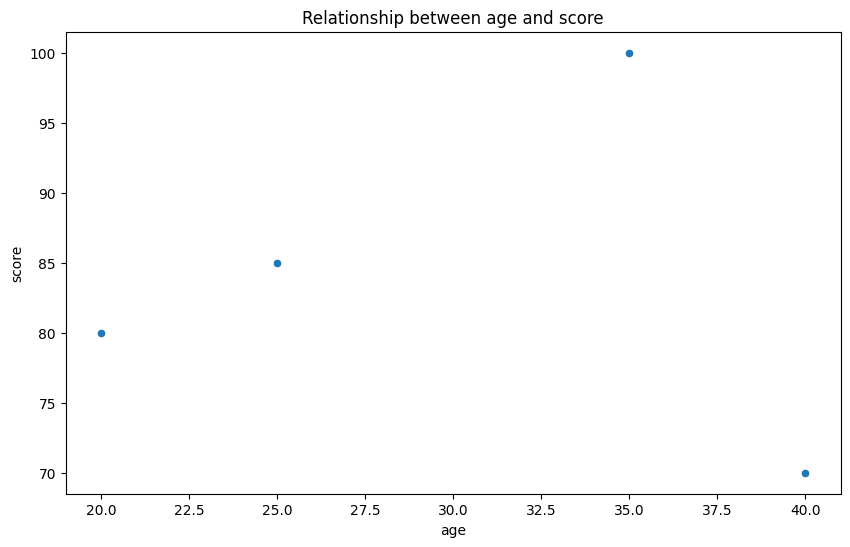
plt.title(f"Relationship between {x_col} and {y_col}")
plt.show()
# --- 실행부 ---
v_analyzer = VisualDataAnalyzer('test_data.csv')
# 2. 점수 분포 확인
v_analyzer.plot_histogram('score')
# 3. 나이와 점수의 관계 확인
v_analyzer.plot_scatter('age', 'score')
- Matplotlib은 도화지를 펴는 역할을 하고, Seaborn은 그 위에 예쁜 그림을 쉽게 그려주는 도구이다. 보통 두 개를 섞어서 사용한다.
- KDE(Kernel Density Estimate): 히스토그램 위의 부드러운 곡선이다. 데이터가 어디에 밀집되어 있는지 더 직관적으로 보여준다.

AI/ML Engineer 🧑💻