
Dataset : https://www.kaggle.com/zhangluyuan/ab-testing
이번에는 Kaggle의 A/B testing 샘플 데이터셋을 활용해 A/B test를 연습해보도록 하겠습니다.
데이터를 불러온 뒤 중복행 제거 후 데이터의 구조를 확인하겠습니다.
ab <- read.csv("ab_data.csv")

ab <- unique(ab)

str(ab)
'data.frame': 294478 obs. of 5 variables:
$ user_id : int 851104 804228 661590 853541 864975 936923 679687 719014 817355 839785 ...
$ timestamp : chr "2017-01-21 22:11:48.556739" "2017-01-12 08:01:45.159739" "2017-01-11 16:55:06.154213" "2017-01-08 18:28:03.143765" ...
$ group : chr "control" "control" "treatment" "treatment" ...
$ landing_page: chr "old_page" "old_page" "new_page" "new_page" ...
$ converted : int 0 0 0 0 1 0 1 0 1 1 ...
데이터의 구조를 확인해보니 5개의 변수와 294478개의 행으로 구성되어 있는 것을 확인할 수 있습니다.
각 변수에 대해 설명드리자면,
user_id : 사용자 ID
timestamp : 타임 스탬프(시간 표기)
group : 사용자가 control 혹은 treatment 그룹에 속하는 지 여부
landing_page : 사용자가 최초로 보게 되는 페이지가 new_page 혹은 old_page인지 여부
converted : 사용자가 0(전환하지 않음) 혹은 1(전환)인지 여부
라고 볼 수 있습니다.
한 번 각 변수별 결측값 또한 확인해보겠습니다.
colSums(is.na(ab)) user_id timestamp group landing_page converted
0 0 0 0 0
결측값 확인 결과 데이터에는 결측값이 존재하지 않는 것으로 확인되었습니다.
이제 각 변수들을 적절한 타입에 맞게 변환한 뒤 EDA를 진행해보겠습니다.
ab$group <- factor(ab$group)

ab$landing_page <- factor(ab$landing_page)

ab$converted <- factor(ab$converted)
ab %>% group_by(group) %>% count() %>% ggplot(aes(x=group, y=n, fill=group)) + geom_bar(stat = "identity") + geom_text(aes(label = n), size = 10)
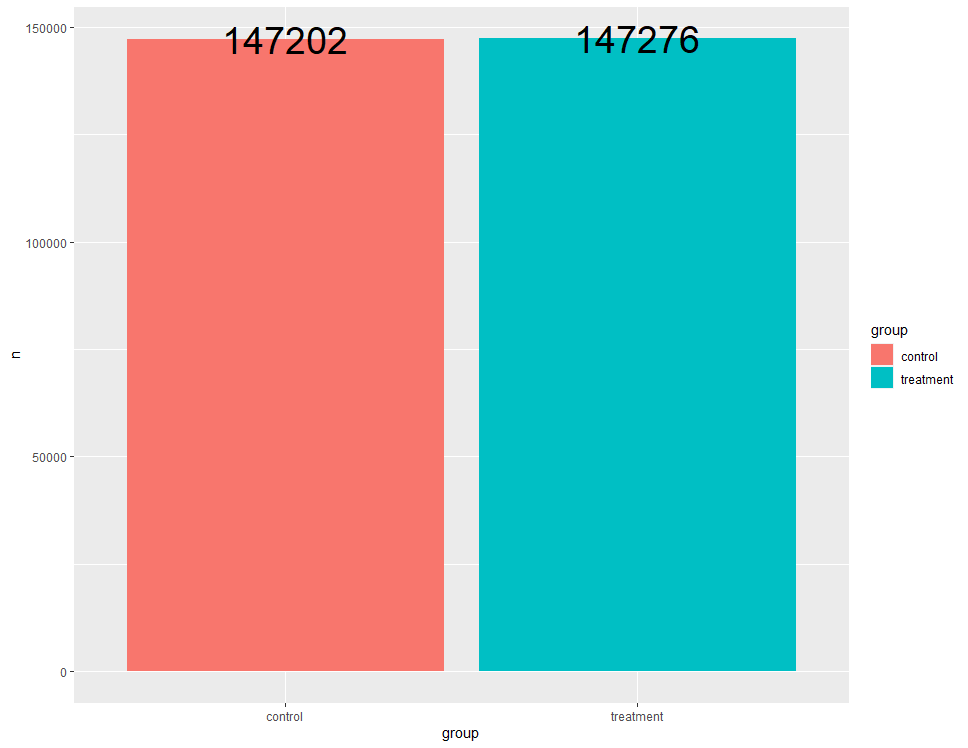
control 그룹과 treatment 그룹에 속하는 사용자 수에는 큰 차이가 없습니다.
ab %>% group_by(landing_page) %>% count() %>% ggplot(aes(x=landing_page, y=n, fill=landing_page)) + geom_bar(stat = "identity") + geom_text(aes(label = n), size = 10)
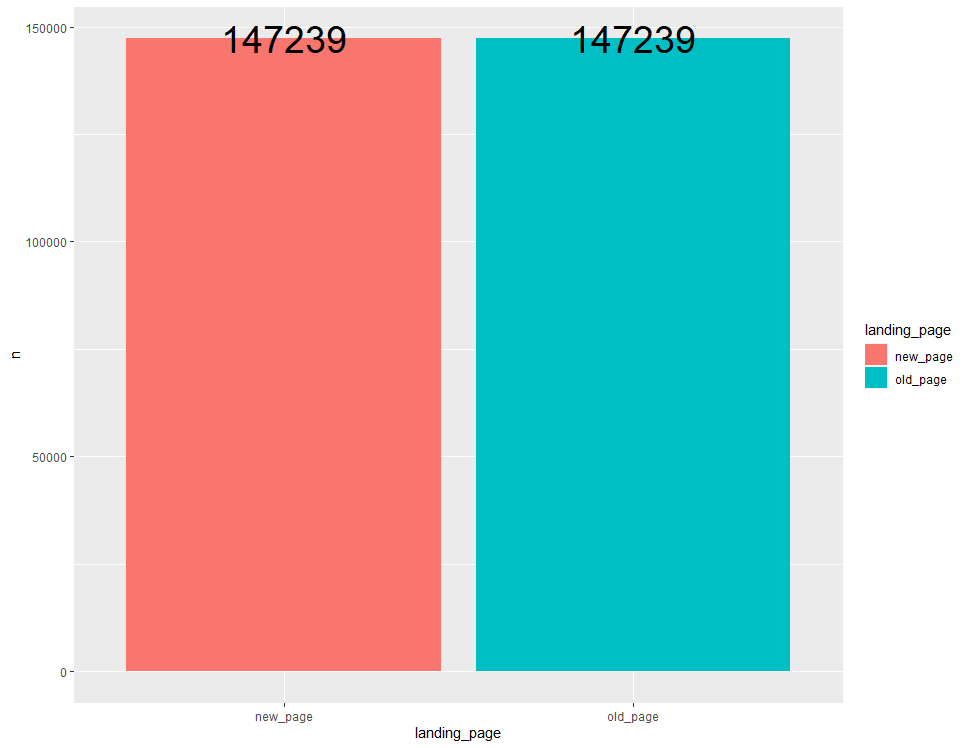
landing_page가 new_page인 사용자와 old_page인 사용자의 수는 같습니다.
ab %>% group_by(converted) %>% count() %>% ggplot(aes(x=converted, y = n, fill = converted)) + geom_bar(stat = "identity") + geom_text(aes(label = n), size = 10)
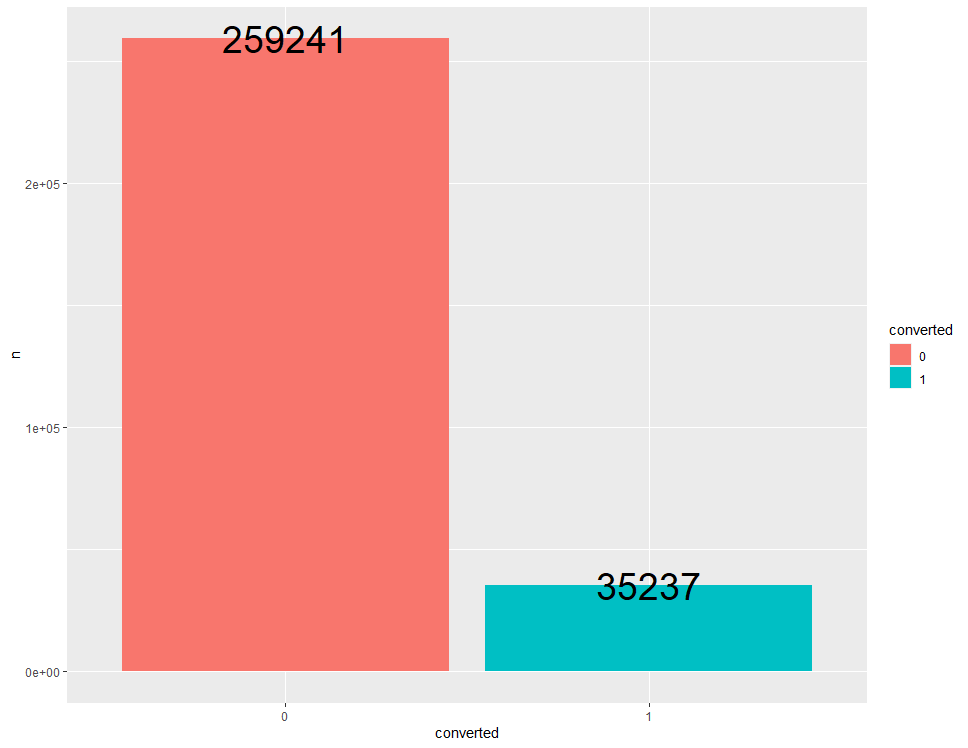
전환하지 않은 사용자(0) 수가 전환한 사용자(1) 수보다 압도적으로 많습니다. 물론 전환율 지표에서는 전환한 사람이 전환하지 않은 사람보다 적을 수 밖에 없습니다만, 이 전환율을 증가시키는 것 또한 중요한 목표라고 볼 수 있을 것입니다.
간단한 EDA를 마친 결과, 총 2개의 A/B test를 고려해볼 수 있을 것 같습니다.
-
control 그룹의 전환율보다 treatment 그룹의 전환율이 더 높을 것이다.
-
old_page 그룹의 전환율보다 new_page 그룹의 전환율이 더 높을 것이다.
treatment 그룹과 new_page 그룹은 기존 버전에 수정을 가한 새로운 버전이기 때문에 대부분 새로운 버전을 통한 전환율의 향상을 기대할 것입니다.
1. control 그룹의 전환율보다 treatment 그룹의 전환율이 더 높을 것이다.
ab %>% group_by(group, converted) %>% count() %>% ggplot(aes(x=group, y=n, fill=converted)) + geom_bar(stat = "identity", position = "dodge") + geom_text(aes(label = n), size = 10)

가설 검정이 이항 분포의 모비율 차이 검정이기 때문에 group과 converted를 변수로 한 table 표를 만들어보겠습니다.
addmargins(table(ab$group, ab$converted), margin = 2) 0 1 Sum control 129479 17723 147202
treatment 129762 17514 147276
전환율이란 각 그룹에서 1(전환한 사용자)이 차지하는 비율이라고 정의할 수 있기 때문에, prop.test() 함수를 사용해 가설검정을 진행하겠습니다.
prop.test(x = c(17723, 17514), n = c(147202, 147276), alter = "less")2-sample test for equality of proportions with continuity correction
data: c(17723, 17514) out of c(147202, 147276)
X-squared = 1.516, df = 1, p-value = 0.8909
alternative hypothesis: less
95 percent confidence interval:
-1.000000000 0.003453955
sample estimates:
prop 1 prop 2
0.1203992 0.1189196
검정 결과 p-value가 0.8909로써 유의수준 0.05보다 매우 크기 때문에 귀무가설을 채택하게 됩니다.
즉, treatment 그룹의 전환율은 control 그룹의 전환율보다 통계적으로 높다고 할 수 없습니다.
2. old_page 그룹의 전환율보다 new_page 그룹의 전환율이 더 높을 것이다.
ab %>% group_by(landing_page, converted) %>% count() %>% ggplot(aes(x=landing_page, y=n, fill=converted)) + geom_bar(stat = "identity", position = "dodge") + geom_text(aes(label = n), size = 10)

역시 마찬가지로 이항 범주의 모비율 차이 검정이기 때문에 landing_page와 converted를 변수로 한 table 표를 만들어보겠습니다.
addmargins(table(ab$landing_page, ab$converted), margin = 2) 0 1 Sum new_page 129741 17498 147239
old_page 129500 17739 147239
모비율 차이 검정을 prop.test() 함수로 수행해보겠습니다. 다만 new_page가 첫 번째 level로 설정되어있기 때문에 성공 횟수와 전체 횟수를 입력할 때 유의해야 합니다.
prop.test(x = c(17739, 17498), n = c(147239, 147239), alter = "less")2-sample test for equality of proportions with continuity correction
data: c(17739, 17498) out of c(147239, 147239)
X-squared = 1.8568, df = 1, p-value = 0.9135
alternative hypothesis: less
95 percent confidence interval:
-1.000000000 0.003611146
sample estimates:
prop 1 prop 2
0.1204776 0.1188408
검정 결과 p-value의 값이 0.9135로써 유의수준 0.05보다 매우 크기 때문에 귀무가설을 채택합니다.
즉, new_page 그룹의 전환율이 old_page 그룹의 전환율에 비해 통계적으로 높다고 할 수 없습니다.
A/B test 결과를 정리하자면 treatment 그룹과 new_page 그룹 모두 기존의 control 그룹과 old_page 그룹에 비해 전환율이 향상되었다고 할 수 없습니다.
따라서 기존의 버전을 유지하거나, 혹은 새로운 수정을 가한 버전을 통해 테스트를 반복해보는 것이 좋을 것 같습니다.
이상으로 A/B test 연습을 마치겠습니다. 감사합니다.