표본 분포란?
통계량의 확률분포이다.
통계량: 표본평균, 표본분산 등
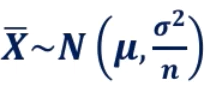
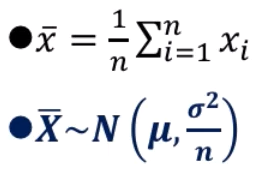
- 모집단이 정규분포를 이룰 때 표본평균은 아래와 같이 구한다. (표본 분포도 정규분포이다.)
- python으로 구하는 법은
import numpy as np
import matplotlib as plt
import random
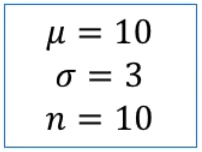
# 평균 10, 분산 3, n의 갯수 10
xbars = [np.mean(np.random.normal(loc=10, scale=3, size=10)) for i in range(10000)]
h=plt.pyplot.hist(xbars, range=(5,15), bins=30)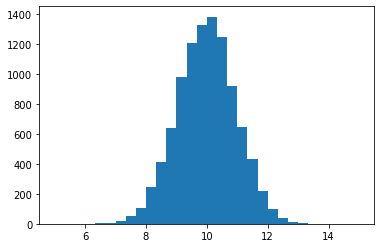
중심극한정리
모집단이 표본분포가 아닐 때 사용할 수 있는 표본 분포
- 표본 평균은 아래와 같이 구한다.
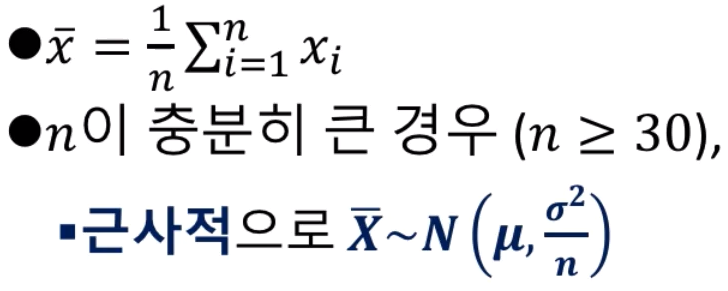
n이 충분히 커지면(30개 이상), 정규분포를 따른다.
python으로 구하는 법
0 ~ 10에서 n개 뽑아 평균을 낸 것의 분포
import random
import numpy as np
import matplotlib as plt

xbars = [np.mean(np.random.rand(n) * 10) for i in range(10000)]
h=plt.pyplot.hist(xbars, range=(0,10), bins=100)- n=1
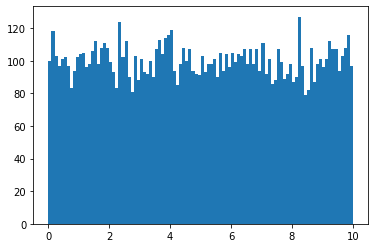
- n=2
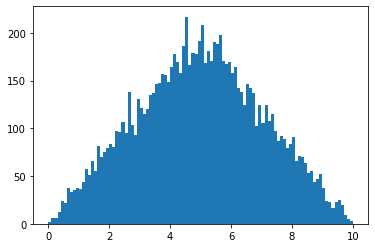
- n=3
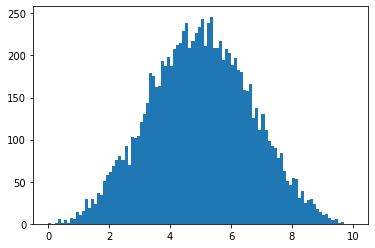
- n=30
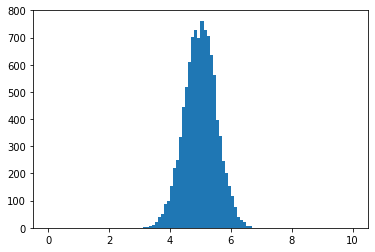
n이 커질수록 정규분포와 가까워진다.
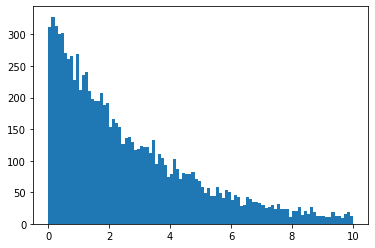
지수분포에서 똑같이 구해보면,
import random
import numpy as np
import matplotlib as plt
n=1
xbars = [np.mean(np.random.exponential(scale=3, size=n)) for i in range(10000)]
print(np.mean(xbars), np.var(xbars))
h=plt.pyplot.hist(xbars, range=(0,10), bins=100)- n=1
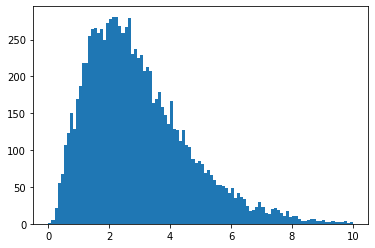
- n=3
- n=30
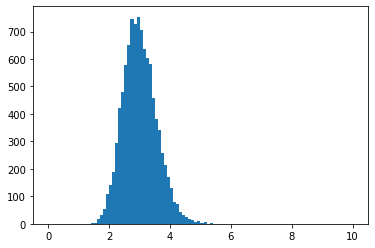
n이 커질수록 정규분포와 가까워진다.

열공하는 개발자입니다~~