product <- read.csv("dataset2/product.csv", header = TRUE)
str(product)
y = product$제품_만족도
x = product$제품_적절성
df <- data.frame(x, y)
result.lm <- lm(formula = y ~ x, data = df)
result.lm
names(result.lm)
fitted.values(result.lm)[1:2]
head(df, 1)
Y = 0.7789 + 0.7393 * 4
Y
residuals(result.lm)[1:2]
-0.7359630 + 3.735963
plot(formula = y ~ x, data = product)
result.lm <- lm(formula = y ~ x, data = product)
abline(result.lm, col = "red")
summary(result.lm)
y = product$제품_만족도
x1 = product$제품_친밀도
x2 = product$제품_적절성
df <- data.frame(x1, x2, y)
result.lm <- lm(formula = y ~x1 + x2, data = df)
result.lm
library(car)
vif(result.lm)
summary(result.lm)
data(iris)
model <- lm(formula = Sepal.Length ~ Sepal.Width +
Petal.Length + Petal.Width, data = iris)
vif(model)
sqrt(vif(model)) > 2
cor(iris[ , -5])
x <-sample(1:nrow(iris), 0.7 * nrow(iris))
train <- iris[x, ]
test <- iris[-x, ]
model <- lm(formula = Sepal.Length ~ Sepal.Width + Petal.Length, data = train)
model
head(train, 1)
Y = 2.3826 + 0.5684 * 2.9 + 0.4576 * 4.6
Y
6.6 - Y
pred <- predict(model, test)
pred
cor(pred, test$Sepal.Length)
formula = Sepal.Length ~ Sepal.Width + Petal.Length + Petal.Width
model <- lm(formula = formula, data = iris)
model
library(lmtest)
dwtest(model)
plot(model, which = 1)
attributes(model)
res <- residuals(model)
shapiro.test(res)
par(mfrow = c(1, 2))
hist(res, freq = F)
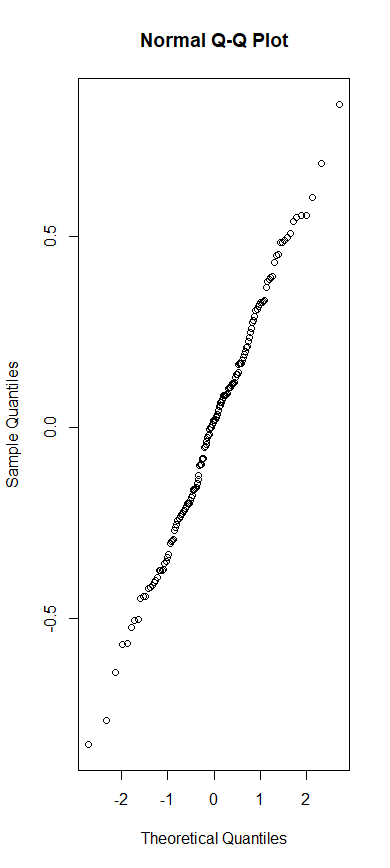
qqnorm(res)
library(car)
sqrt(vif(model)) > 2
formula = Sepal.Length ~ Sepal.Width + Petal.Length
model <- lm(formula = formula, data = iris)
summary(model)