Memory Hierarchy
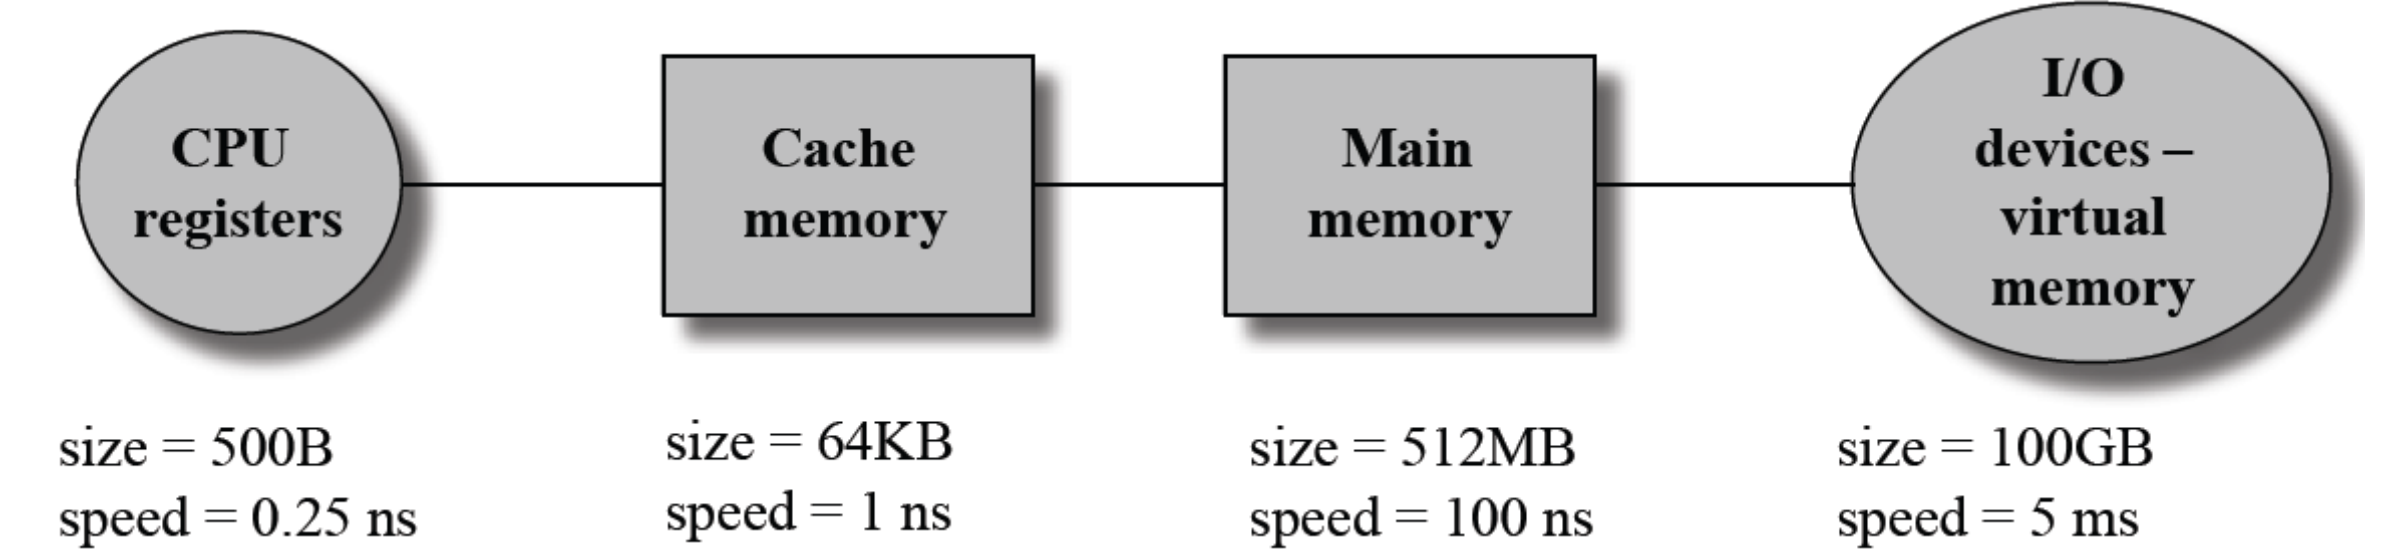
We would like to have a lot of fast memory, but smaller memory units are faster
- Frequently application accesses to data exhibit spatial and temporal locality yielding a small subset that is frequently accessed
Temporal Locality (Locality in Time): If an item is referenced, it will tend to be referenced again soon (e.g., loops, reuse)
Spatial Locality (Locality in Space): If an item is referenced, items whose addresses are close by tend to be referenced soon (e.g., array access)
- Build a hierarchy of memories, each of which has greater capacity than the preceding but is slower
- Smaller memories have subset of data from larger memories
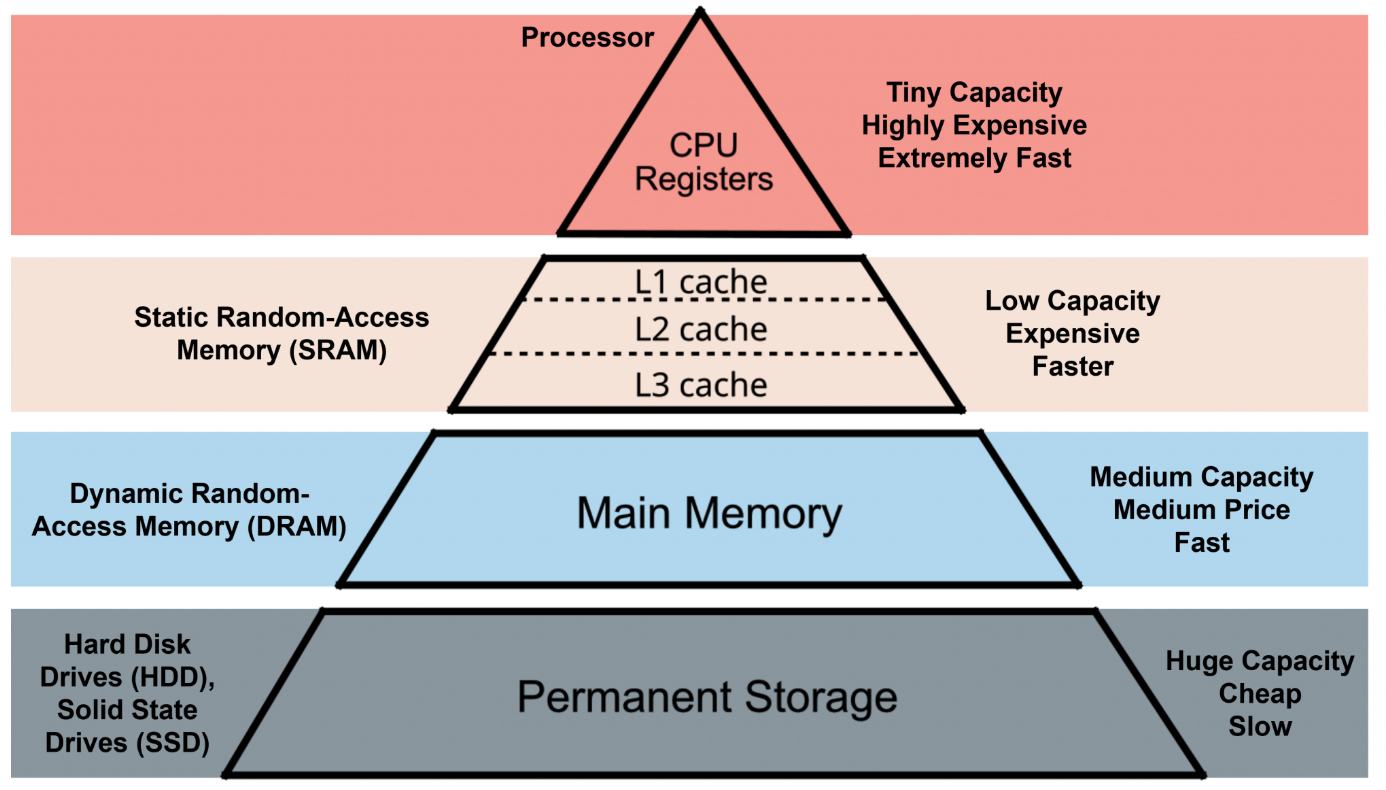
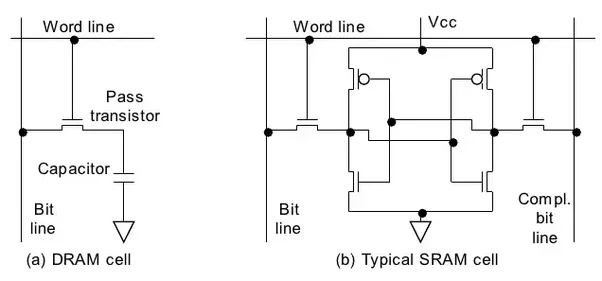
Register is made of SRAM
cache is made of SRAM
Memory is made of DRAM
cache is on chip
memory off chip
Cache Memory
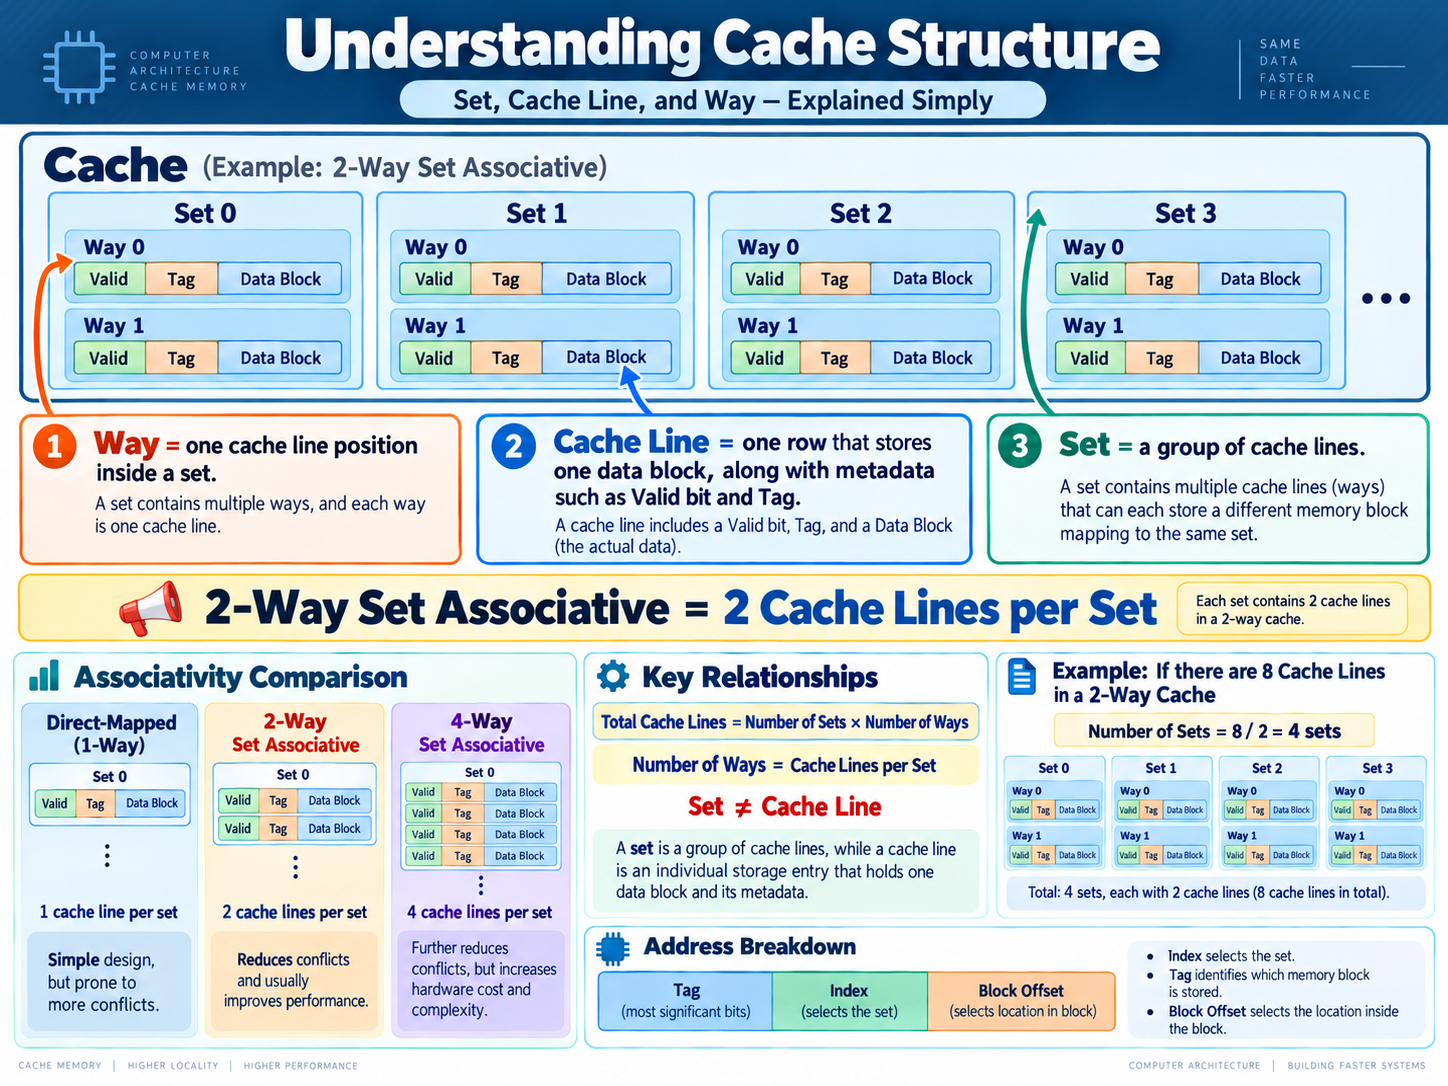
When data is found in the cache we have a cache hit
When data is not found in the cache we have a cache miss
- We will stall CPU
- We will fetch data from the main memory and place it in the cache
- We fetch a fixed-size block of data, called block or line.
- We store this block/line and a part of its main-memory address in cache
- If data is not in the main memory it may be in the virtual memory – stored on the disk
- The main memory and the virtual memory have the same relationship as the cache and the main memory. The fixedsize block of data is called page.
Hit time << Miss penalty (time to handle the miss)
CPU Time with Cache
The key idea of this slide is: when the CPU misses in the cache, it has to wait for memory, so extra clock cycles must be added.
1. Why does the equation change?
Normally,
is the total number of CPU cycles.
But suppose the processor expects an instruction to take 1 cycle, and then a cache miss happens. The CPU may have to wait another 50 or 100 cycles for data from a lower-level cache or memory.
Those extra cycles are called memory stall cycles.
So:
2. Where do Memory Stall Cycles come from?
The slide says:
This is intuitive.
100×20=2000 extra cycles.
So:
3. But how do we know the number of misses?
We normally aren't directly given "# misses."
Instead, we're given a miss rate.
For example:
Cache miss rate = 5%
means
So:
#Misses=10,000×0.05=500
4. What is "Miss rate per instruction"?
This is the slightly confusing part of the slide.
We know:
But for CPU performance, it is often more convenient to know:
So we convert it.
The slide writes:
Look at how the units cancel:
giving:
Therefore,
Therefore,
That's really what the middle of the slide is trying to explain.
5. What does "% Memory References" mean?
Suppose 30% of the instructions are load/store instructions that access data memory.
Then:
For example, with
and 30% memory-reference instructions:
So on this slide,
essentially means memory references per instruction.
For example:
30%=0.30
6. Now combine everything
We had:
And
Therefore:
That's the big equation at the bottom of your slide.
7. A concrete example
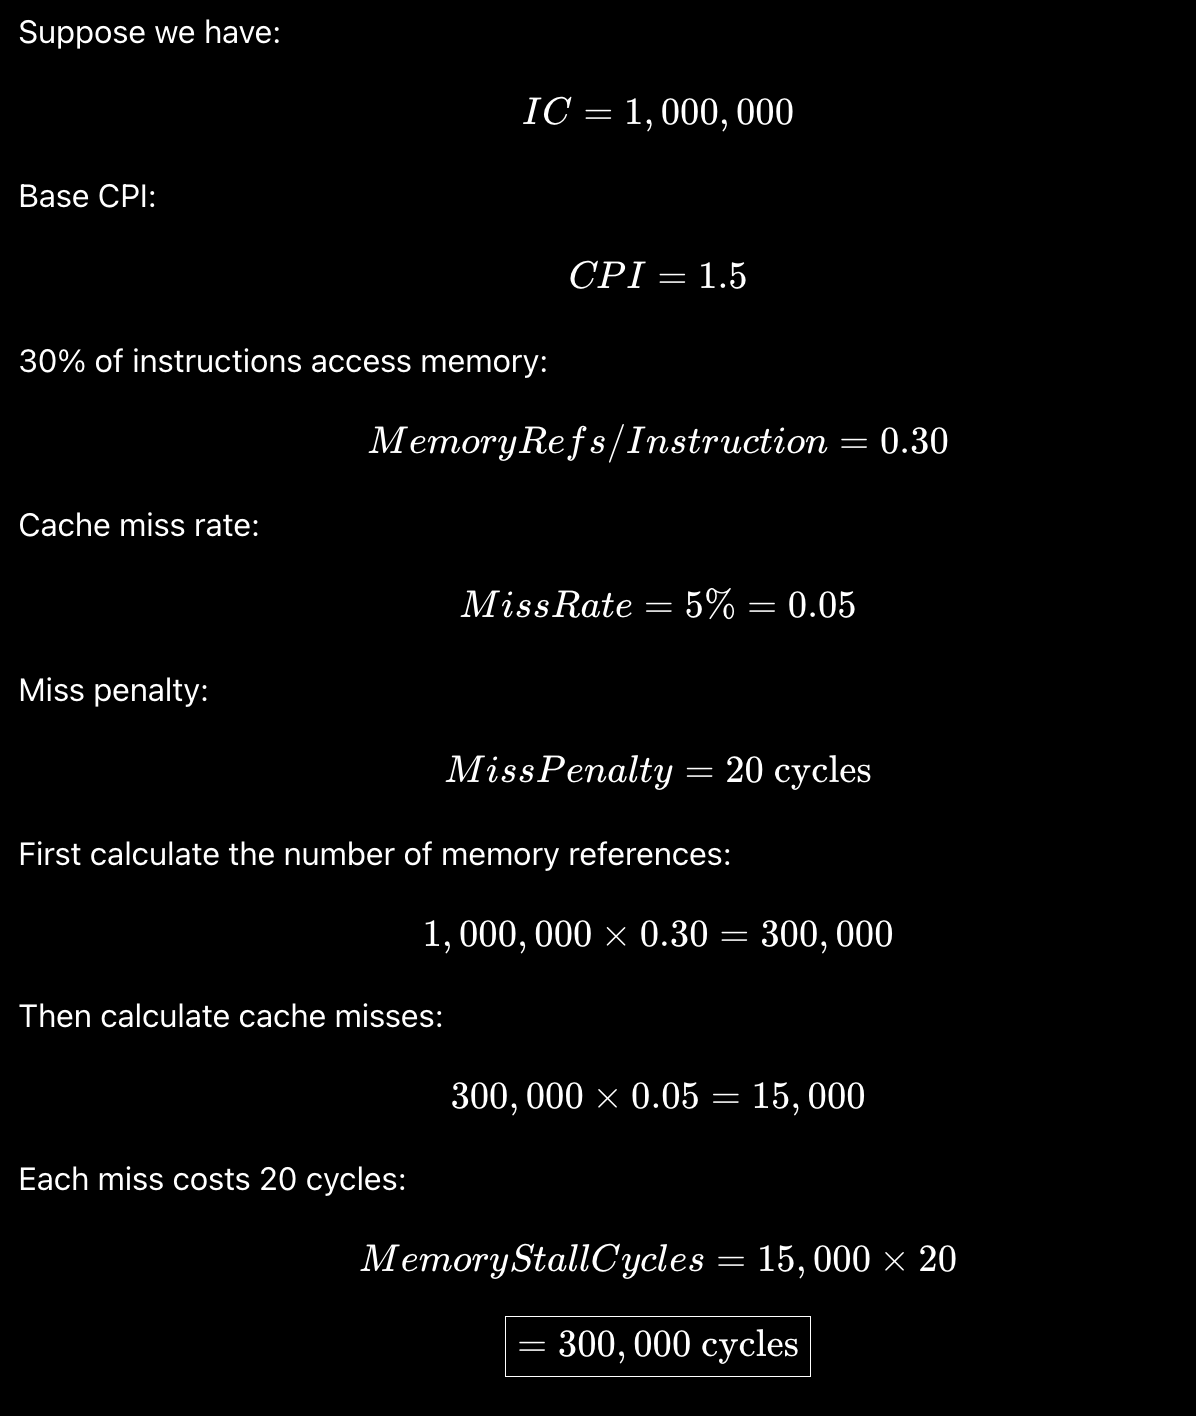
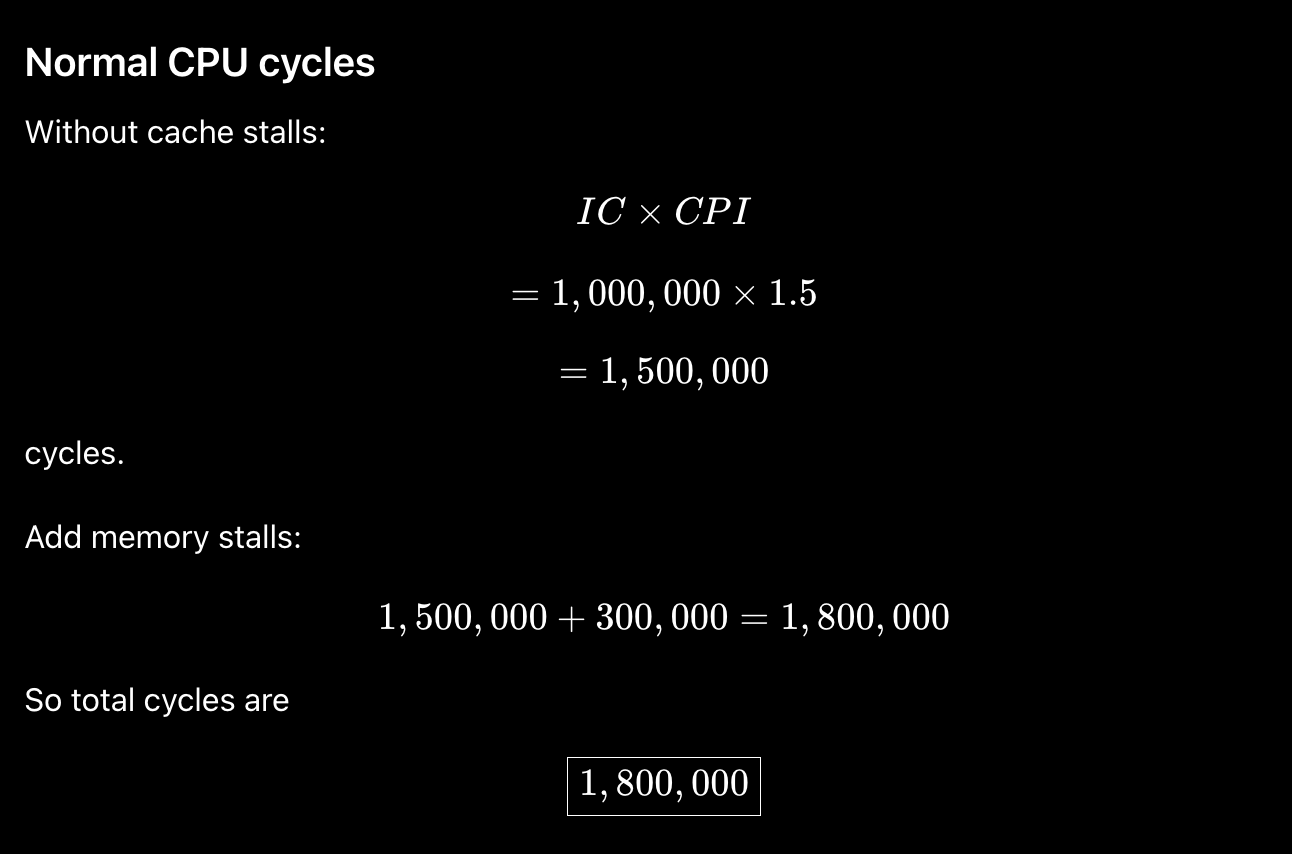
Example
We have a computer with CPI=1 when all memory accesses hit in cache. The only data accesses are loads and stores and these total 50% of the instructions. If the miss penalty is 25 clock cycles and the miss rate per reference is 2%
– how much faster would the computer be if all instructions resulted in a cache hit.
– What if the miss rate is 30 misses per 1000
instructions?
When talking about miss_rate, we usually mean miss_rate_per_reference