
1. 이안류 CCTV 데이터셋
- 우리나라 주요 해수욕장(해운대, 송정, 대천, 중문, 낙산)에서 이안류 발생 여부와 위치를 모니터링하기 위해 구축된 인공지능 학습용 데이터셋이다.
- 해수욕장 주변에 설치된 CCTV 영상을 이미지로 변환하여, 이안류 발생 여부와 위치를 가시화하는 모델 개발에 활용할 수 있다.
- 이안류 탐지 및 예측 시스템 개발에 필수적인 자료를 제공하며, 해수욕객의 안전을 위한 응용 서비스 구성에 활용될 수 있다.
"이안류"란?
이안류는 해안에서 먼 바다로 빠르게 이동하는 폭이 좁은 바닷물의 흐름으로,
기상 상태가 양호한 경우에도 나타나며, 얕은 곳에 있던 해수욕객을 순식간에 수심이 깊은 먼 바다로 이동시켜 인명사고를 유발할 수 있다.
!unzip -q /content/ripcurrent.zip!pip install ultralytics opencv-pythonimport os
import random
import shutil
import cv2
import glob
import json
import yaml
import ultralytics
import matplotlib.pyplot as plt
from torchvision import transforms
from tqdm import tqdm
from ultralytics import YOLO
from ultralytics.utils.plotting import Annotatorultralytics.checks()data_root = '/content'
file_root = f'{data_root}/Sample'
train_root = f'{data_root}/train'
valid_root = f'{data_root}/valid'
test_root = f'{data_root}/test'
for folder in [train_root, valid_root, test_root]:
if not os.path.exists(folder):
os.makedirs(folder)
for s in ['images', 'labels']:
s_folder = f'{folder}/{s}'
if not os.path.exists(s_folder):
os.makedirs(s_folder)file_list = glob.glob(f'{file_root}/02.라벨링데이터/*.json')
file_listdef json_to_yolo_bbox(bbox, w, h):
x_center = ((bbox[0][0] + bbox[1][0]) / 2) / w
y_center = ((bbox[0][1] + bbox[3][1]) / 2) / h
width = (bbox[1][0] - bbox[0][0]) / w
height = (bbox[3][1] - bbox[0][1]) / h
return [x_center, y_center, width, height]bbox 좌표 구조
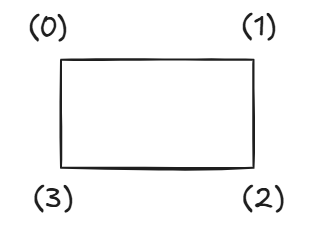
bbox = [
    [x0, y0],  # 0: 왼쪽 위 (top-left)
    [x1, y1],  # 1: 오른쪽 위 (top-right)
    [x2, y2],  # 2: 오른쪽 아래 (bottom-right)
    [x3, y3]   # 3: 왼쪽 아래 (bottom-left)
]
ex)
bbox[3] → 왼쪽 아래 점
[1] → y좌표
bbox[0] → 왼쪽 위 점
[0] → x좌표
file = file_list[156]
print(file)
# Bounding Box 형태를 YOLO 포멧으로 변환하기
result = set()
with open(file, 'r') as f:
json_data = json.load(f)
width, height = list(map(int, json_data['image_info']['resolution'].split(',')))
cls = 1
if json_data['annotations'].get('drawing'):
for b in json_data['annotations']['drawing']:
yolo_bbox = json_to_yolo_bbox(b, width, height)
print(yolo_bbox)
bbox_string = ' '.join([str(x) for x in yolo_bbox])
result.add(f'{cls} {bbox_string}')result = list(result)
resultif result:
with open(file.replace('json', 'txt'), 'w', encoding='utf-8') as t:
t.write('\n'.join(result))
print(file)for file in tqdm(file_list):
result = set()
with open(file, 'r') as f:
json_data = json.load(f)
width, height = list(map(int, json_data['image_info']['resolution'].split(',')))
cls = 0
num_b = json_data['annotations']['bounding_count']
if num_b > 0:
for b in json_data['annotations']['drawing']:
yolo_bbox = json_to_yolo_bbox(b, width, height)
bbox_string = ' '.join([str(x) for x in yolo_bbox])
result.add(f'{cls} {bbox_string}')
result = list(result)
if result:
with open(file.replace('json', 'txt'), 'w', encoding='utf-8') as t:
t.write('\n'.join(result))random.seed(2025)
file_list = glob.glob(f'{file_root}/02.라벨링데이터/*.txt')
random.shuffle(file_list)
test_ratio = 0.1
num_file = len(file_list)
num_filetest_list = file_list[:int(num_file * test_ratio)]
valid_list = file_list[int(num_file * test_ratio):int(num_file * test_ratio)*2]
train_list = file_list[int(num_file * test_ratio)*2:]for i in tqdm(test_list):
txt_name = i.split('/')[-1]
shutil.copyfile(i, f'{test_root}/labels/{txt_name}')
img_path = i.replace('02.라벨링데이터', '01.원천데이터').replace('txt', 'jpg')
img_name = img_path.split('/')[-1]
shutil.copyfile(img_path, f'{test_root}/images/{img_name}')for i in tqdm(valid_list):
txt_name = i.split('/')[-1]
shutil.copyfile(i, f'{valid_root}/labels/{txt_name}')
img_path = i.replace('02.라벨링데이터', '01.원천데이터').replace('txt', 'jpg')
img_name = img_path.split('/')[-1]
shutil.copyfile(img_path, f'{valid_root}/images/{img_name}')for i in tqdm(train_list):
txt_name = i.split('/')[-1]
shutil.copyfile(i, f'{train_root}/labels/{txt_name}')
img_path = i.replace('02.라벨링데이터', '01.원천데이터').replace('txt', 'jpg')
img_name = img_path.split('/')[-1]
shutil.copyfile(img_path, f'{train_root}/images/{img_name}')import yaml
data = dict()
data['train'] = train_root
data['val'] = valid_root
data['test'] = test_root
data['nc'] = 1 # nc = number of classes → 클래스(라벨)의 개수
data['names'] = ['yes'] # names = 클래스 이름 목록
with open(f'ripcurrent.yaml', 'w') as f:
yaml.dump(data, f)# 모델 불러오기 & 학습 Setting하기
model = YOLO('yolov8s.pt')
results = model.train(
data='ripcurrent.yaml', # 데이터셋 설정 파일 경로
epochs=10, # 학습 반복 횟수
batch=8, # 배치 크기
imgsz=224, # 입력 이미지 크기 (224x224로 resize)
device=0, # GPU 장치 번호 (0 → 첫 번째 GPU 사용)
workers=2, # 데이터 로딩에 사용할 CPU worker 수
amp=False, # Mixed Precision 학습 비활성화
patience=30, # 성능 향상이 없을 때 조기 종료 patience
name='rip_s' # 결과 저장 폴더 이름
)result_folder = f'runs/detect/rip_s'model = YOLO(f'{result_folder}/weights/best.pt')
metrics = model.val(split='test')
print(metrics.box.map)
print(metrics.box.map50)test_root = f'{data_root}/test'
test_file_list = glob.glob(f'{test_root}/images/*')
random.shuffle(test_file_list)
test_file_listmodel = YOLO(f'{result_folder}/weights/best.pt')
test_data_transform = transforms.Compose([transforms.ToTensor()])
color_dict = [(0, 0, 255)]test_img = cv2.imread(test_file_list[0])
img_src = cv2.cvtColor(test_img, cv2.COLOR_BGR2RGB)
results = model(img_src)results[0].boxestest_img = cv2.imread(test_file_list[0])
img_src = cv2.cvtColor(test_img, cv2.COLOR_BGR2RGB)
results = model(img_src)[0]annotator = Annotator(img_src)
boxes = results.boxes
boxesfor box in boxes:
b = box.xyxy[0]
cls = box.cls
# [x_min, y_min, x_max, y_max]
annotator.box_label(b, model.names[int(cls)], color_dict[int(cls)])
img_src = annotator.result()
plt.imshow(img_src)
plt.show()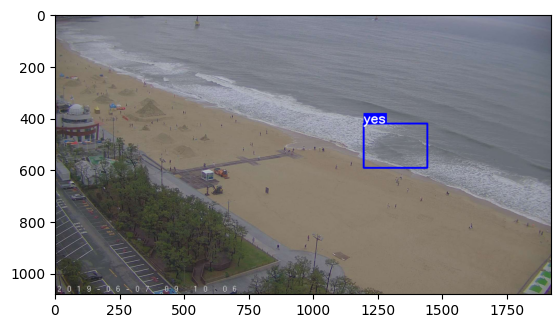
plt.figure(figsize = (12,6))
for idx in range(6):
    test_img = cv2.imread(test_file_list[idx])
    img_src = cv2.cvtColor(test_img, cv2.COLOR_BGR2RGB)
    results = model(test_img)

    for result in results:
        annotator = Annotator(img_src)
        boxes = result.boxes
        for box in boxes:
            b = box.xyxy[0]  # get box coordinates in (top, left, bottom, right) format
            cls = box.cls
            annotator.box_label(b, model.names[int(cls)], color_dict[int(cls)])
    img_src = annotator.result()

    plt.subplot(2, 3, (idx+1))
    plt.imshow(img_src)
plt.show()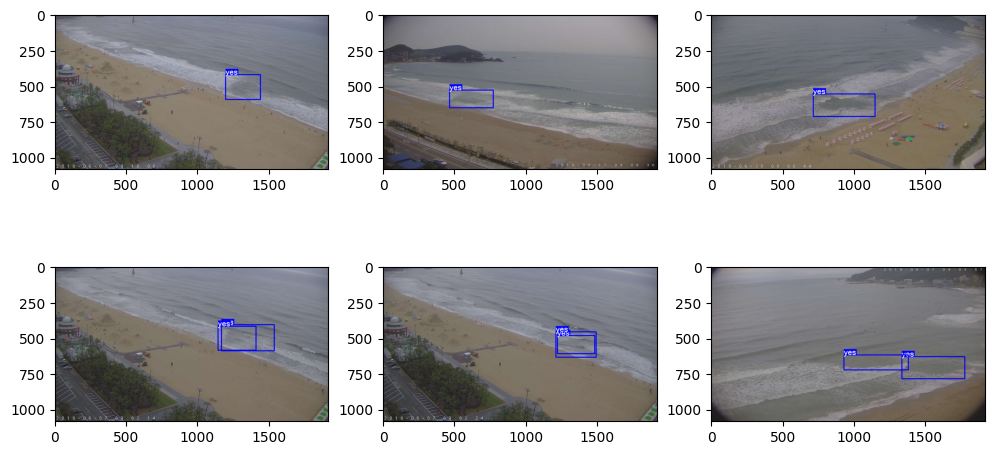

The light shines in the darkness.