
Decision Tree Classifier로 iris.data 결정나무 만들기
- iris.data 결정나무
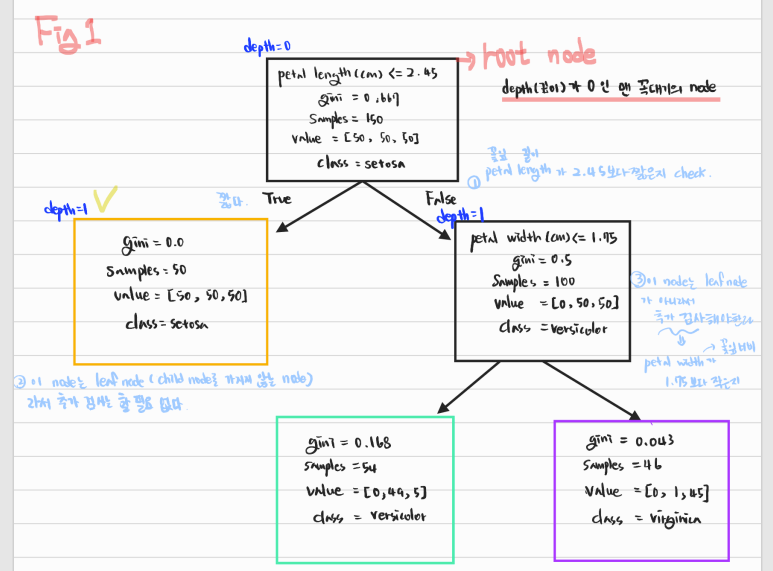
- 그림에서 노란색 체크된 노드 value 잘못 씀 ([50, 0, 0]
-
node의 samples 속성
- 100개의 sample은 petal length가 2.45보다 긺(오른쪽, False)
- 그 중 54개는 petal width가 1.75보다 짧다 (왼쪽, True)
-
node의 value 속성
- 각 class의 몇 개의 Training sample이 있는지 알려줌 ([setosa 수, versicolor 수, verginica 수])
-
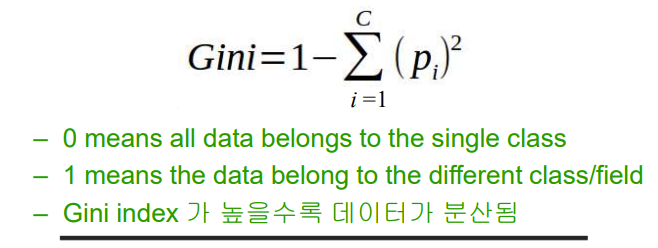
node의 gini 속성
- impurity(불순도)를 측정함
- 한 노드에서 모든 sample들이 같은 class에 속해 있으면 순수한 것 (gini = 0)
from sklearn.datasets import load_iris
from sklearn.tree import DecisionTreeClassifier

iris = load_iris()
X = iris.data[:, 2:] # 꽃잎 길이와 너비, 즉 'petal length (cm)', 'petal width (cm)'
y = iris.target

tree_clf = DecisionTreeClassifier(max_depth=2, random_state=42)
tree_clf.fit(X, y)
시각화 해보기
- iris_tree.dot 파일 준비
digraph Tree {
node [shape=box, style="filled, rounded", color="black", fontname=helvetica] ;
edge [fontname=helvetica] ;
0 [label="petal length (cm) <= 2.45\ngini = 0.667\nsamples = 150\nvalue = [50, 50, 50]\nclass = setosa", fillcolor="#ffffff"] ;
1 [label="gini = 0.0\nsamples = 50\nvalue = [50, 0, 0]\nclass = setosa", fillcolor="#e58139"] ;
0 -> 1 [labeldistance=2.5, labelangle=45, headlabel="True"] ;
2 [label="petal width (cm) <= 1.75\ngini = 0.5\nsamples = 100\nvalue = [0, 50, 50]\nclass = versicolor", fillcolor="#ffffff"] ;
0 -> 2 [labeldistance=2.5, labelangle=-45, headlabel="False"] ;
3 [label="gini = 0.168\nsamples = 54\nvalue = [0, 49, 5]\nclass = versicolor", fillcolor="#4de88e"] ;
2 -> 3 ;
4 [label="gini = 0.043\nsamples = 46\nvalue = [0, 1, 45]\nclass = virginica", fillcolor="#843de6"] ;
2 -> 4 ;
}- graphviz 이용해서 decision tree 시각화
from sklearn.tree import export_graphviz

export_graphviz(
        tree_clf,
        out_file=os.path.join(IMAGES_PATH, "iris_tree.dot"),
        feature_names=iris.feature_names[2:],
        class_names=iris.target_names,
        rounded=True,
        filled=True
    )

from graphviz import Source

Source.from_file(os.path.join(IMAGES_PATH, "iris_tree.dot"))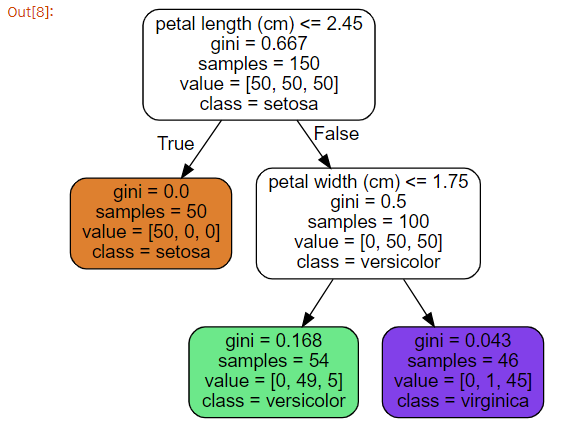
-
CART 알고리즘 사용해서 Petal length를 x축, Petal width를 y축으로 하고 트리의 깊이별로 바운더리를 그은 그래프 시각화
- CART 알고리즘 : 바운더리를 그어보고, 그 그은 곳에서 지니 불순도(Gi)를 구해서 값이 작게 나오는 곳으로 바운더리 설정하기
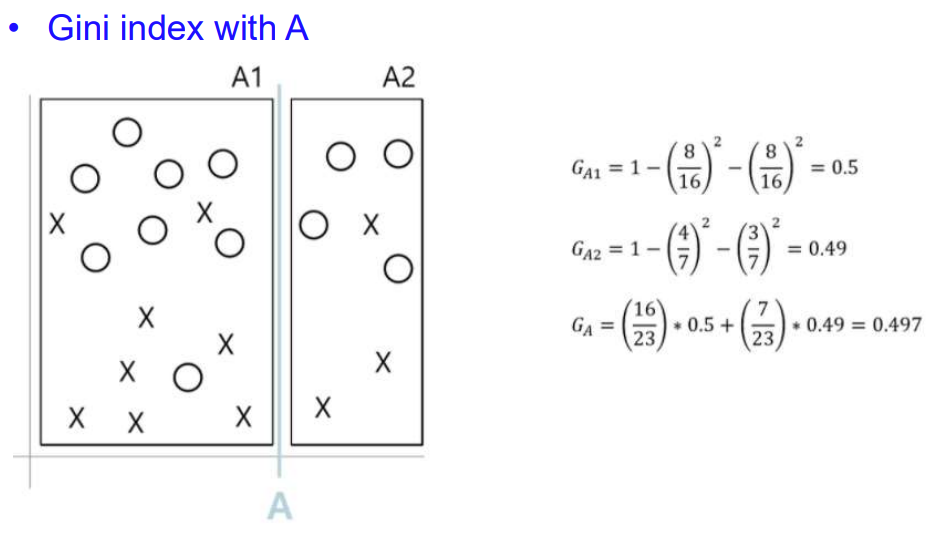

- 위 그림 두개를 보면, 한 노드에서 특정 class에만 sample들이 있으면 p(i,k)가 1이니까 gini impurity가 1-1해서 0나오지? 이 때 분류가 잘된 거니까 지니 불순도가 작은게 좋은거고, 그래서 바운더리 설정도 지니 불순도가 작은 곳으로 잡는거야!
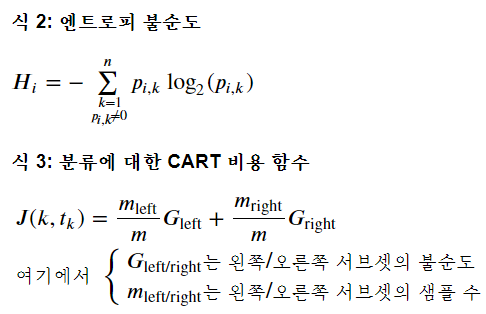
- CART 알고리즘 : 바운더리를 그어보고, 그 그은 곳에서 지니 불순도(Gi)를 구해서 값이 작게 나오는 곳으로 바운더리 설정하기
from matplotlib.colors import ListedColormap

def plot_decision_boundary(clf, X, y, axes=[0, 7.5, 0, 3], iris=True, legend=False, plot_training=True):
    x1s = np.linspace(axes[0], axes[1], 100)
    x2s = np.linspace(axes[2], axes[3], 100)
    x1, x2 = np.meshgrid(x1s, x2s)
    X_new = np.c_[x1.ravel(), x2.ravel()]
    y_pred = clf.predict(X_new).reshape(x1.shape)
    custom_cmap = ListedColormap(['#fafab0','#9898ff','#a0faa0'])
    plt.contourf(x1, x2, y_pred, alpha=0.3, cmap=custom_cmap)
    if not iris:
        custom_cmap2 = ListedColormap(['#7d7d58','#4c4c7f','#507d50'])
        plt.contour(x1, x2, y_pred, cmap=custom_cmap2, alpha=0.8)
    if plot_training:
        plt.plot(X[:, 0][y==0], X[:, 1][y==0], "yo", label="Iris setosa")
        plt.plot(X[:, 0][y==1], X[:, 1][y==1], "bs", label="Iris versicolor")
        plt.plot(X[:, 0][y==2], X[:, 1][y==2], "g^", label="Iris virginica")
        plt.axis(axes)
    if iris:
        plt.xlabel("Petal length", fontsize=14)
        plt.ylabel("Petal width", fontsize=14)
    else:
        plt.xlabel(r"$x_1$", fontsize=18)
        plt.ylabel(r"$x_2$", fontsize=18, rotation=0)
    if legend:
        plt.legend(loc="lower right", fontsize=14)

plt.figure(figsize=(8, 4))
plot_decision_boundary(tree_clf, X, y)
plt.plot([2.45, 2.45], [0, 3], "k-", linewidth=2)
plt.plot([2.45, 7.5], [1.75, 1.75], "k--", linewidth=2)
plt.plot([4.95, 4.95], [0, 1.75], "k:", linewidth=2)
plt.plot([4.85, 4.85], [1.75, 3], "k:", linewidth=2)
plt.text(1.40, 1.0, "Depth=0", fontsize=15)
plt.text(3.2, 1.80, "Depth=1", fontsize=13)
plt.text(4.05, 0.5, "(Depth=2)", fontsize=11)

save_fig("decision_tree_decision_boundaries_plot")
plt.show()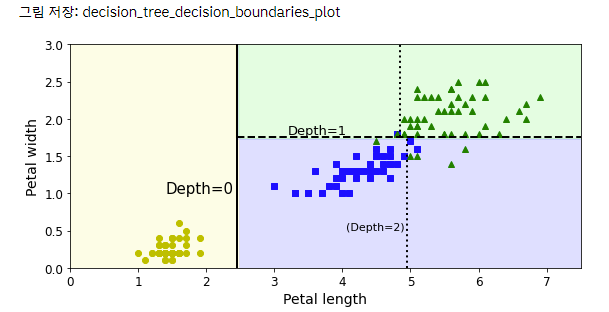
클래스와 클래스 확률 예측하기
tree_clf.predict_proba([[5, 1.5]])# predict_proba(어떤값)는 인자로 받는 어떤값에다가 우리의 훈련된 모델을 적합시켜 확률이 계산된다.

#petal length (cm)= 5 , petal width (cm)=1.5 
tree_clf.predict([[5, 1.5]]) #predict(X) : predict는 Predict class labels for samples in X, 즉 input 넣어주면 해당되는 output을 출력
불안정성 & 훈련세트에 민감함
np.random.seed(6)
Xs = np.random.rand(100, 2) - 0.5
ys = (Xs[:, 0] > 0).astype(np.float32) * 2

angle = np.pi / 4
rotation_matrix = np.array([[np.cos(angle), -np.sin(angle)], [np.sin(angle), np.cos(angle)]])
Xsr = Xs.dot(rotation_matrix)

tree_clf_s = DecisionTreeClassifier(random_state=42)
tree_clf_s.fit(Xs, ys)
tree_clf_sr = DecisionTreeClassifier(random_state=42)
tree_clf_sr.fit(Xsr, ys)

fig, axes = plt.subplots(ncols=2, figsize=(10, 4), sharey=True)
plt.sca(axes[0])
plot_decision_boundary(tree_clf_s, Xs, ys, axes=[-0.7, 0.7, -0.7, 0.7], iris=False)
plt.sca(axes[1])
plot_decision_boundary(tree_clf_sr, Xsr, ys, axes=[-0.7, 0.7, -0.7, 0.7], iris=False)
plt.ylabel("")

save_fig("sensitivity_to_rotation_plot")
plt.show()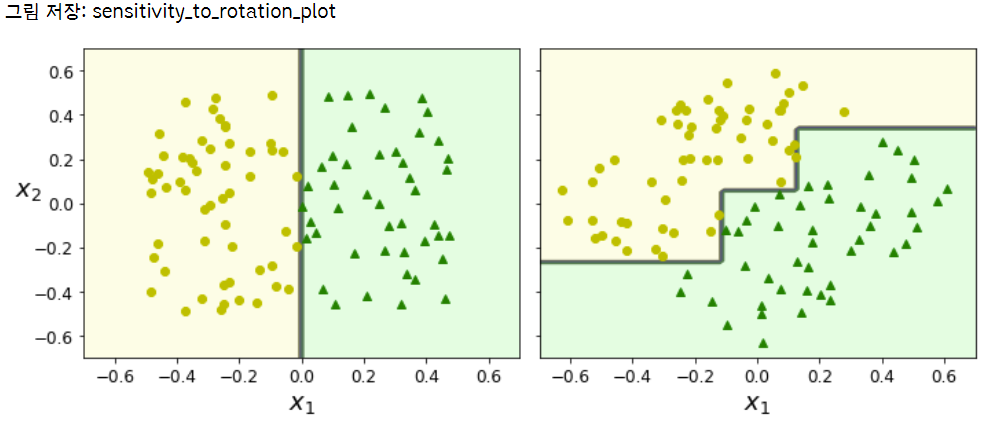
angle = np.pi / 180 * 20 # 0.3490658503988659
rotation_matrix = np.array([[np.cos(angle), -np.sin(angle)], [np.sin(angle), np.cos(angle)]])
Xr = X.dot(rotation_matrix)

tree_clf_r = DecisionTreeClassifier(random_state=42)
tree_clf_r.fit(Xr, y)

plt.figure(figsize=(8, 3))
plot_decision_boundary(tree_clf_r, Xr, y, axes=[0.5, 7.5, -1.0, 1], iris=False)

plt.show()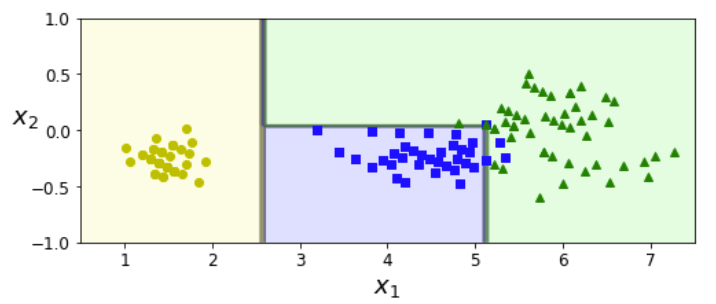
X[(X[:, 1]==X[:, 1][y==1].max()) & (y==1)] # widest Iris versicolor flower
(X[:, 1]==X[:, 1][y==1].max())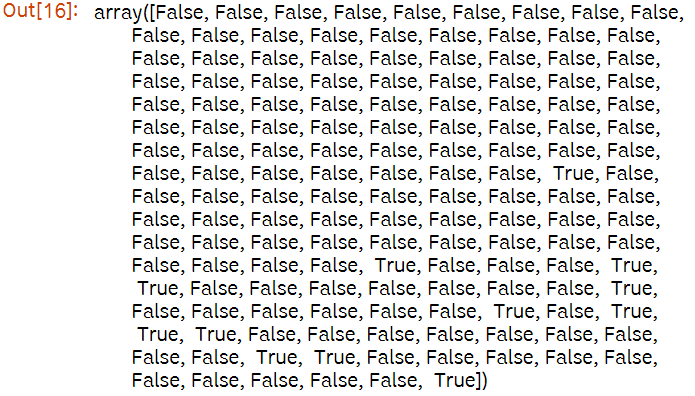
not_widest_versicolor = (X[:, 1]!=1.8) | (y==2)
X_tweaked = X[not_widest_versicolor]
y_tweaked = y[not_widest_versicolor]

tree_clf_tweaked = DecisionTreeClassifier(max_depth=2, random_state=40)
tree_clf_tweaked.fit(X_tweaked, y_tweaked)
plt.figure(figsize=(8, 4))
plot_decision_boundary(tree_clf_tweaked, X_tweaked, y_tweaked, legend=False)
plt.plot([0, 7.5], [0.8, 0.8], "k-", linewidth=2)
plt.plot([0, 7.5], [1.75, 1.75], "k--", linewidth=2)
plt.text(1.0, 0.9, "Depth=0", fontsize=15)
plt.text(1.0, 1.80, "Depth=1", fontsize=13)

save_fig("decision_tree_instability_plot")
plt.show()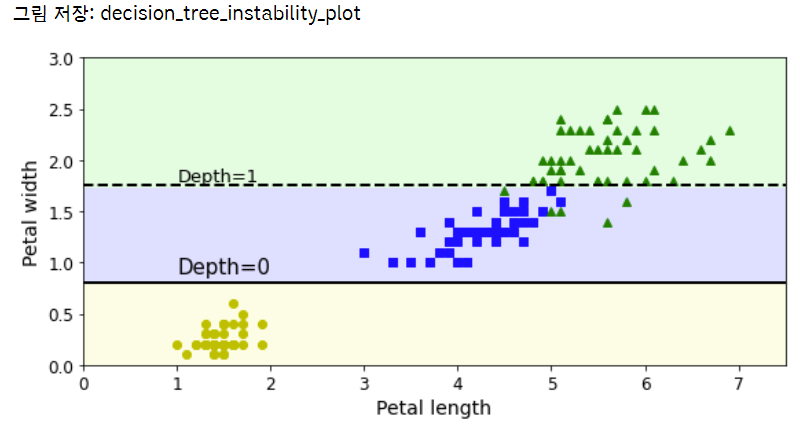
Decision Tree Classifier 규제 매개변수

createrion: {gini, entropy}가 있음. 기본은 gini
min_samples_leaf: 리프 노드가 가지고 있어야 할 최소 샘플 수
min_samples_split: 분할되기 위해 노드가 가져야 하는 최소 샘플 수
min_weight_fraction_leaf: min_samples_leaf와 같지만 가중치가 부여된 전체 샘플 수에서의 비율
max_leaf_nodes: 리프 노드의 최대 수
max_features: 각 노드에서 분할에 사용할 특성의 최대 수
- min 으로 시작하는 매개변수를 증가시키거나 max 로 시작하는 매개변수를 감소시키면 모델에 규제가 커집니다.
from sklearn.datasets import make_moons
Xm, ym = make_moons(n_samples=100, noise=0.25, random_state=53)

deep_tree_clf1 = DecisionTreeClassifier(random_state=42)
deep_tree_clf2 = DecisionTreeClassifier(min_samples_leaf=4, random_state=42) # min_samples_leaf = 분할되기 위해 노드가 가져야 하는 최소 샘플 수
deep_tree_clf1.fit(Xm, ym)
deep_tree_clf2.fit(Xm, ym)

fig, axes = plt.subplots(ncols=2, figsize=(10, 4), sharey=True)
plt.sca(axes[0])
plot_decision_boundary(deep_tree_clf1, Xm, ym, axes=[-1.5, 2.4, -1, 1.5], iris=False)
plt.title("No restrictions", fontsize=16)
plt.sca(axes[1])
plot_decision_boundary(deep_tree_clf2, Xm, ym, axes=[-1.5, 2.4, -1, 1.5], iris=False)
plt.title("min_samples_leaf = {}".format(deep_tree_clf2.min_samples_leaf), fontsize=14)
plt.ylabel("")

save_fig("min_samples_leaf_plot")
plt.show()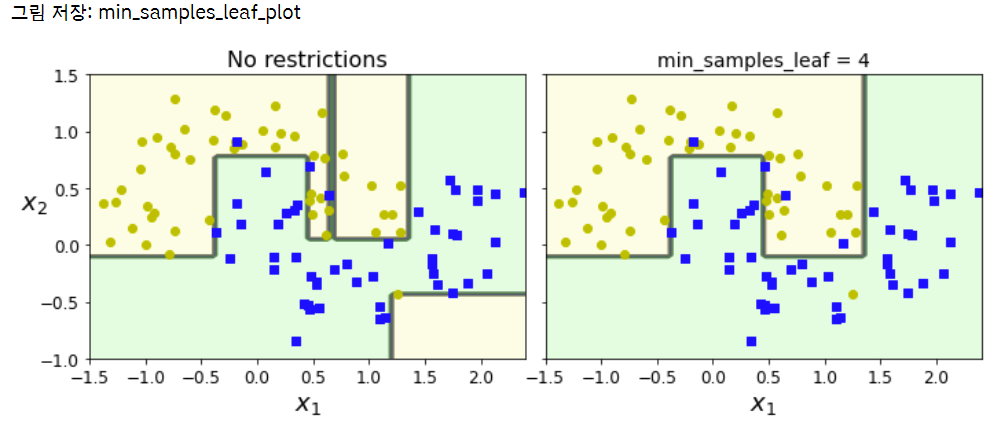
- 오른쪽 모델이 일반화 성능 좋음
