Elasticsearch는 외부와 통신할 때 HTTP 프로토콜을 기반으로 통신
Logstash 파이프라인 상태 확인
ps -ef | grep logstash
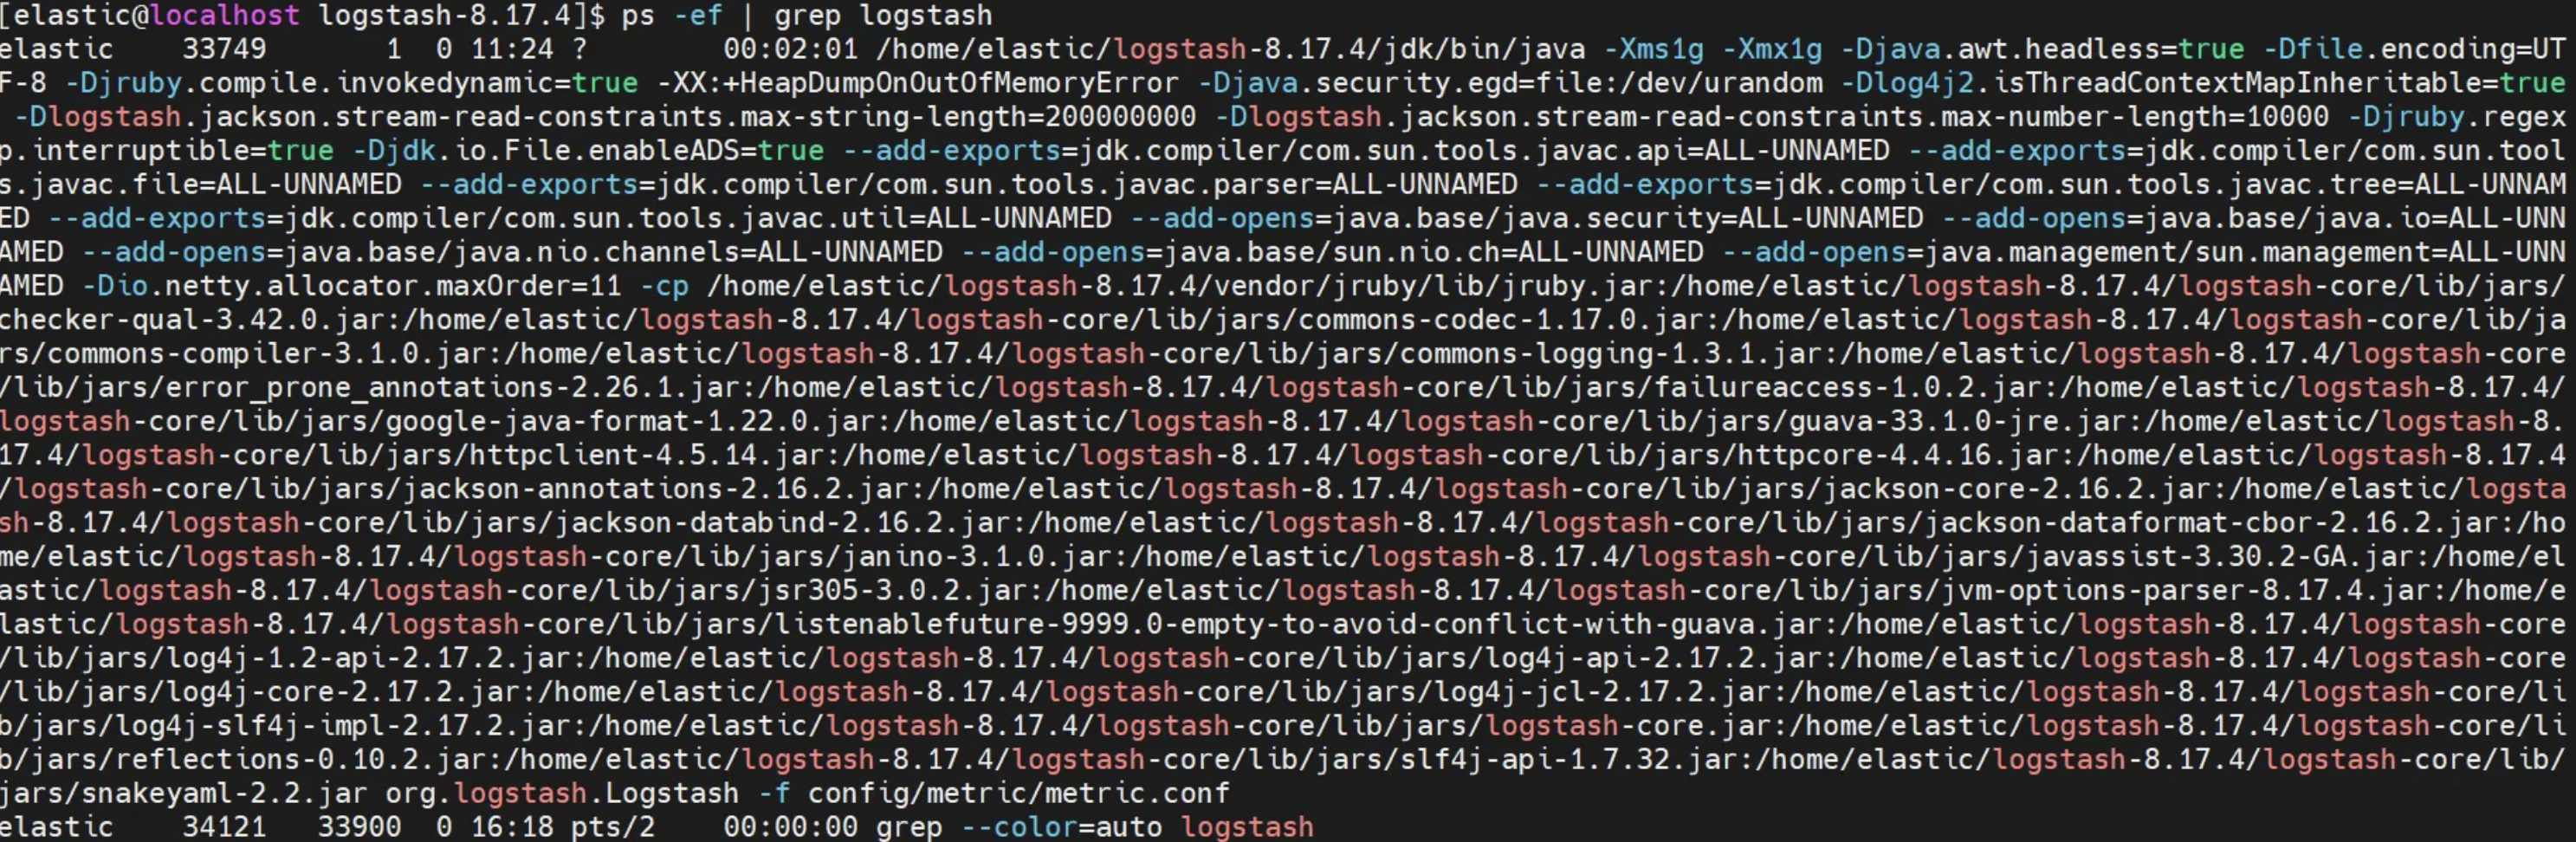
ss -nltp | grep 5044

curl -XGET "http://localhost:9600/_node/pipelines?pretty"
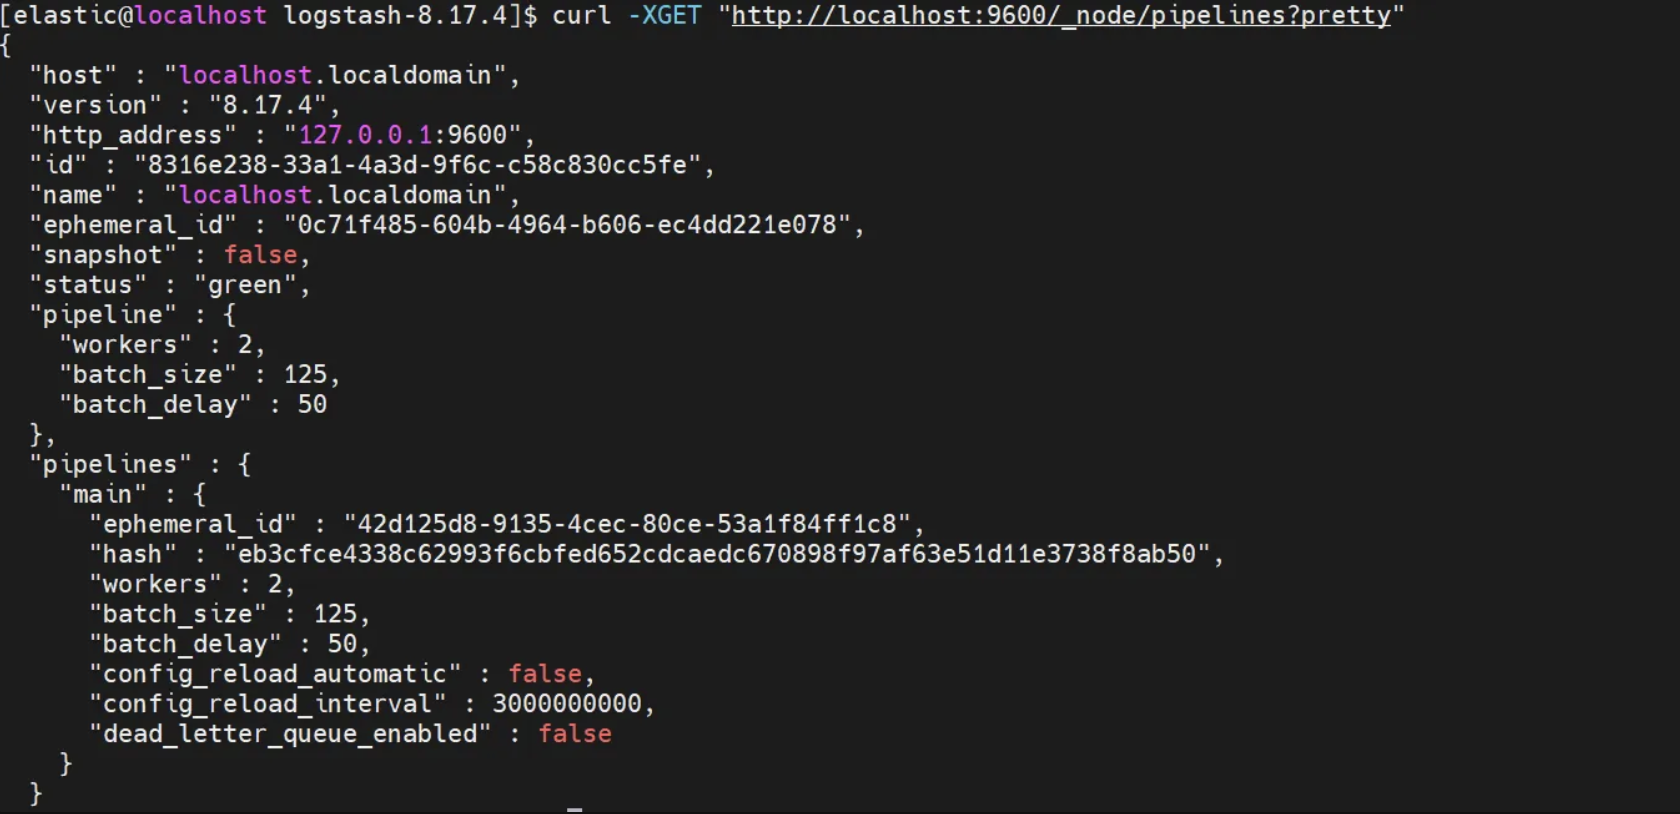
- logstash에 있는 실행된 conf 파일하나(bin/logstash -f config/metric/metric.conf)
Kibana 상태 확인
ps -ef | grep node

- PID 34463 으로 kibana 실행중
- logstash와 다르게 grep node로 해줘야함!!
ss -nltp | grep 5601

curl -H 'Connection: close' --connect-timeout 5 "http://192.XXX.XXX.159:5601/status?pretty" -I -u elastic:elastic
- 잘 사용 안함(kibana를 굳이 귀찮게 curl 돌리지 않고 ui로 확인 가능. http 접속이 훨씬빠름)
수집 데이터 curl 쿼리로 조회
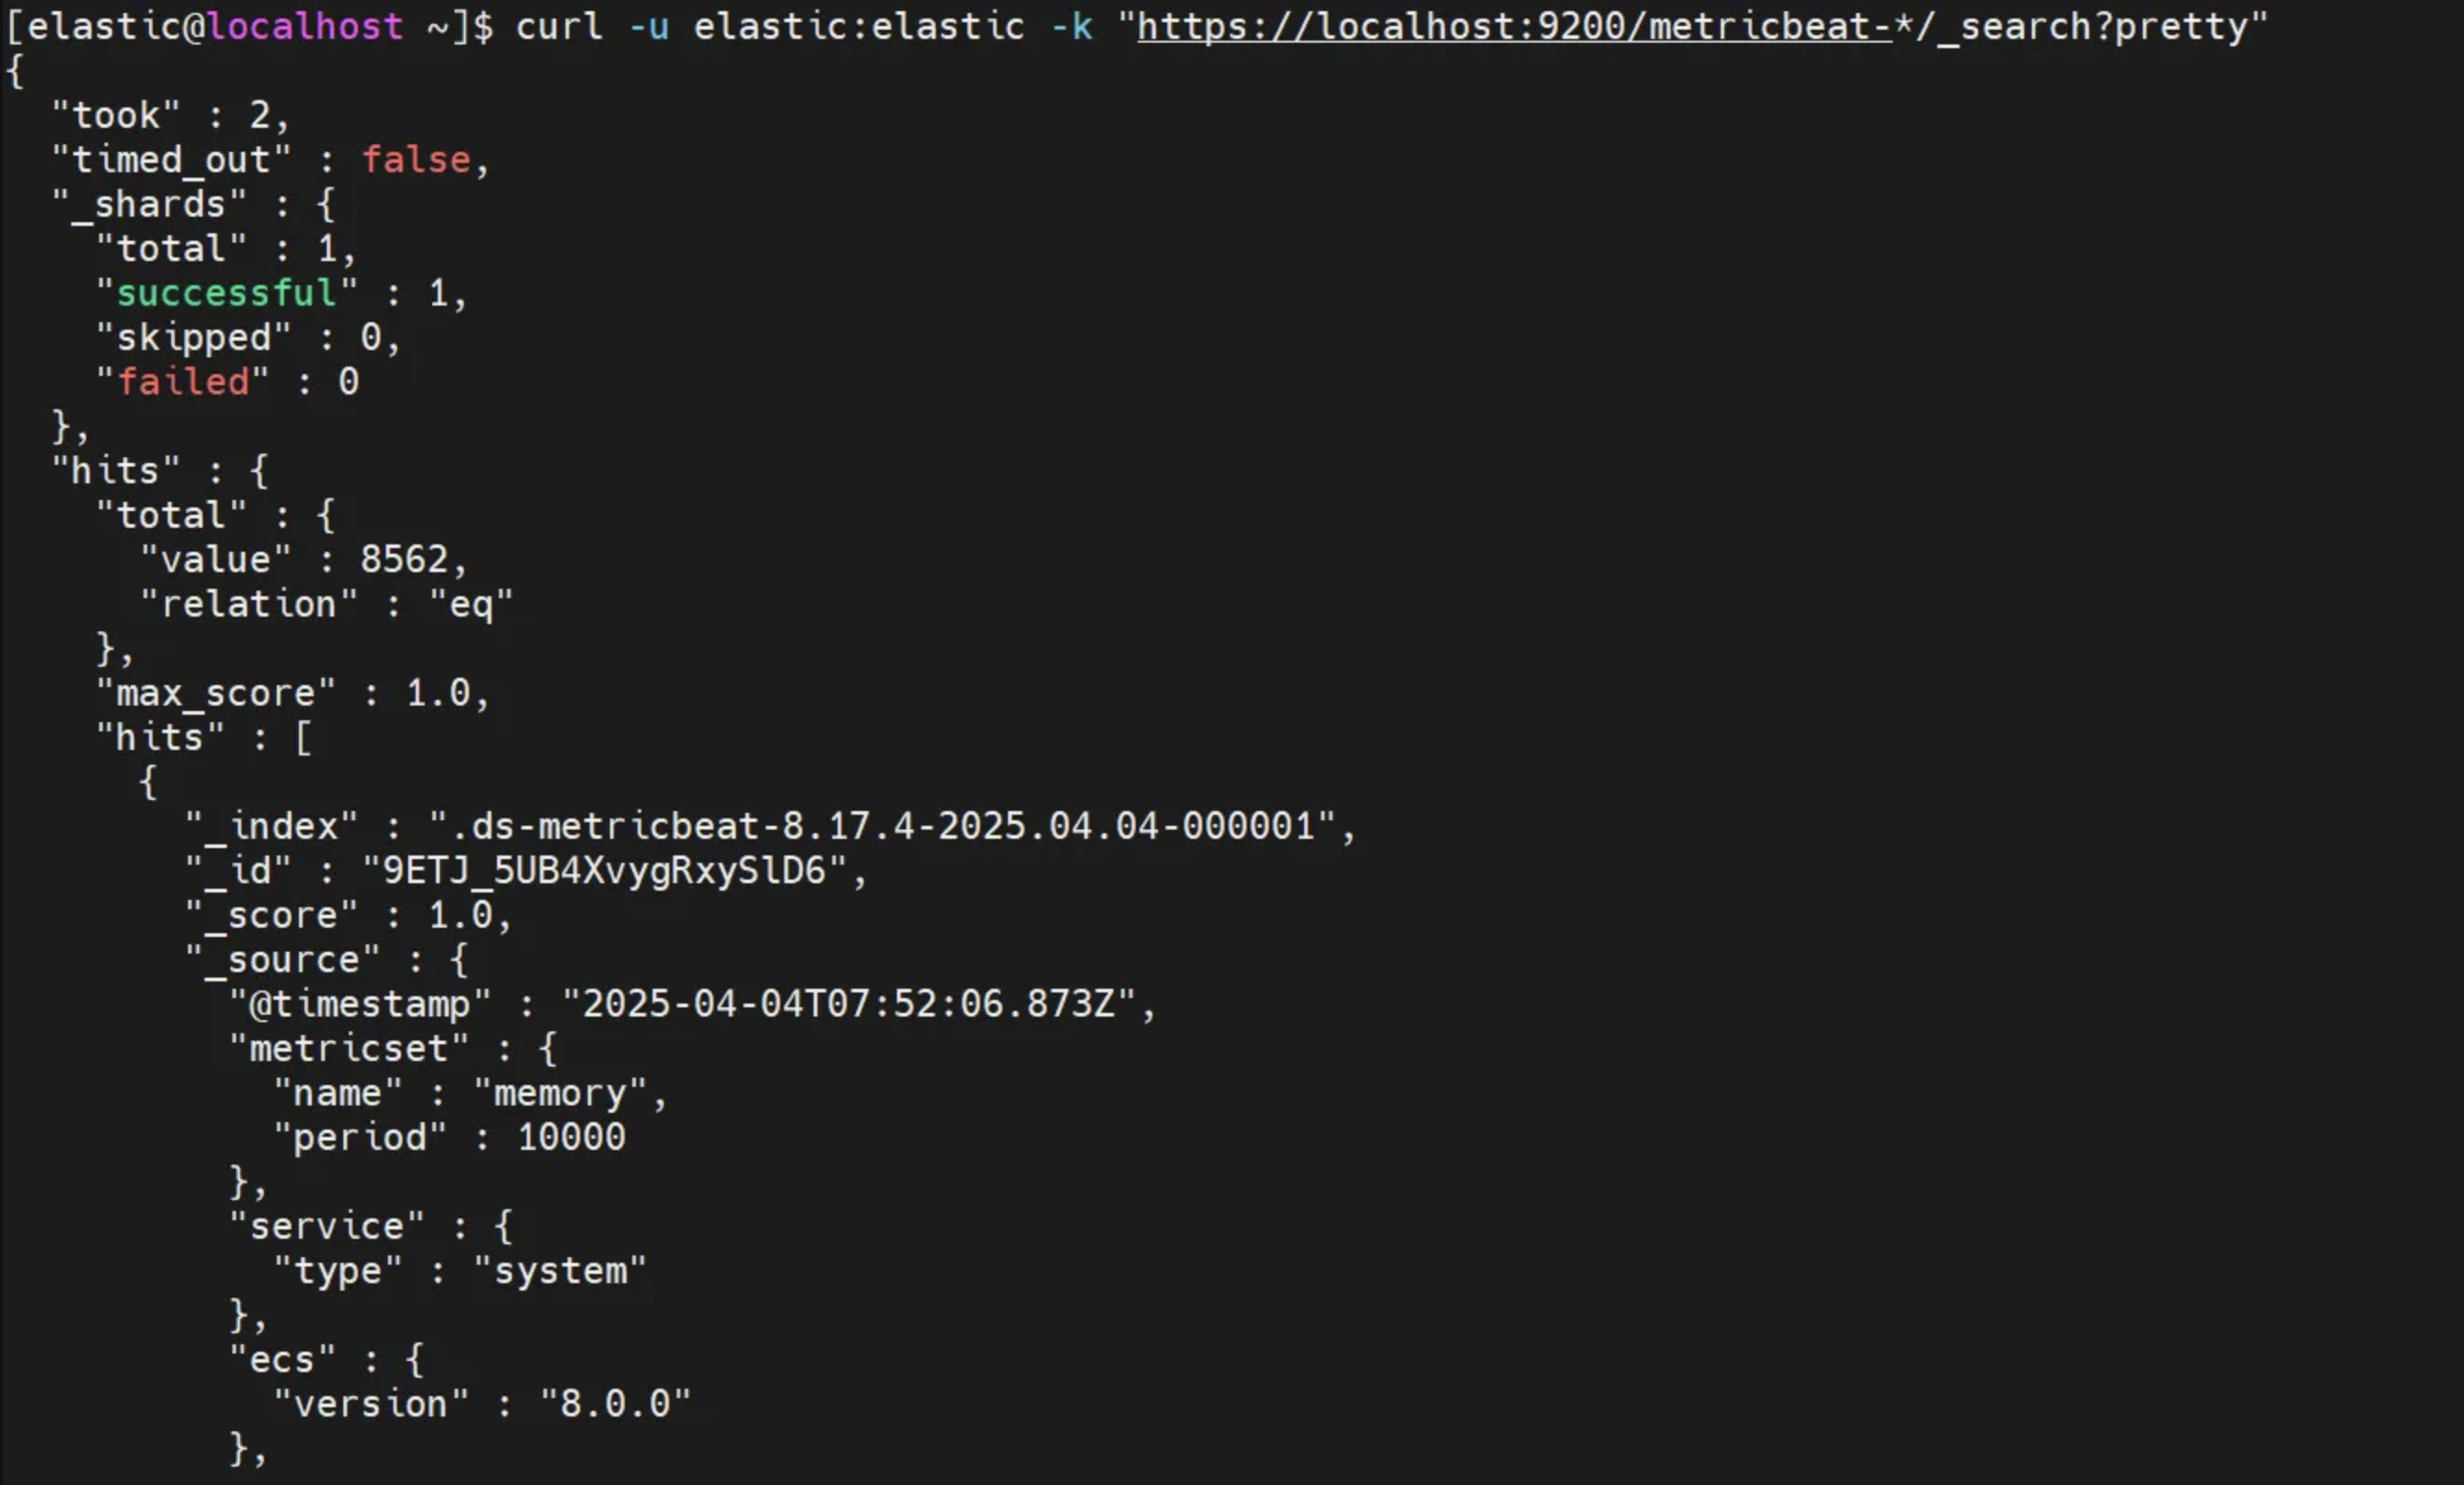
1. metricbeat 인덱스 확인
curl -u elastic:elastic -k "https://localhost:9200/metricbeat-*/_search?pretty"
![업로드중..]()
2. logstash 수집 데이터
curl -u elastic:elastic -k "https://localhost:9200/metricbeat_logs_from_logstash/_search?pretty"
![업로드중..]()
Elasticsearch 인덱스 확인
1. 접속 테스트(클러스터 전체 정보 확인)
curl -X GET "https://192.XXX.XXX.57:9200" -u "elastic:PASSWORD" --cacert "/home/elastic/elasticsearch-8.17.4/config/certs/http_ca.crt"
- 클러스터의 기본 정보(cluster_name, version, tagline) 확인
2. 인덱스 목록 확인
curl -X GET "https://192.XXX.XXX.57:9200/_cat/indices?v" -u "elastic:PASSWORD" --cacert "/home/elastic/elasticsearch-8.17.4/config/certs/http_ca.crt"
- v 옵션은 컬럼 헤더를 보여줌
- navernews* 인덱스가 있는지도 이걸로 확인 가능
3. 특정 인덱스 존재 확인(navernews*)
curl -X GET "https://192.XXX.XXX.57:9200/naver_news_*/_count" -u "elastic:PASSWORD" --cacert "/home/elastic/elasticsearch-8.17.4/config/certs/http_ca.crt"
- 인덱스에 몇 개의 문서가 존재하는지 확인 가능
4. 인증서 검증 무시하고 접속
curl -X GET "https://192.168.219.57:9200/naver_news_*/_count" -u "elastic:PASSWORD" -k
5. 인덱스 용량 확인
[elastic@localhost ~]$ curl -X GET -k -u elastic:PASSWORD "https://localhost:9200/_cat/indices?v&pretty"
- -k : SSL 인증서 검증 무시(insecure)
- -u : 사용자 이름과 비밀번호
- 실제 운영에서는 -k 쓰면 보안 위험 → 권장 X