Two Different Types of Visualization
- Explore/Calculate
- Analyze
- Reason about information
- Communicate
- Explain
- Make decisions
- Reason about information
Goals of Information Visualization
- Make large datasets coherent
- Present information from various viewpoints
- Present information at several levels of detail
- Support visual comparisons
- Tell stories about the data
How to Create Visualizations
- Pateern recognition
- scanning
- recognizing
- remembering images
- Graphical elements
- length
- shape
- orientation
- texture
- 애니메이션
- Color
- Aesthetics
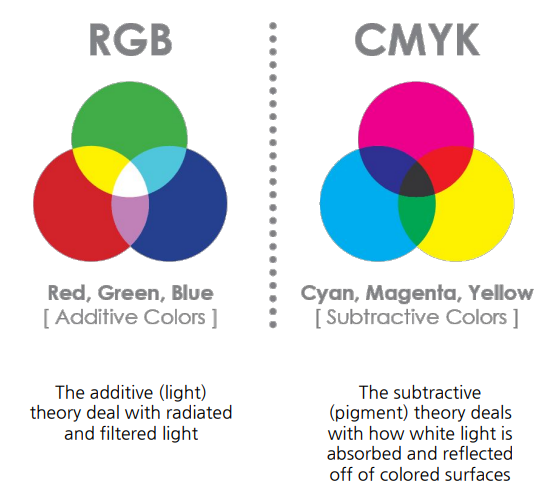
Color
- Color Theories
- HSV(Hue-Saturation-Value)
- Hue : Color, 빛의 파장 자체를 나타내는 색상
Hue is color(blue, green, red, etc.) - Chroma :색 파장의 순수한 정도를 나타내는 채도
Chroma is the purity of a color.(a high chroma has no added black, white or gray) - Saturation : 색의 선명도
Saturation refers to how strong or weak a color is.(high saturation being strong) - Value : 밝고 어두운 정도를 나타내는 명도
Value refers to how light of dark a color is.(light having a high value)
- Hue : Color, 빛의 파장 자체를 나타내는 색상
Color Schemes
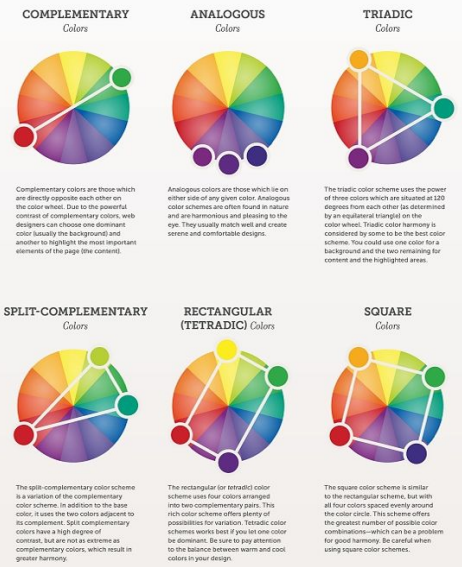
- Complementary
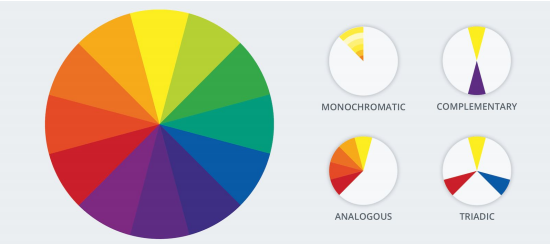
- Analogous
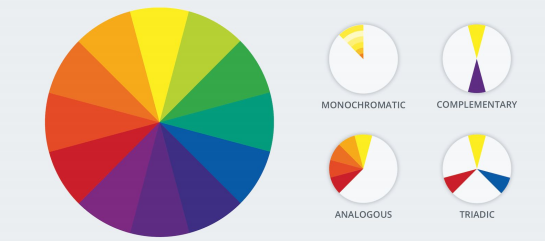
- Triadic
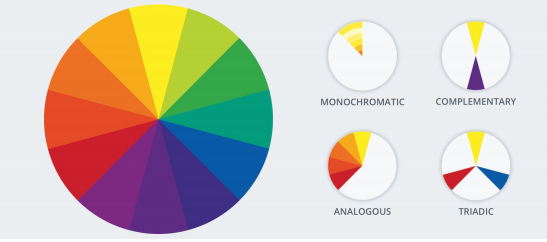
- Split-complementary
- Rectangular
- Square