Precision and Recall are evaluation metrics which emphasize the performance in positive data-set.
Precision = (TP) / (TP + FP)
ratio of correctly predicted positive observations to the total predicted positive observations
Precision question in Titanic model - "Of all the passengers that the model predicted survived how many actually survived ?"
Recall = (TP) / (TP + FN)
also known as sensitivity, ratio of correctly predicted positive observations to the all observations in actual class - positive
Recall question in Titanic model - "Of all the passengers that truly survived, how many did the model label correctly?"
When to Use Precision and Recall
We may start to question which metrics is more significant in evaluation. The answer is - "it depends on the attribute of the model".
Precision will be relatively more significant in a situation where classifying negative as positive case creates a setback.
For example, think of a model which detects a spam mail. If the model starts to detect work-related email (negative) as a spam mail (positive), it will create a huge confusion while performing a task.
Recall will be relatively more significant in a situation where classifying positive as negative case creates a setback.
For example, think of a model which tests a sample of cancer. If the model detects an actual cancer sample (positive) as a healthy sample (negative), it will possibly cost a patient's life.
If we again take a look at the equations for precision and recall, we can see that meanwhile precision and recall both aim to increase TP, precision and recall aims to decrease FP and FN respectively. Due to such characteristic, we must keep in mind that precision and recall are dependent on each other and that they are complementary metrics.
Precision / Reacall in Titanic
Input
# predict titanic with accuracy, confusion matrix, precision, recall
from sklearn.metrics import accuracy_score, precision_score, recall_score, confusion_matrix

def get_clf_eval(y_test, pred):
    confusion = confusion_matrix(y_test, pred)

    accuracy = accuracy_score(y_test, pred)
    precision = precision_score(y_test, pred)
    recall = recall_score(y_test, pred)

    print('Confusion Matrix')
    print(confusion)
    print('Accuracy : ', accuracy)
    print('Precision : ', precision)
    print('Recall : ', recall)
Input
from sklearn.model_selection import train_test_split
from sklearn.linear_model import LogisticRegression
import pandas as pd

titanic_df = pd.read_csv('titanic_train.csv')
y_titanic_df = titanic_df['Survived']
X_titanic_df = titanic_df.drop('Survived', axis=1)
X_titanic_df = transform_features(X_titanic_df)

X_train, X_test, y_train, y_test = train_test_split(X_titanic_df, y_titanic_df,
                                                    test_size=0.2, random_state=11)

lr_clf = LogisticRegression()
lr_clf.fit(X_train, y_train)

pred = lr_clf.predict(X_test)
get_clf_eval(y_test, pred)
Output
Confusion Matrix
[[108  10]
 [ 14  47]]
Accuracy :  0.8659217877094972
Precision :  0.8245614035087719
Recall :  0.7704918032786885
The result shows, that recall (77%) is lower than the precision (82%). What can we do to increase both rates?
Precision / Recall Trade-off
We may adjust the value of threshold to increase precision or recall, if the task emphasizes on either value.
Before classifying specific label-value, Scikit-learn returns array of probability for individual label set. If certain data is predicted to have probability of 10% as 0 and 90% as 1, the data will be classified as 1.
Using predict_proba(), we will be returning individual class probability array for test-label set.
Input
# use predict_proba()
pred_proba = lr_clf.predict_proba(X_test)
pred = lr_clf.predict(X_test)

print('pred_proba() shape : {0}'.format(pred_proba.shape))
print('pred_proba : \n', pred_proba[:5])

# concatenate possibility and result index
pred_proba_result = np.concatenate([pred_proba, pred.reshape(-1, 1)], axis=1)
print('Concatenated Result : \n', pred_proba_result[:5])
Output
pred_proba() shape : (179, 2)
pred_proba :
 [[0.44935227 0.55064773]
 [0.86335512 0.13664488]
 [0.86429645 0.13570355]
 [0.84968519 0.15031481]
 [0.82343411 0.17656589]]
Concatenated Result :
 [[0.44935227 0.55064773 1.        ]
 [0.86335512 0.13664488 0.        ]
 [0.86429645 0.13570355 0.        ]
 [0.84968519 0.15031481 0.        ]
 [0.82343411 0.17656589 0.        ]]
Now, we will be implementing Scikit-learn's threshold logic to understand how the trade-off works behind the code.
Input
from sklearn.preprocessing import Binarizer


X = [[1, -1, 2],
    [2, 0, 0,],
    [0, 1.1, 1.2]]

binarizer = Binarizer(threshold=1.1)
print(binarizer.fit_transform(X))
Output
[[0. 0. 1.]
 [1. 0. 0.]
 [0. 0. 1.]]
Elements in 2d-array X with values less than 1.1 are converted to 0. Now using, Binarizer(), we will be adjusting the threshold for Titanic dataset.
Input
from sklearn.preprocessing import Binarizer

custom_threshold = 0.5

pred_proba1 = pred_proba[:,1].reshape(-1, 1)

binarizer = Binarizer(threshold=custom_threshold).fit(pred_proba1)
custom_predict = binarizer.transform(pred_proba1)

get_clf_eval(y_test, custom_predict)
Output
Confusion Matrix
[[108  10]
 [ 14  47]]
Accuracy :  0.8659217877094972
Precision :  0.8245614035087719
Recall :  0.7704918032786885
Input
custom_threshold = 0.4

pred_proba1 = pred_proba[:,1].reshape(-1, 1)
binarizer = Binarizer(threshold=custom_threshold).fit(pred_proba1)
custom_predict = binarizer.transform(pred_proba1)

get_clf_eval(y_test, custom_predict)
Output
Confusion Matrix
[[97 21]
 [11 50]]
Accuracy :  0.8212290502793296
Precision :  0.704225352112676
Recall :  0.819672131147541
As we adjusted the threshold from 0.5 to 0.4 - precision dropped while recall rose. This is because as threshold is lowered, there is higher chance of true-classification.
Now we will be adjusting threshold by 0.05 and check the variance in values step by step.
Input
# increase threshold step by step
thresholds = [0.4, 0.45, 0.50, 0.55, 0.60]

def get_eval_by_threshold(y_test, pred_proba_c1, thresholds):
    for custom_threshold in thresholds:
        binarizer = Binarizer(threshold=custom_threshold).fit(pred_proba_c1)
        custom_predict = binarizer.transform(pred_proba_c1)

        print('Custom Threshold : ', custom_threshold)
        get_clf_eval(y_test, custom_predict)
        print('\n')

get_eval_by_threshold(y_test, pred_proba1, thresholds)
Output
Custom Threshold :  0.4
Confusion Matrix
[[97 21]
 [11 50]]
Accuracy :  0.8212290502793296
Precision :  0.704225352112676
Recall :  0.819672131147541


Custom Threshold :  0.45
Confusion Matrix
[[105  13]
 [ 13  48]]
Accuracy :  0.8547486033519553
Precision :  0.7868852459016393
Recall :  0.7868852459016393


Custom Threshold :  0.5
Confusion Matrix
[[108  10]
 [ 14  47]]
Accuracy :  0.8659217877094972
Precision :  0.8245614035087719
Recall :  0.7704918032786885


Custom Threshold :  0.55
Confusion Matrix
[[111   7]
 [ 16  45]]
Accuracy :  0.8715083798882681
Precision :  0.8653846153846154
Recall :  0.7377049180327869


Custom Threshold :  0.6
Confusion Matrix
[[113   5]
 [ 17  44]]
Accuracy :  0.8770949720670391
Precision :  0.8979591836734694
Recall :  0.7213114754098361
Threshold at 0.45 seems to be most adequate as it returns similar precision and recall-value.
Scikit-learn also provides precision_recall_curve() API to visualize the fluctuation of precision and recall at different threshold value. Inside the parameter, we will pass the probability of positive classification (1) for each label.
Input
# precision_recall_curve()
from sklearn.metrics import precision_recall_curve

# extract probability when label value equals 1
pred_proba_class1 = lr_clf.predict_proba(X_test)[:,1]

precisions, recalls, thresholds = precision_recall_curve(y_test, pred_proba_class1)
print('Threshold Array Shape ', thresholds.shape)

thr_index = np.arange(0, thresholds.shape[0], 15)
print('10 Indice of Thresholds : ', thr_index)
print('Values of Thresholds : ', np.round(thresholds[thr_index], 2))

print('Precision for Sample Threshold : ', np.round(precisions[thr_index], 3))
print('Recall for Sample Threshold : ', np.round(recalls[thr_index], 3))
Output
Threshold Array Shape  (147,)
10 Indice of Thresholds :  [  0  15  30  45  60  75  90 105 120 135]
Values of Thresholds :  [0.12 0.13 0.15 0.17 0.26 0.38 0.49 0.63 0.76 0.9 ]
Precision for Sample Threshold :  [0.379 0.424 0.455 0.519 0.618 0.676 0.797 0.93  0.964 1.   ]
Recall for Sample Threshold :  [1.    0.967 0.902 0.902 0.902 0.82  0.77  0.656 0.443 0.213]
Input
# visualize precision_recall_curve()
import matplotlib.pyplot as plt
import matplotlib.ticker as ticker
%matplotlib inline

def precision_recall_curve_plot(y_test, pred_proba_c1):
    precisions, recalls, thresholds = precision_recall_curve(y_test, pred_proba_c1)

    plt.figure(figsize=(6,10))
    threshold_boundary = thresholds.shape[0]
    # plot precision
    plt.plot(thresholds, precisions[0:threshold_boundary], linestyle='--', label='precision')
    # plot recall
    plt.plot(thresholds, recalls[0:threshold_boundary], label='recalls')

    start, end = plt.xlim()
    plt.xticks(np.round(np.arange(start, end, 0.1), 2))

    plt.xlabel('Threshold Value'); plt.ylabel('Precision and Recall Value')
    plt.legend(); plt.grid()
    plt.show()

precision_recall_curve_plot(y_test, lr_clf.predict_proba(X_test)[:,1])
Output
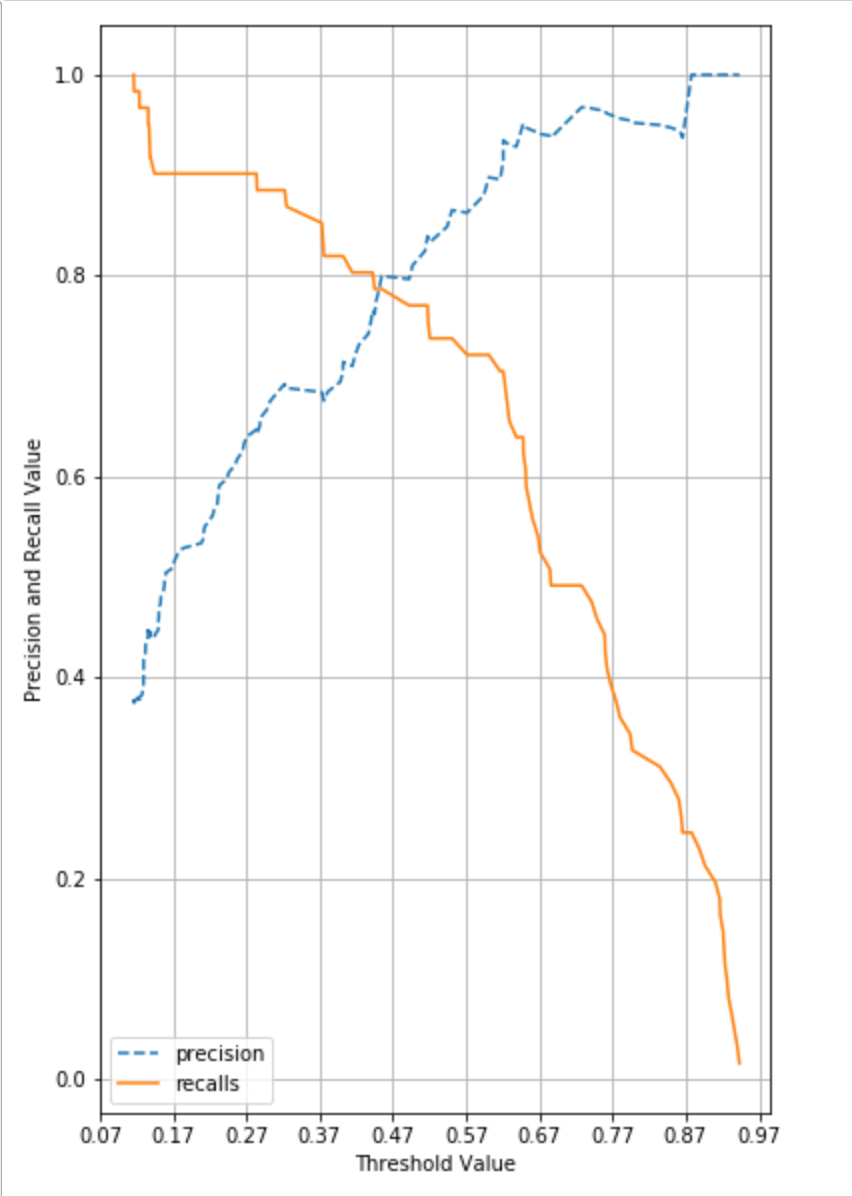
Loopholes of Precision / Recall
As we have seen in graph, precision and recall change as the value of threshold is adjusted. Such adjustment must be performed to an extent where two metrics values are balanced.
How to Make Precision 100%
Predict positive for certain cases and otherwise negative. For example, out of 1000 patients, simply predict 1 patient with certain symptoms of cancer as positive and negative for remaining 999 patients. Precision-score will be 100% (1/ (1 + 0)).
How to Make Recall 100%
Predict positive for entire cases. Since sum of false negative equals 0 in such case, recall-score will equal 100%.