Set up the notebook
import pandas as pd
pd.plotting.register_matplotlib_converters()
import matplotlib.pyplot as plt
%matplotlib inline
import seaborn as sns
print("Setup Complete")
Select a dataset
We'll work with a dataset of 150 different flowers, or 50 each from three different species of iris (Iris setosa, Iris versicolor, and Iris virginica).
Load and examine the data
iris_filepath = "../input/iris-data/iris.csv"
iris_data = pd.read_csv(iris_filepath, index_col="Id")
iris_data.head()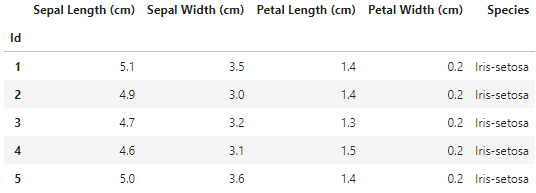
Histograms
Say we would like to create a histogram to see how petal length varies in iris flowers. We can do this with the sns.histplot command.
# Histogram
sns.histplot(iris_data['Petal Length (cm)'])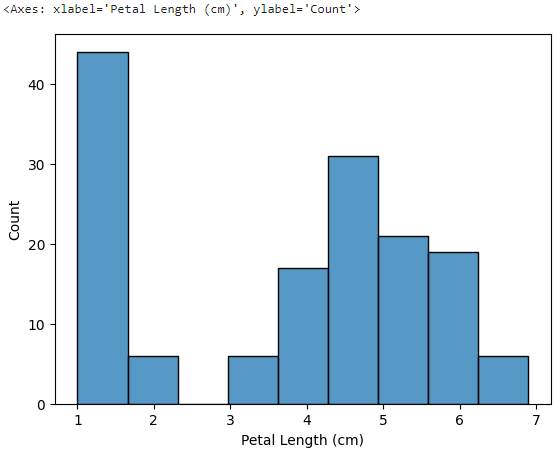
Density plots
The next type of plot is a kernel density estimate (KDE) plot. You can think of it as a smoothed histogram.
To make a KDE plot, we use the sns.kdeplot command. Setting shade=True colors the area below the curve.
# KDE plot
sns.kdeplot(data=iris_data['Petal Length (cm)'], shade=True)
2D KDE plots
We're not restricted to a single column when creating a KDE plot. We can create a two-dimensional (2D) KDE plot with the sns.jointplot command.
# 2D KDE plot
sns.jointplot(x=iris_data['Petal Length (cm)'], y=iris_data['Sepal Width (cm)'], kind="kde", shade=True)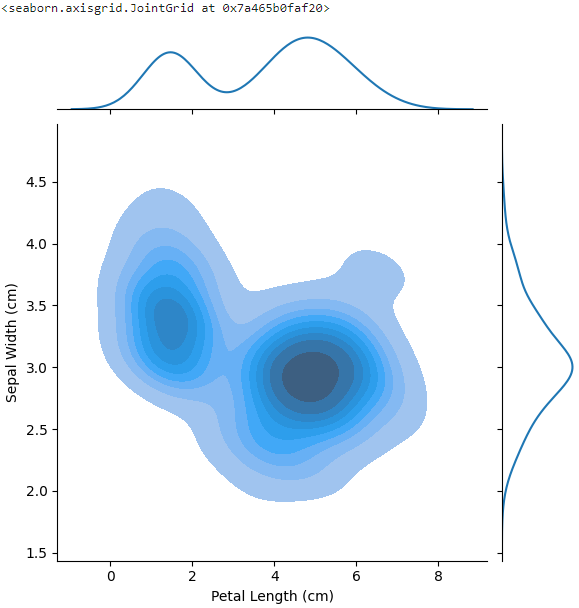
The color-coding shows us how likely we are to see different combinations of sepal width and petal length, where darker parts of the figure are more likely.
Color-coded plots
We'll create plots to understand differences between the species by using the sns.histplot command.
- hue= sets the column we'll use to split the data into different histograms
# Histograms for each species
sns.histplot(data=iris_data, x='Petal Length (cm)', hue='Species')

# Add title
plt.title("Histogram of Petal Lengths, by Species")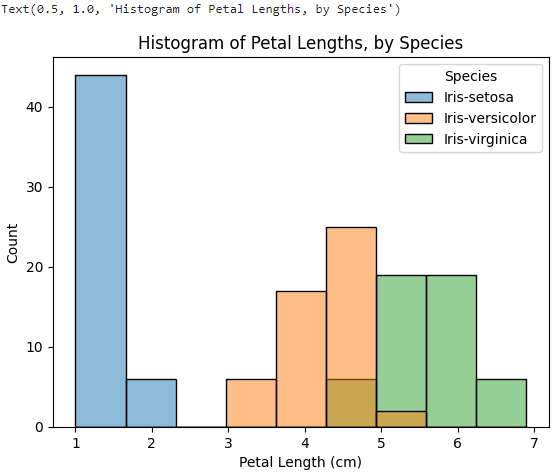
We can also create a KDE plot for each species by using sns.kdeplot.
# KDE plots for each species
sns.kdeplot(data=iris_data, x='Petal Length (cm)', hue='Species', shade=True)

# Add title
plt.title("Distribution of Petal Lengths, by Species")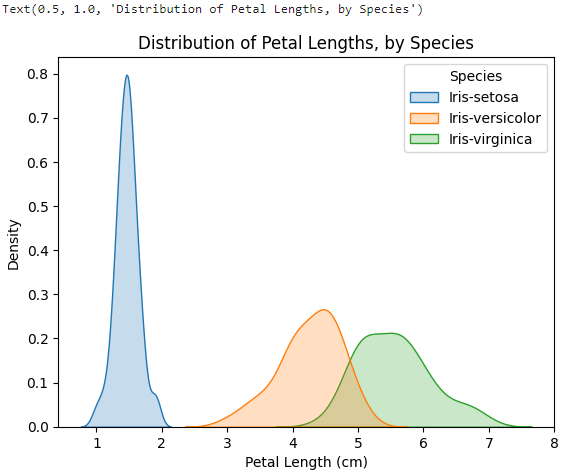
One interesting pattern that can be seen in plots is that the plants seem to belong to one of two groups, where Iris versicolor and Iris virginica seem to have similar values for petal length, while Iris setosa belongs in a category all by itself.
We might even be able to classify any iris plant as Iris setosa just by looking at the petal length: if the petal length of an iris flower is less than 2 cm, it's most likely to be Iris setosa.