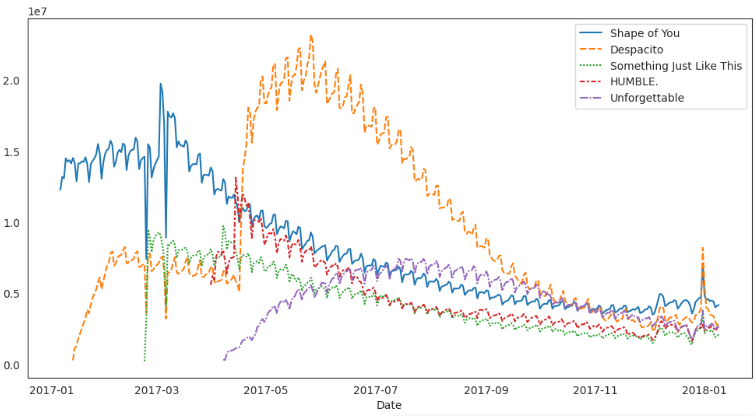
기본 코드
# Line chart
plt.figure(figsize=(12,6))
sns.lineplot(data=spotify_data)
스타일 지정
- sns.set_style("white")
- sns.set_style("dark")

- sns.set_style("whitegrid")

- sns.set_style("darkgrid")
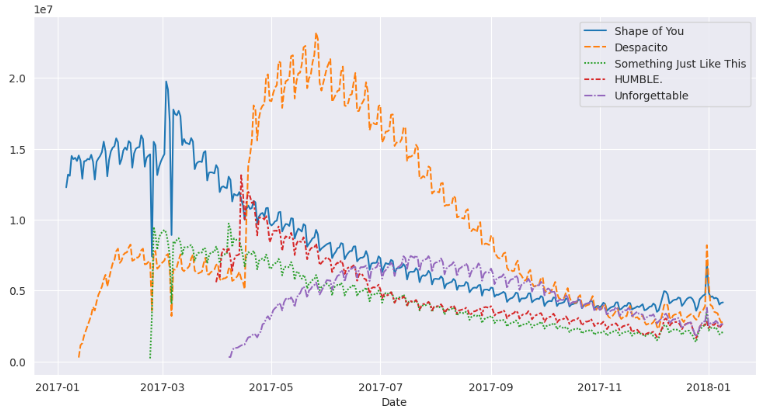
- sns.set_style("ticks")
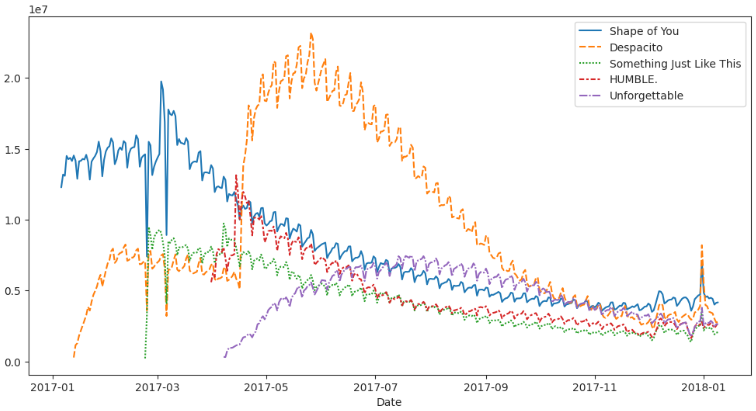

Let's take the lead
기본 코드
# Line chart
plt.figure(figsize=(12,6))
sns.lineplot(data=spotify_data)