📌 데이터 셋 확인
pd.info()<class 'pandas.core.frame.DataFrame'>
RangeIndex: 197428 entries, 0 to 197427
Data columns (total 16 columns):
# Column Non-Null Count Dtype
--- ------ -------------- -----
0 market_id 196441 non-null float64
1 created_at 197428 non-null object
2 actual_delivery_time 197421 non-null object
3 store_id 197428 non-null int64
4 store_primary_category 192668 non-null object
5 order_protocol 196433 non-null float64
6 total_items 197428 non-null int64
7 subtotal 197428 non-null int64
8 num_distinct_items 197428 non-null int64
9 min_item_price 197428 non-null int64
10 max_item_price 197428 non-null int64
11 total_onshift 181166 non-null float64
12 total_busy 181166 non-null float64
13 total_outstanding_orders 181166 non-null float64
14 estimated_order_place_duration 197428 non-null int64
15 estimated_store_to_consumer_driving_duration 196902 non-null float64
dtypes: float64(6), int64(7), object(3)
memory usage: 24.1+ MB📌 결측치 처리
결측치의 범위가 겹치는 부분이 많지 않으며 대부분 평균치를 내기도 어려운 부분인 관계로 모두 삭제하는것으로 결론을 내렸다.
결측치를 채우는 방식도 진행해 보았지만 큰 변화가 없기도 하였다.
df = df.dropna()
df.info()<class 'pandas.core.frame.DataFrame'>
Index: 176016 entries, 0 to 197427
Data columns (total 16 columns):
# Column Non-Null Count Dtype
--- ------ -------------- -----
0 market_id 176016 non-null object
1 created_at 176016 non-null object
2 actual_delivery_time 176016 non-null object
3 store_id 176016 non-null int64
4 store_primary_category 176016 non-null object
5 order_protocol 176016 non-null float64
6 total_items 176016 non-null int64
7 subtotal 176016 non-null int64
8 num_distinct_items 176016 non-null int64
9 min_item_price 176016 non-null int64
10 max_item_price 176016 non-null int64
11 total_onshift 176016 non-null float64
12 total_busy 176016 non-null float64
13 total_outstanding_orders 176016 non-null float64
14 estimated_order_place_duration 176016 non-null int64
15 estimated_store_to_consumer_driving_duration 176016 non-null float64
dtypes: float64(5), int64(7), object(4)
memory usage: 22.8+ MB📌 전처리
actual_delivery_time에서 created_at를 60으로 나눈 값을 빼준 delivery_duration 열을 생성해준다.
# datetime 형식을 datetime64로 변환
df['created_at'] = pd.to_datetime(df['created_at'])
df['actual_delivery_time'] = pd.to_datetime(df['actual_delivery_time'])

# 배달 시간 계산
df['delivery_duration'] = (df['actual_delivery_time'] - df['created_at']).dt.total_seconds() / 60

# 불필요한 열 제거
df = df.drop(['created_at', 'actual_delivery_time'], axis=1)

# 범주형 변수 인코딩
categorical_cols = ['store_primary_category']
numerical_cols = df.columns.drop(['store_primary_category', 'delivery_duration'])

preprocessor = ColumnTransformer(
    transformers=[
        ('num', SimpleImputer(strategy='mean'), numerical_cols),
        ('cat', OneHotEncoder(handle_unknown='ignore'), categorical_cols)
    ])

# 특성과 타겟 분리
X = df.drop('delivery_duration', axis=1)
y = df['delivery_duration']

# 데이터 분할
X_train, X_test, y_train, y_test = train_test_split(X, y, test_size=0.1, random_state=42)

# 데이터 전처리
X_train = preprocessor.fit_transform(X_train)
X_test = preprocessor.transform(X_test)
📌 모델링
모델은 XGBoost를 사용하기로 했다.
먼저 Randomforest를 사용해보았지만 약 30분간 모델 학습 시간을 가졌지만 어떠한 이유인지 모르겠지만 학습이 완료되지 않아 다른 알고리즘은 선택하게 되었다.
XGBoost는 먼저 부스팅 알고리즘을 기반으로 한다.
부스팅이란 Randomforest에서 그 다음 세대로 진화하게 되는 중요한 개념이다.
Randomforest는 각각의 트리를 독립적으로 만드는 반면 부스팅은 트리를 순차적으로 만들면서 이전 트리에서 학습한 내용이 다음 학습에 반영된다.
이는 RNN, DNN과 유사하다.
# DMatrix 생성
dtrain = xgb.DMatrix(X_train, label=y_train)
dtest = xgb.DMatrix(X_test, label=y_test)

# XGBoost 파라미터 설정
params = {
    'objective': 'reg:squarederror', # reg:squarederror로 설정하여 MSE사용
    'eval_metric': 'rmse', # 평가 지표로 RMSE 사용
    'learning_rate': 0.1,
    'max_depth': 6,
    'seed': 42,
    'tree_method': 'gpu_hist'  # GPU 사용 설정
}

# 학습 과정 모니터링
num_boost_round = 100
evals = [(dtrain, 'train'), (dtest, 'eval')]
progress = {}

model = xgb.train(
    params,
    dtrain,
    num_boost_round=num_boost_round,
    evals=evals,
    evals_result=progress,
    verbose_eval=True
)
📌 시각화
import matplotlib.pyplot as plt

train_rmse = progress['train']['rmse']
eval_rmse = progress['eval']['rmse']

plt.figure(figsize=(10, 7))
plt.plot(train_rmse, label='Train RMSE')
plt.plot(eval_rmse, label='Eval RMSE')
plt.xlabel('Number of Rounds')
plt.ylabel('RMSE')
plt.title('RMSE over Training Rounds')
plt.legend()
plt.show()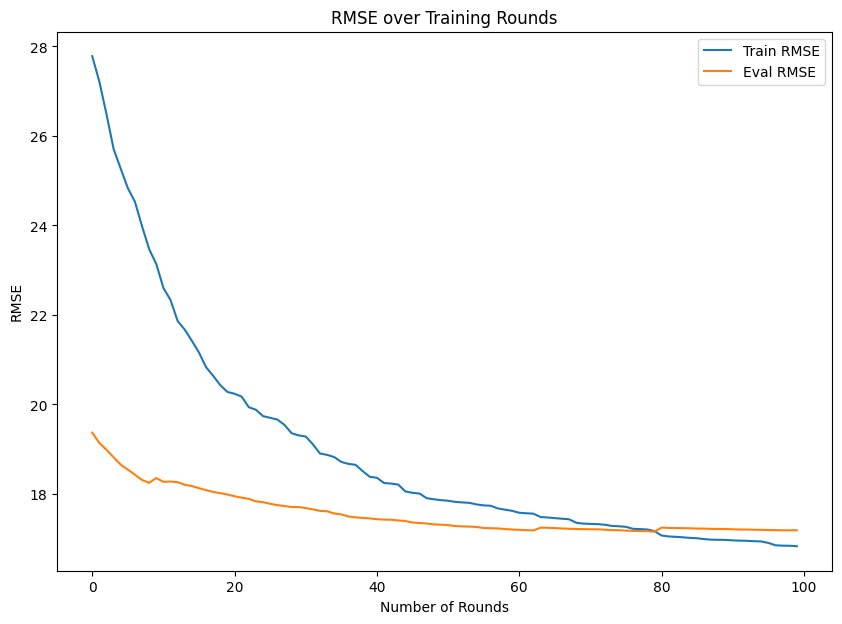
📌 평가
# 최종 모델 평가
y_pred = model.predict(dtest)

# 평가 지표 계산
mae = mean_absolute_error(y_test, y_pred)
mse = mean_squared_error(y_test, y_pred)
rmse = np.sqrt(mse)

# Under-prediction의 비율 계산
under_predictions = np.sum(y_pred < y_test)
under_prediction_ratio = under_predictions / len(y_test)

print(f"pred: {y_pred}")
print(f'Mean Absolute Error: {mae}')
print(f'Mean Squared Error: {mse}')
print(f'Root Mean Square Error: {rmse}')
print(f'Under-prediction ratio: {under_prediction_ratio}')y_pred: [51.80057 60.28056 37.950516 ... 50.746944 47.010056 37.548664]
Mean Absolute Error: 10.915870883989538
Mean Squared Error: 295.4411207884746
Root Mean Square Error: 17.1884007629702
Under-prediction ratio: 0.4160314028899761