📚 지수분포란?
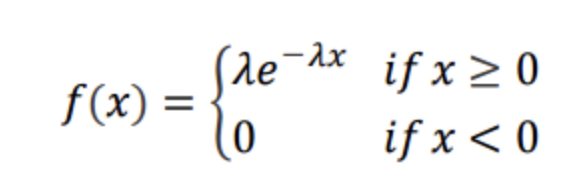
지수분포의 PDF는 위와 같이 정의된다.
지수분포는 사건과 사건 사이의 시간을 나타내는 확률분포라고 한다.
그래서인지 포아송에서의 사건 파라미터와 동일한 람다 파라미터가 존재한다.
📚 지수분포의 평균과 분산
📚 평균
📚 분산
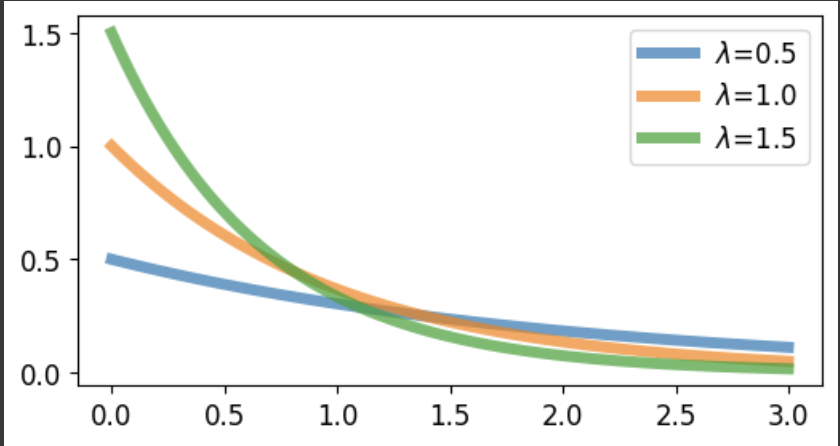
📚 그래프 그리기
import numpy as np
import matplotlib.pyplot as plt

plt.style.use('default')
plt.rcParams['figure.figsize'] = (6, 3)
plt.rcParams['font.size'] = 12
plt.rcParams['lines.linewidth'] = 5

ld1, ld2, ld3 = 0.5, 1.0, 1.5

x = np.linspace(0, 3, 100)
y1 = ld1 * np.exp(-ld1 * x)
y2 = ld2 * np.exp(-ld2 * x)
y3 = ld3 * np.exp(-ld3 * x)

plt.plot(x, y1, alpha=0.7, label=r'$\lambda$=0.5')
plt.plot(x, y2, alpha=0.7, label=r'$\lambda$=1.0')
plt.plot(x, y3, alpha=0.7, label=r'$\lambda$=1.5')

plt.legend()
plt.show()