3장. 사이킷런을 타고 떠나는 머신 러닝 분류 모델 투어 -2

서포트 벡터 머신을 사용한 최대 마진 분류
서포트 벡터 머신( Support Vector Machine, SVM )
- 강력하고 널리 사용되는 학습 알고리즘
- 퍼셉트론의 확장으로 생각할 수 있다
- 마진을 최대화하는 것
💡 마진 : 클래스를 구분하는 초평면( 결정 경계 )과 이 초평편이 가장 가까운 훈련 샘플 사이의 거리로 정의
최대 마진
- 일반화 오차가 낮아지는 경향이 있기 때문에 큰 마진의 결정 경계를 알아야 한다
- 작은 마진의 모델은 과대적합이되기 쉽다
📍 슬랙 변수를 사용하여 비선형 분류 문제 다루기
💡 슬랙 변수 : 선형적으로 구분되지 않는 데이터에서 선형 제약 조건을 완화할 필요가 있기 때문에 도입
from sklearn.svm import SVC

svm = SVC(kernel='linear', C=1.0, random_state=1)
svm.fit(x_train_std, y_train)

plot_decision_regions(x_combined_std, y_combined,
                      classifier=svm, test_idx=range(105, 150))
plt.xlabel('petal length [standardized]')
plt.ylabel('petal width [standardized]')
plt.legend(loc='upper left')
plt.tight_layout()

plt.show()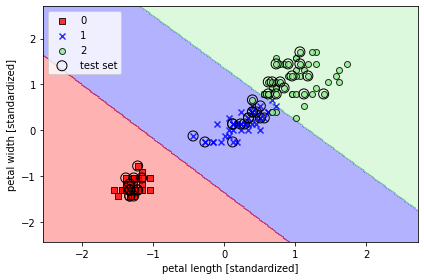
✨ 규제가 있는 로지스틱 회귀 모델은 C값을 줄이면 편향이 늘고 모델 분산이 줄어든다
💡 사이킷런을 사용할 경우 데이터셋이 너무 커서 컴퓨터 메모리 용량에 맞지 않는 경우가 있다
👉 이에 대한 대안으로 SGDClassifier 클래스를 제공
- partial_fit 메서드를 사용하여 온라인 학습을 지원
from sklearn.linear_model import SGDClassifier

ppn = SGDClassifier(loss='perceptron')
lr = SGDClassifier(loss='log')
svm = SGDClassifier(loss='hinge')
커널 SVM을 사용하여 비선형 문제 풀기
📍 선형적으로 구분되지 않는 데이터를 위한 커널 방법
import matplotlib.pyplot as plt
import numpy as np

np.random.seed(1)
x_xor = np.random.randn(200, 2)
y_xor = np.logical_xor(x_xor[:, 0] > 0,
                      x_xor[:, 1] > 0)
y_xor = np.where(y_xor, 1, -1)

plt.scatter(x_xor[y_xor == 1, 0], x_xor[y_xor == 1, 1],
           c='b', marker='x', label='1')
plt.scatter(x_xor[y_xor == -1, 0], x_xor[y_xor == -1, 1],
           c = 'r', marker='s', label='-1')
plt.xlim([-3, 3])
plt.ylim([-3, 3])
plt.legend(loc='best')
plt.tight_layout()

plt.show()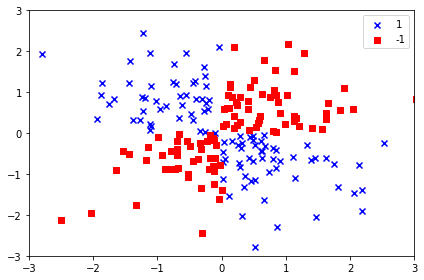
- 선형적으로 구분되지 않는 데이터를 다루는 커널 방법의 기본 아이디어는 매핑 함수( )를 사용하여 고차원 공간에 투영하는 것
📍 커널 기법을 사용하여 고차원 공간에서 분할 초평면 찾기
-
커널 기법을 사용하지 않았을 때의 문제
- SVM으로 비선형 문제를 풀기 위해 매핑 함수를 사용하여 훈련 데이터를 고차원 특성 공간으로 변환
- 새로운 특성 공간에서 데이터를 분류하는 선형 SVM 모델을 훈련
- 새로운 특성을 만드는 계산 비용이 매우 비싸다
-
커널 기법을 사용했을 때
를 로 바꾸는 것
- 두 포인트 사이 점곱을 계산하는 데 드는 높은 비용을 절감하기 위해 커널 함수를 정의
svm = SVC(kernel='rbf', random_state=1, gamma=0.10, C=10.0)
svm.fit(x_xor, y_xor)

plot_decision_regions(x_xor, y_xor, classifier=svm)
plt.legend(loc='upper left')
plt.tight_layout()

plt.show()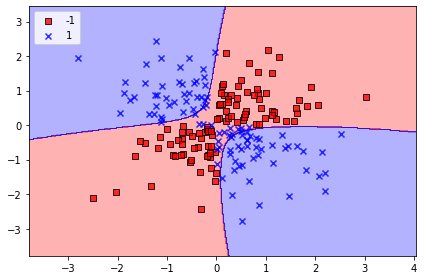
📍 붓꽃 데이터셋에 적용
- 값에 따라 서포트 벡터의 영향이나 범위가 변한다
svm = SVC(kernel='rbf', random_state=1, gamma=0.2, C=1.0)
svm.fit(x_train_std, y_train)

plot_decision_regions(x_combined_std, y_combined,
                      classifier=svm, test_idx=range(105, 150))
plt.xlabel('petal length [standardized]')
plt.ylabel('petal width [standardized]')
plt.legend(loc='upper left')
plt.tight_layout()

plt.show()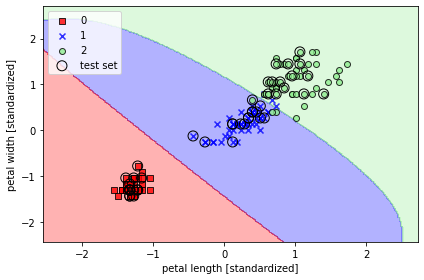
- 값을 크게 했을 때
svm = SVC(kernel='rbf', random_state=1, gamma=100.0, C=1.0)
svm.fit(x_train_std, y_train)

plot_decision_regions(x_combined_std, y_combined,
                      classifier=svm, test_idx=range(105, 150))
plt.xlabel('petal length [standardized]')
plt.ylabel('petal width [standardized]')
plt.legend(loc='upper left')
plt.tight_layout()

plt.show()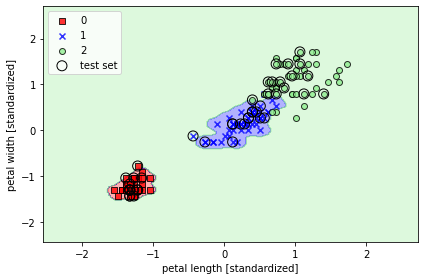
✨ 매개변수가 과대적합 또는 분산을 조절하는 중요한 역할을 한다
결정 트리 학습
- 결정트리( decision tree )분류기는 설명이 중요할 때 아주 유용한 모델
- 반복 과정을 통해 이프 노트( leaf node )가 순수해질 때까지 모든 자식 노드에서 이 분할 작업을 반복
- 특성 공간을 사각 격자로 나누기 때문에 복잡한 결정 경계를 만들 수 있다
- 결정 트리가 깊어질수록 결정 경계가 복잡해지고 과대적합되기 쉽기 때문에 주의해야 한다
📍 결정 트리 만들기
from sklearn.tree import DecisionTreeClassifier

tree = DecisionTreeClassifier(criterion='gini', max_depth=4, random_state=1)
tree.fit(x_train, y_train)
x_combined = np.vstack((x_train, x_test))
y_combined = np.hstack((y_train, y_test))

plot_decision_regions(x_combined, y_combined,
                     classifier=tree, test_idx=range(105, 150))
plt.xlabel('petal length [cm]')
plt.ylabel('petal width [cm]')
plt.legend(loc='upper left')
plt.tight_layout()

plt.show()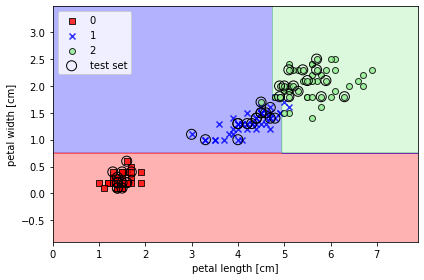
📍 GraphVic 프로그램을 통한 결정 트리 모델 시각화
from pydotplus import graph_from_dot_data
from sklearn.tree import export_graphviz

dot_data = export_graphviz(tree, filled=True, rounded=True,
                          class_names=['Setosa', 'Versicolor', 'Virginica'],
                          feature_names=['petal length', 'petal width'],
                          out_file=None)
graph = graph_from_dot_data(dot_data)
graph.write_png('tree.png')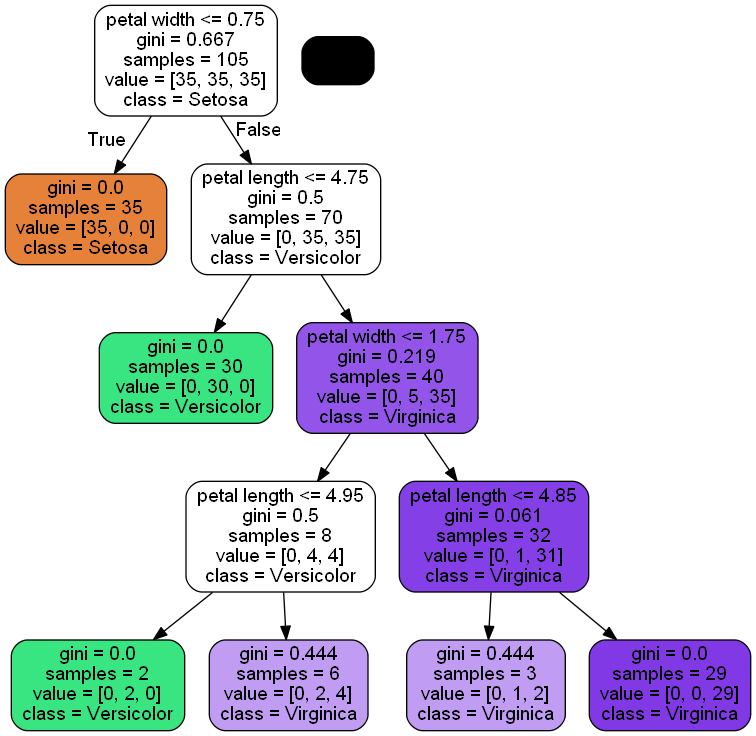
랜덤 포레스트로 여러 개의 결정 트리 연결
- 랜덤 포레스트
- 결정 트리의 **앙상블** - 여러 개의 결정 트리를 평균 내는 것 - 견고한 모델을 만들어 일반화 성능을 높이고 과대적합의 위험을 줄일 수 있다- n개의 랜덤한 부트스트랩( bootstrap ) 샘플을 뽑는다
- 부트스트랩 샘플에서 결정 트리를 학습
a. 중복을 허용하지 않고 랜덤하게 개의 특성을 선택
b. 정보 이득과 같은 목적 함수를 기준으로 최선의 분할을 만드는 특성을 사용해서 노드를 분할 1 ~ 2단계를 번 반복- 각 트리의 예측을 모아 다수결 투표로 클래스 레이블을 할당
- 랜덤 포레스트의 큰 장점은 결정 트리만큼 해석이 쉽지는 않지만 하이퍼파라미터 튜닝에 많은 노력을 기울이지 않아도 된다는 것
- 트리 개수가 많을수록 계산 비용이 증가하는 만큼 랜덤 포레스트 분류기의 성능이 좋아진다
📍 랜덤 포레스트의 트리 앙상블이 만든 결정 영역
from sklearn.ensemble import RandomForestClassifier

forest = RandomForestClassifier(criterion='gini', n_estimators=25, random_state=1, n_jobs=2)
forest.fit(x_train, y_train)

plot_decision_regions(x_combined, y_combined,
                     classifier=forest, test_idx=range(105, 150))
plt.xlabel('petal length [cm]')
plt.ylabel('petal width [cm]')
plt.legend(loc='upper left')
plt.tight_layout()

plt.show()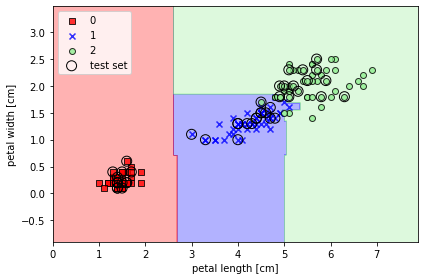
n_estimators매개변수로 25개의 결정 트리를 사용- 노드를 분할하는 불순도 지표로는 지니 불순도를 사용
k-최근접 이웃: 게으른 학습 알고리즘
-
훈련 데이터에서 판별 함수를 학습하는 대신 훈련 데이터셋을 메모리에 저장한다
- 숫자 와 거리 측정 기준을 선택
- 분류하려는 샘플에서 개의 최근접 이웃을 찾는다
- 다수결 투표를 통해 클래스 레이블을 할당
-
선택한 거리 측정 기준에 따라서 KNN 알고리즘이 훈련 데이터셋에서 분류하려는 포인트와 가장 가까운 샘플 개를 찾는다
-
새로운 데이터 포인트의 클래스 레이블은 이 개의 최근접 이웃에서 다수결 투표를 하여 결정
📍 유클리디안 거리 측정 방식을 사용한 사이킷런의 KNN 모델
from sklearn.neighbors import KNeighborsClassifier

knn = KNeighborsClassifier(n_neighbors=5, p=2, metric='minkowski')
knn.fit(x_train_std, y_train)

plot_decision_regions(x_combined_std, y_combined,
                     classifier=knn, test_idx=range(105, 150))
plt.xlabel('petal length [standardized]')
plt.ylabel('petal width [standardized]')
plt.legend(loc='upper left')
plt.tight_layout()

plt.show()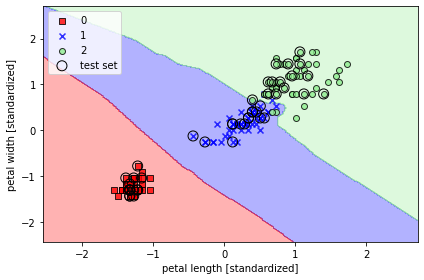
- 매개변수
p1로 지정하면 : 맨하튼 거리
2로 지정하면 : 유클라디안 거리