이번 DACON CUP에 충동적으로 참여하게 되면서 필수불가결하게 시계열 분석을 공부하게 됬다.
ADsP 시험 공부할 때 기본적인 이론은 학습되어 있으나, 사실 대부분이 다 잊어먹고 기억나는거라곤 ARIMA모델뿐...
이번에 한번 시계열 데이터 Kaggle을 필사하면서 복습하려고 한다.
사용하려는 데이터는 https://www.kaggle.com/rakannimer/air-passengers
공부하는 Notebook은 https://www.kaggle.com/prashant111/complete-guide-on-time-series-analysis-in-python/comments
모듈
import pandas as pd
import numpy as np
import plotly.express as px
import plotly.graph_objs as go
from statsmodels.tsa.stattools import adfuller
from statsmodels.tsa.stattools import acf, pacf
from statsmodels.tsa.seasonal import seasonal_decompose
from statsmodels.tsa.arima_model import ARIMA
from statsmodels.graphics.tesplots import plot_acf, plot_pacf
from matplotlib.pylab import rcParams
import matplotlib.pylab as plt
%matplotlib inline
from datetime import datetime
from dateutil.parser import parse
시계열 분석할 때 사용하는 패키지는 statdmodels 안에 다 들어있다.
adfuller: Augmented Dickey–Fuller test 하기 위한 패키지acf, pacf: Autocorrelation, Partial Autocorrelation 패키지plot_acf, plot_acf: acf, plot 그래프를 그리기 위한 패키지seasonal_decompose: 시계열 분해 패키지ARIMA: ARIMA 모델 패키지
시계열 분석
데이터 확인
df = pd.read_csv('AirPassengers.csv')

df.columns = ['Date', 'Number of Passengers']
df.head()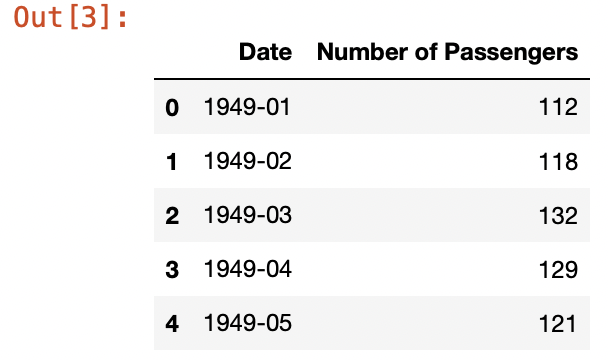
데이터를 보면 날짜(Date)와 승객수(Nunmber of Passengers)밖에 없다. 이를 봤을 때 일변량 분석하는 데이터임을 알 수 있다.
우선 데이터를 데이터프레임으로만 봤을 때는 어떤 형태의 시계열인지 알 수 없으므로 시각화를 해보자. 두가지 방법으로 해보았다.
fig = px.line(df, y=df['Number of Passengers'])
fig.show()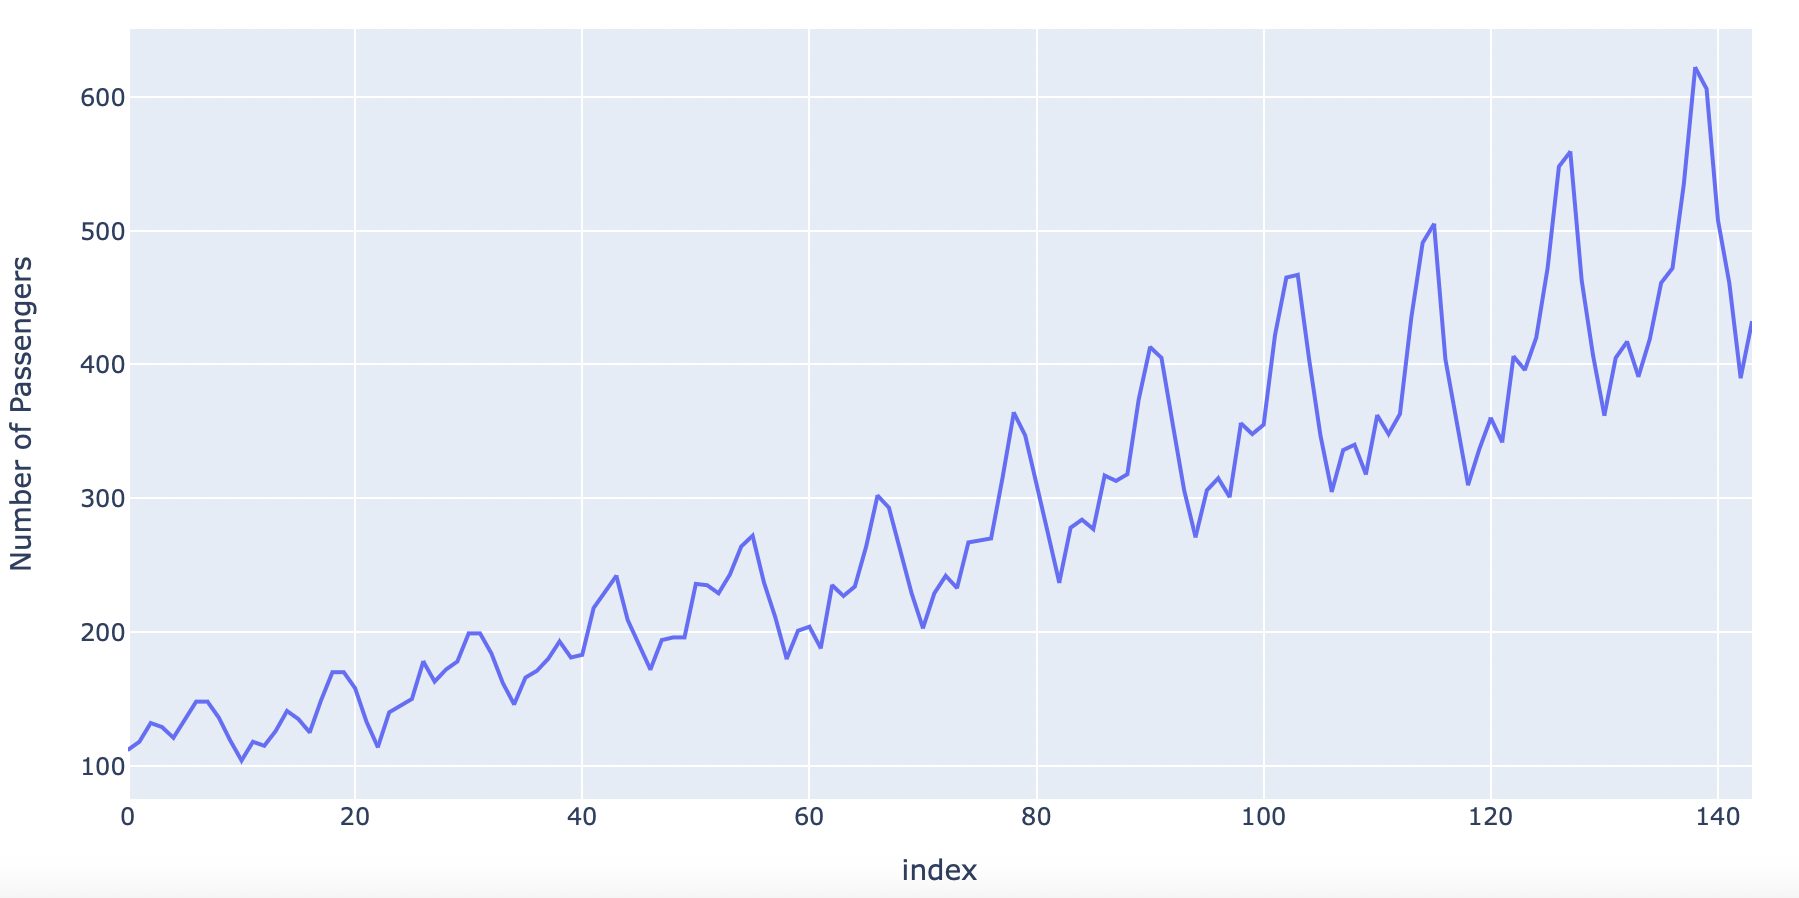
def plot_df(df, x, y, title="", xlabel="", ylabel="", dpi=100):
    plt.figure(figsize=(15, 4), dpi=dpi)
    plt.plot(x, y, color='tab:red')
    plt.gca().set(title=title, xlabel=xlabel, ylabel=ylabel)
    plt.show()

plot_df(df, df['Date'], df['Number of Passengers'], "Number of US Airline Passengers from 1949 to 1960","Date", "Number of Passengers")
그래프를 확인한 결과 trend와 계절성이 있는것을 알 수 있다.
y축 대칭으로도 시각화를 할 수 있다.
x = df['Date'].values
y1 = df['Number of Passengers'].values

fig, ax = plt.subplots(1, 1, figsize=(16, 5), dpi=120)
plt.fill_between(x, y1=y1, y2=-y1, alpha=0.5, linewidth=2, color='seagreen')
plt.ylim(-800, 800)
plt.title("Air Passengers (Two Side View)", fontsize=16)
plt.hlines(y=0, xmin=np.min(df['Date']), xmax=np.max(df['Date']), linewidth=.5)
plt.show()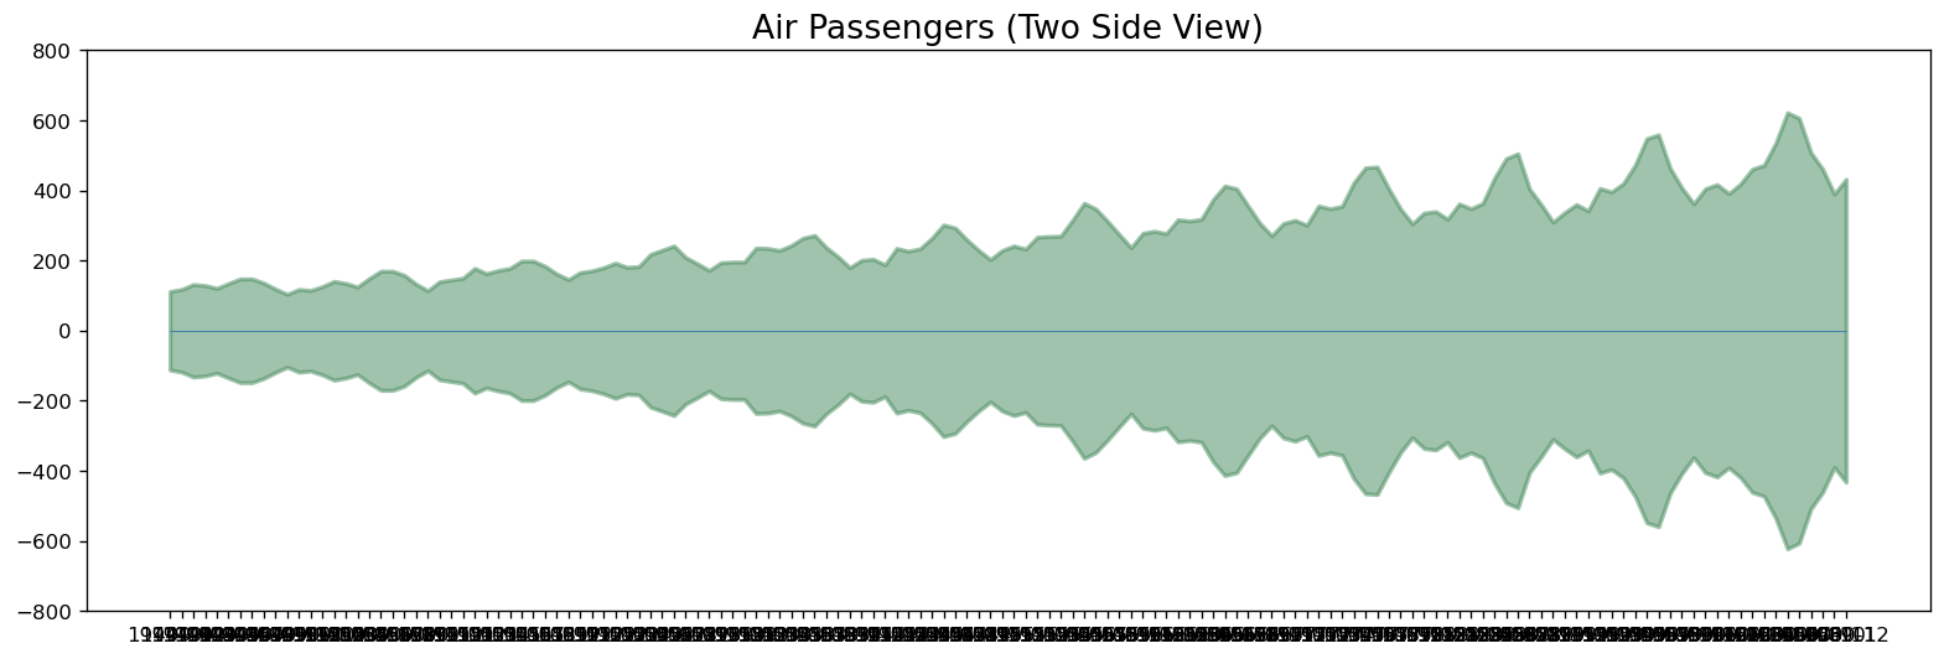
시계열 분해
시계열 데이터는 크게 두가지의 트랜드와 계절성의 조합이 있다.
- Additive : value = Base + Trend + Seasonal + Error
- Multiplicative : value = Base * Trend * Seasonal * Error
분석하고자 하는 시계열이 어떤 조합의 데이터인지 어떻게 확인할까?
내가 지금까지 배운것으로 아는 것은 두가지가 있다.
1. 시계열 그래프로 확인하기
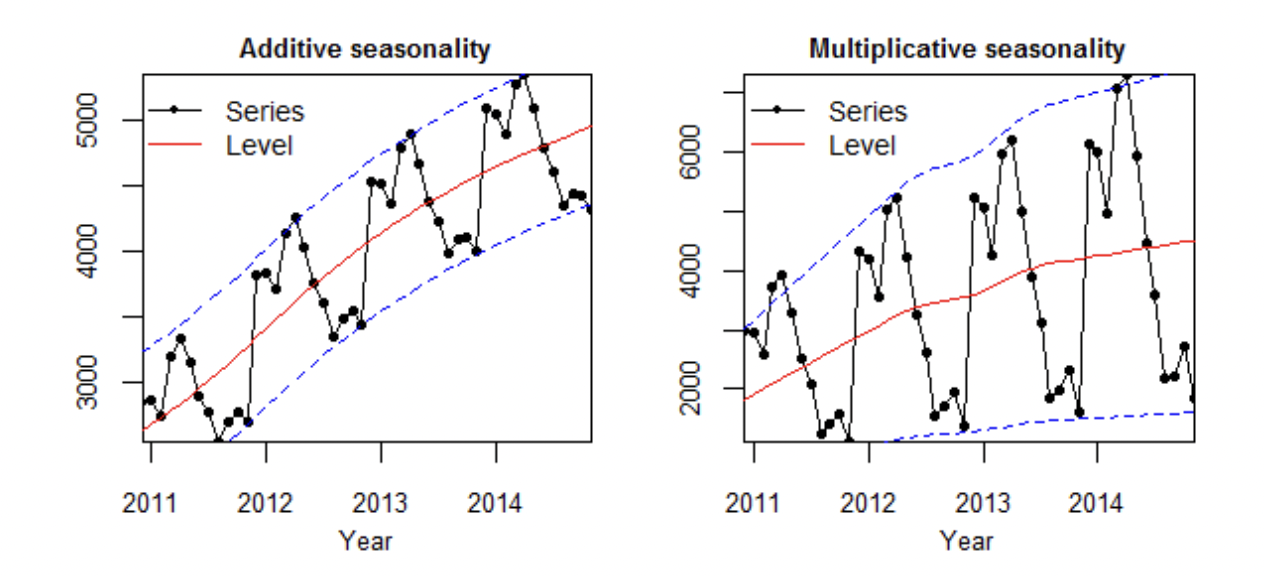
시계열 데이터를 평균과 같이 볼 때 계절성 진폭이 평균과 독립적이면 덧셈모델, 평균에 따라 달라지면 곱셈 모델을 사용한다고 한다.
rolmean = df.rolling(window=9).mean()

fig = go.Figure(data=[
    go.Scatter(x = df.Date, y=df['Number of Passengers'], name='Passengers'),
    go.Scatter(x= df.Date, y=rolmean['Number of Passengers'], name='mean')
])
fig.show()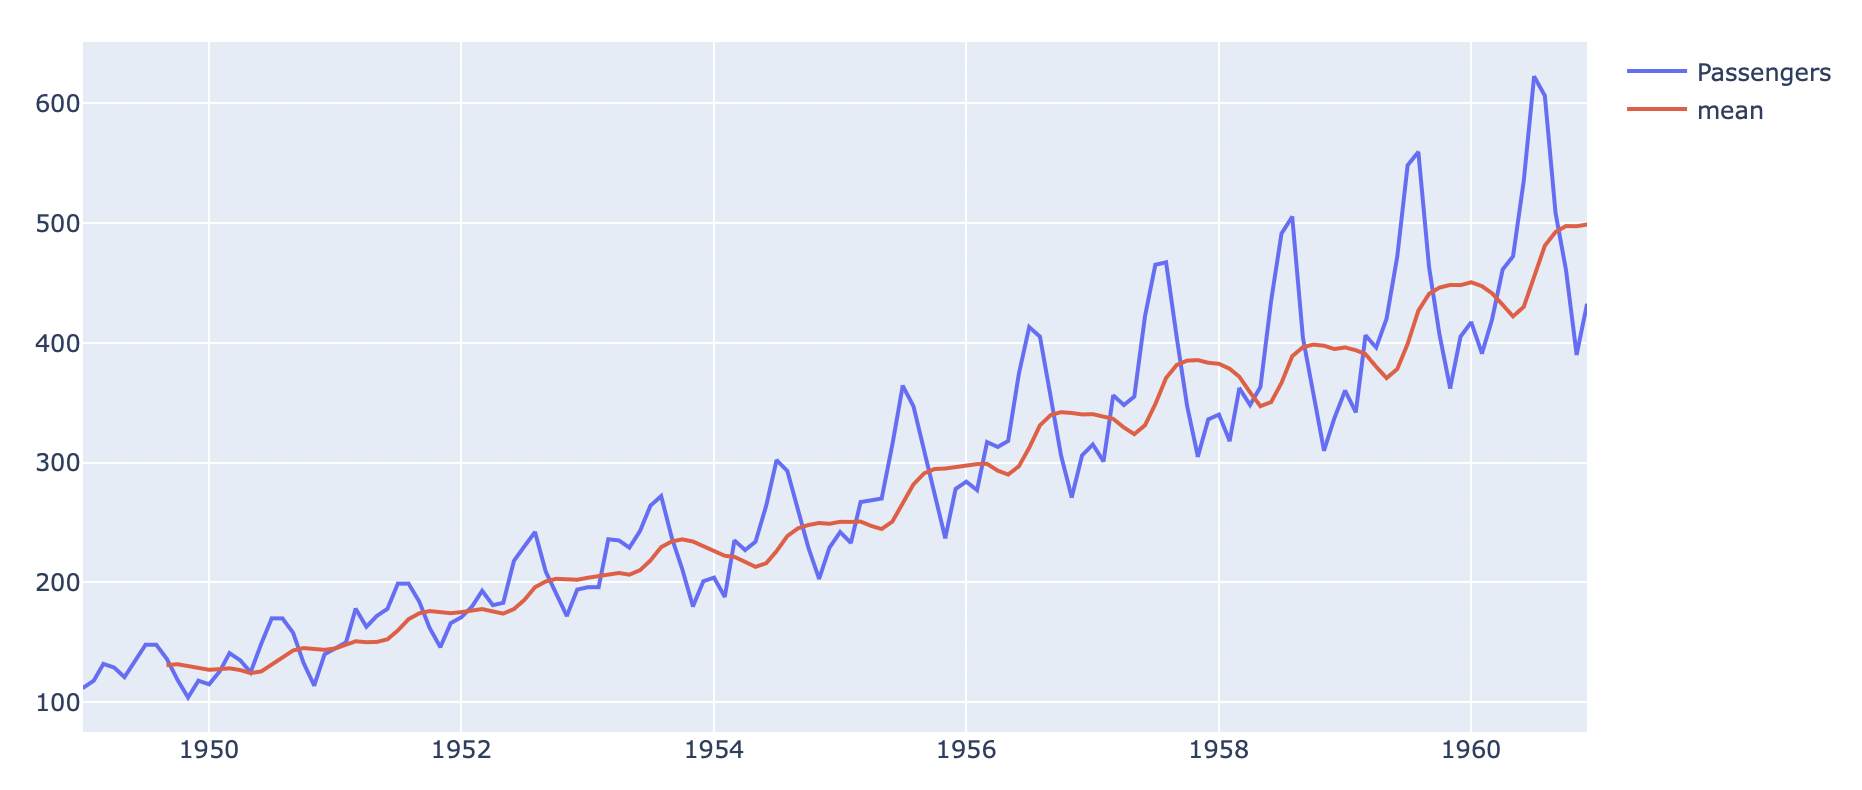
이번 데이터를 가지고 일단 9 이동평균선과 시계열 데이터를 시각화해보니, 평균선에 따라 진폭이 점점 더 커지는 것을 볼 수 있다. 이를 봤을 때 이 데이터는 Multiplicative 데이터라고 짐작할 수 있다.
2. 잔차도로 확인하기
from dateutil.parser import parse

multiplicative_decomposition = seasonal_decompose(df['Number of Passengers'], model='multiplicative', period=30)

additive_decomposition = seasonal_decompose(df['Number of Passengers'], model='additive', period=30)

plt.rcParams.update({'figure.figsize' : (16, 12)})
multiplicative_decomposition.plot().suptitle('Multiplicative_decomposition', fontsize=16)
plt.tight_layout(rect=[0, 0.03, 1, 0.95])

additive_decomposition.plot().suptitle('Additive Decomposition', fontsize=16)
plt.tight_layout(rect=[0, 0.03, 1, 0.95])

plt.show()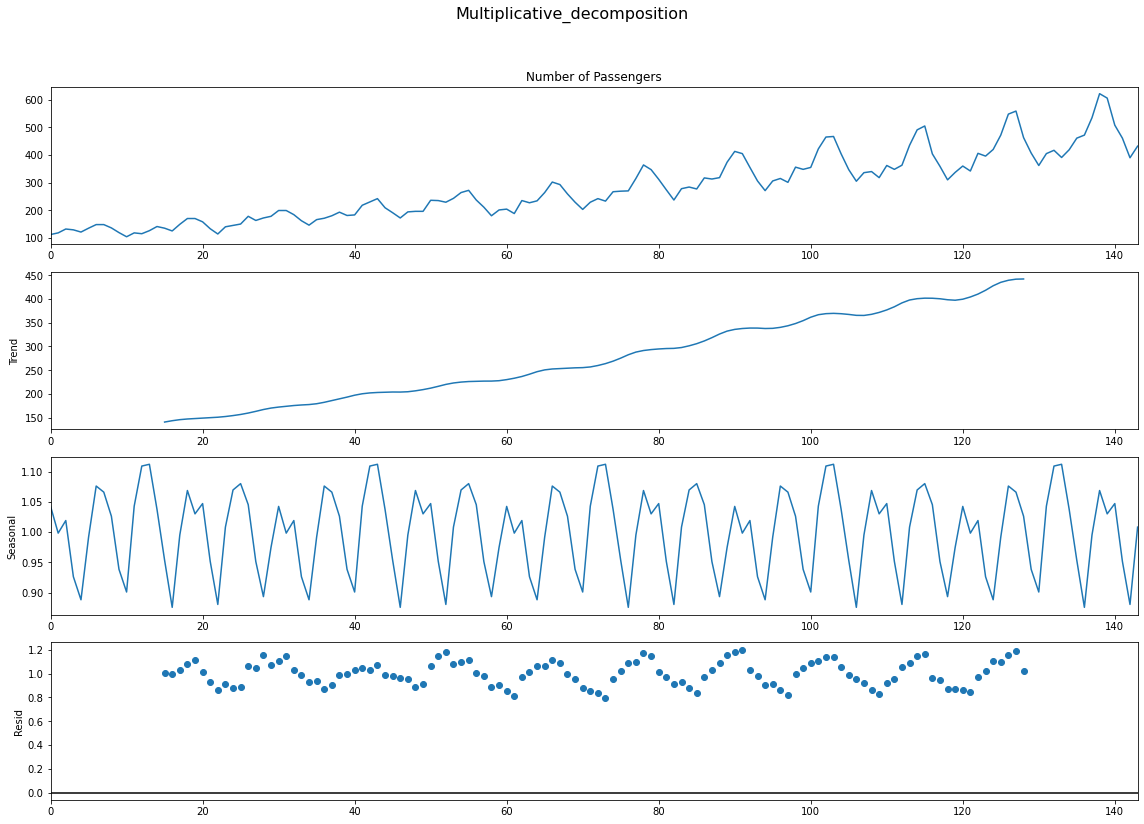
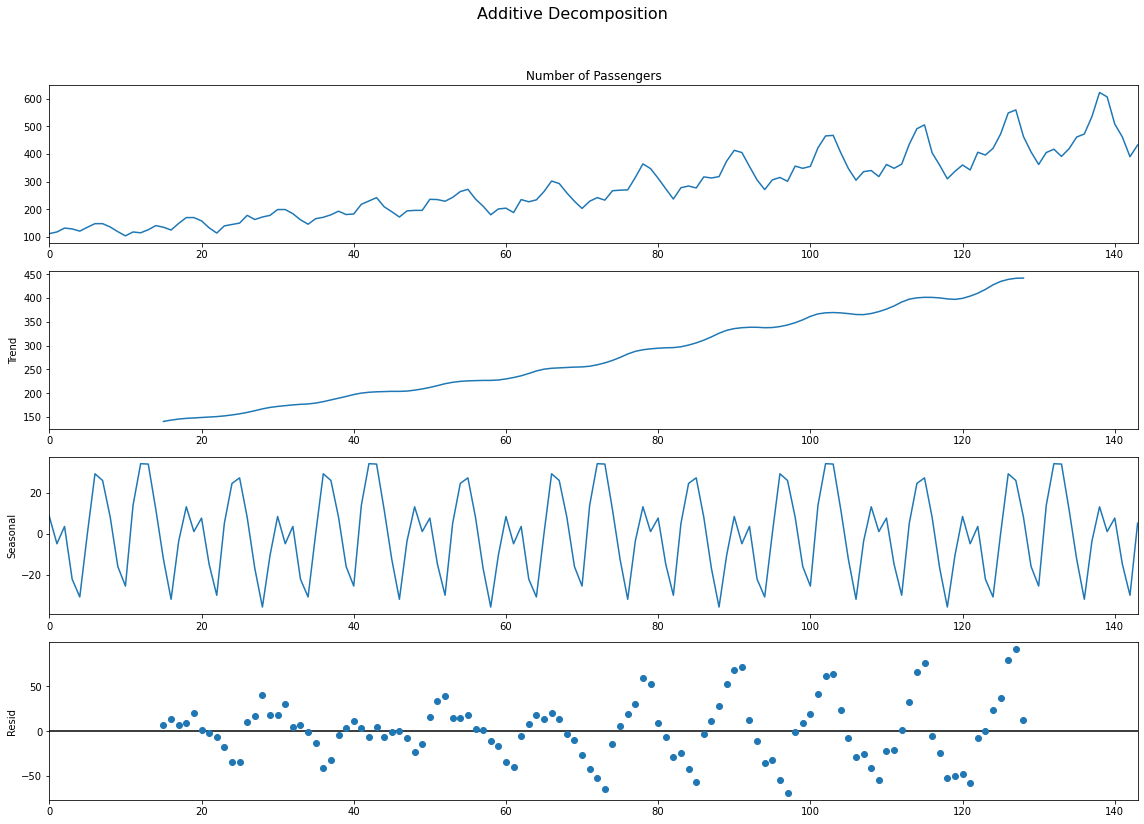
Addititive와 Multiplicative의 잔차 그래프를 보자. Additive는 일정한 패턴을 지니며 증가하고 있는 반면에, 애매하지만 Multiplicative는 무작위성이 상대적으로 짙다.
결론적으로 이 데이터는 Mulitplicative 시계열 데이터임이 판명됬다.
정상화
거의 대다수의 시계열 데이터는 비정상성이다. 정상성 데이터는 평균, 분산, 자기상관이 시간에 따라 일정하다. 또한 계절적 영향에 독립적이다.
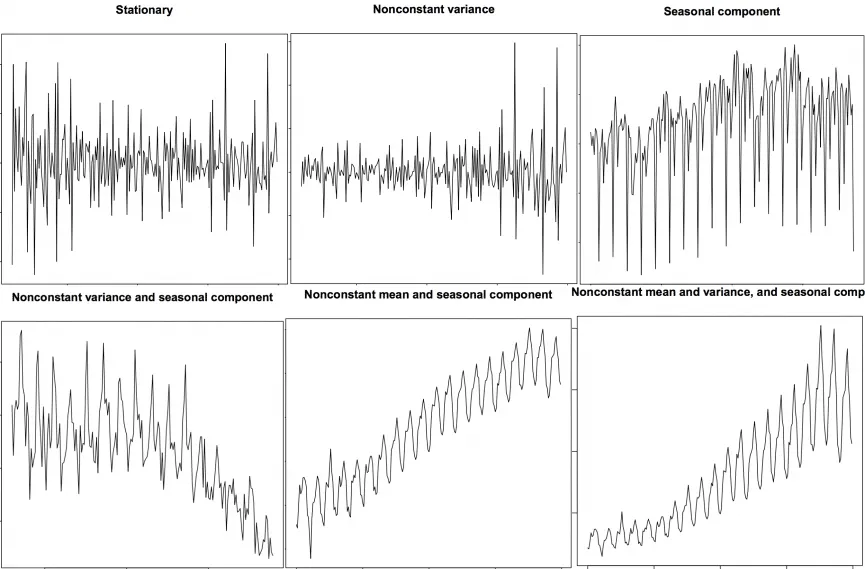
왜 비정상성 데이터는 쓸 수 없을까?
- 대부분의 통계학적 예측 방법은 정상성 시계열 데이터에 맞게 디자인되어 있다.
- 정상화 데이터 예측이 상대적으로 쉽고 안정적이다.
- AR모델은 본질적으로 선형회귀 모델이다. 이는 자기 자신의 시차를 예측 변수로 사용한다.
- 선형 회귀는 설명변수가 상관관계가 없을 때 성능이 좋다. 정상화는 자기상관이 제거되어 예측 모델의 설명변수가 독립적으로 만들어진다.
따라서 시계열 데이터 예측의 첫 단계는 비정상성 데이터를 정상성 데이터로 변환하는 것이라고 할 수 있다.
그렇다면 정상화 방법은 뭐가 있을까.
- 시계열 데이터 차분
- 로그 스케일링
- nth 루트화
- 위의 방법들의 조합
그러나 보통 차분을 많이 사용한다. 이것이 가장 간편한 방법이기 때문이다. 일반적으로 1번 또는 2번 차분하면 정상성 시계열 데이터로 변환된다.
차분(Differencing)
차분은 위에서 말했다시피 진짜 간단하다. 1차 차분 식을 봐보자.
Yt = Yt - Yt-1
식을 보듯이 그저 현재 값을 뒤로 미룬(?)값을 뺀 값이다. 1차 차분에서 정상화가 되지 않으면 2차 차분을 하면 된다.
예를 하나 들어서 일변량 데이터 10, 2, 4, 1, 7, 8가 있다고 하자.
- 1차 차분 :
2-10, 4-2, 1-4, 7-1, 8-7=-8, 2, -3, 6, 1 - 2차 차분 :
2+8, -3-2, 6+3=10, -5, 9
정상화 Test
- 시계열 시각화를 보고 판단하기.
- 시계열을 두개 이상으로 분리하고 통계학적으로 분석하여 평균, 분산, 자기상관을 파악한다. 이 통계량이 꽤 차이난다면 이는 정상화가 아니다.
- Unit Root(단위 근) Tests 사용하기(통계학적 테스트).
단위근이 정확히 무엇인지에 대해서는 아직 모르겠다. 허나 이는 확률변수와 밀접한 관계가 있으며, 확률변수가 안정적이지 않으면 회귀식 추정 때 잘못 추정할 수 있기 때문에 중요하다는 것은 알겠다. 따라서 안정적이지 않은 변수를 안정적으로 변화시켜준 후 회귀분석을 해야한다.
이번에 3개의 단위 근 Tests를 공부해보자.
1. ADF Test
이 방법은 주로 많이 사용하는 방법이다.
dftest = adfuller(df['Number of Passengers'], autolag='AIC')
df_output = pd.Series(dftest[0:4], index=['Test Statistic', 'p-value', '#Lag Used', 'Number of Observation Used'])
for key, value in dftest[4].items():
    df_output['Critical value (%s)'%key] = value

print(df_output)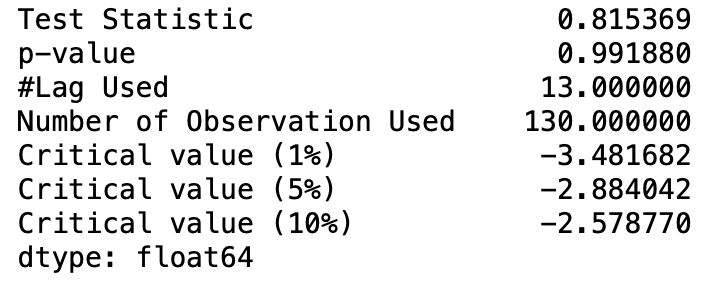
이 방법은 가설검정을 통한 테스트이다.
- 귀무가설 : 이 데이터는 비정상성이다.
- 대립가설 : 이 데이터는 정상성이다.
일반적인 가설검정처럼 P-value가 5% 이내면 대립가설을 채택한다.
2. Kwiatowski-Phillips-Schmidt-Shin-KPSS test
이 test는 ADF 테스트와는 반대다
- 귀무가설 : 이 데이터는 정상성이다.
- 대립가설 : 이 데이터는 비정상성이다.
from statsmodels.tsa.stattools import kpss

stats, p, lags, critical_value = kpss(df['Number of Passengers'], 'ct')

print(f'Test Statistics : {stats}')
print(f'p-value : {p}')
print(f'Critical Values : {critical_value}')
여기서 파라미터 ct는 무엇인가?
c: 만약 데이터가 평균을 중심으로 일정할 때 사용(default)ct: 데이터가 경향성을 가지고 있을 때

이 데이터는 p-value가 0.05아래이므로 대립가설을 채택, 즉 비정상성 데이터이다.
3. PP Test
PP Test 또한 단위근 테스트이다. 이는 시계열 분석에서 integrated of order 1의 가설검정을 위한 테스트이다. 이 테스트는 Dickey-Fuller 테스트의 가설검정을 근거로 한다.
백색잡음과 정상 시계열의 차이
- 정상 시계열 데이터에성 백색잡음 또한 시간에 대한 함수가 아니다. 그래서 평균과 분산은 시간에 따라 변화되지 않는다. 하지만 백색잡음은 완벽하게 평균 0인 랜덤이다. 백색잡음에는 패턴이 없다.
- 수학적으로, 평균이 0인 완전 난수 시퀀스가 백색잡음이다.
rand_num = np.random.randn(1000)
pd.Series(rand_num).plot(title='Random White Noise', color='b')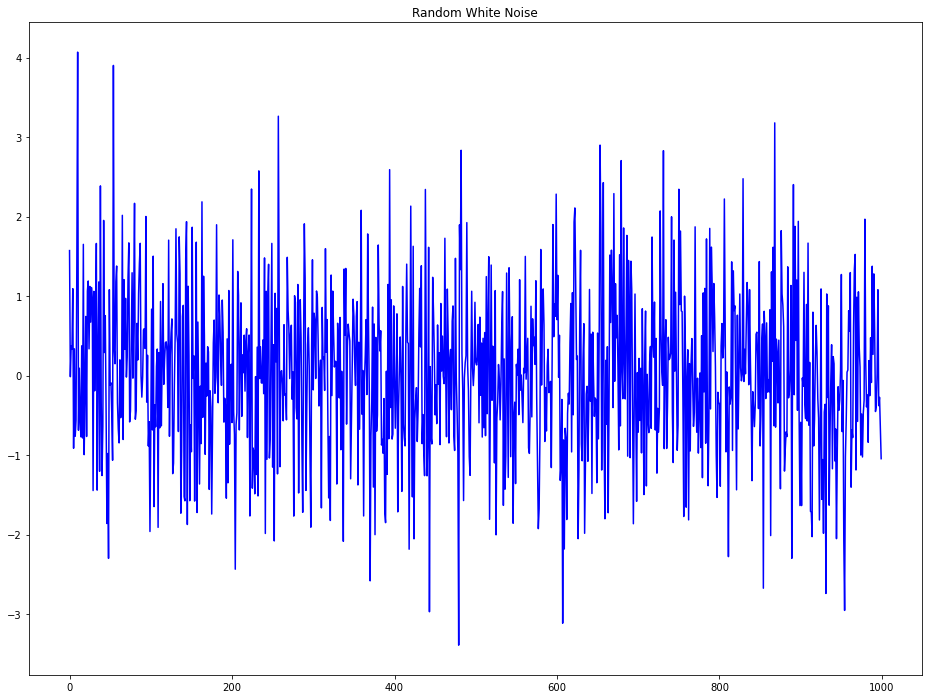
Trend 제거해보기(Detrend a Time Series)
Detrend는 시계열 데이터에서 경향성을 제거하는 방법이다. 이에 대한 방법은 여러가지가 있다.
- 시계열과 가장 잘 맞는 선을 추출한다. 이 선은 선형 회귀모델에서 얻을 수 있다. 복잡한 trend의 경우에는 2차항을 사용할 수 있다.
- 시계열 분해로부터 trend를 추출할 수 있다.
Baxter-King filter이나Hodrick-Prescott filter같은 filter을 사용한다. 이 방법으로 이동 평균 추세선 또는 순환 구성 요소를 제거한다.
1. Using scipy
scipy방법은 시계열 데이터와 가장 잘 맞는 선을 추출하는 방법이다.(첫번째 방법)
from scipy import signal
detrended = signal.detrend(df['Number of Passengers'].values)
plt.plot(detrended)
plt.title('Air Passengers detrended by subtracting the least squares fit', fontsize=16)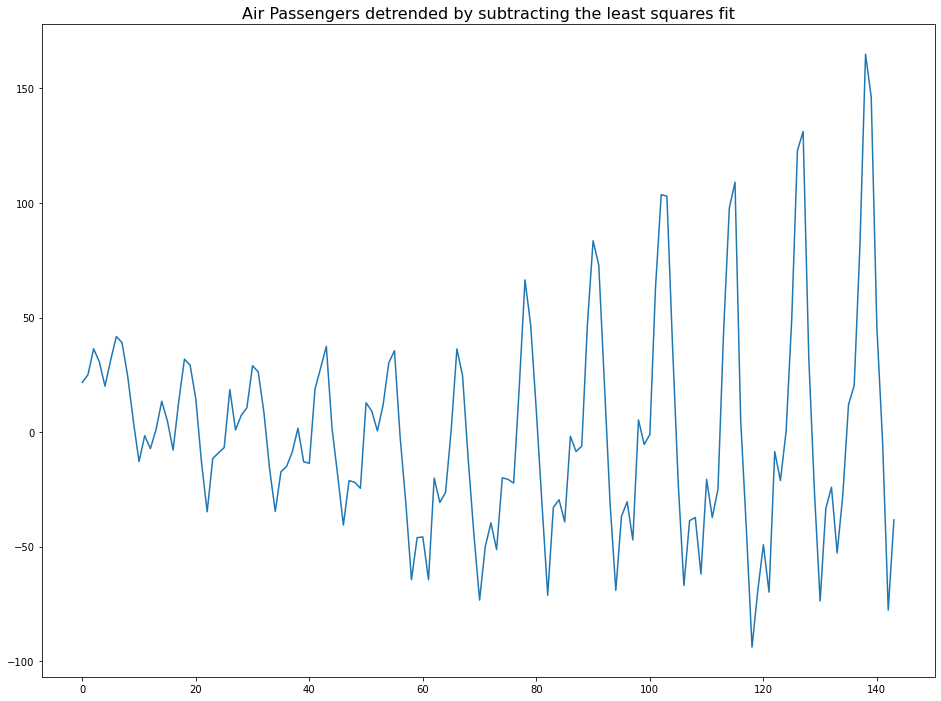
Using Statsmodels
이는 두번째 방법으로 Trend 요소를 추출하는 방법이다.
result_mul = seasonal_decompose(df['Number of Passengers'], model='multiplicative', period=30)
detrended = df['Number of Passengers'] - result_mul.trend
plt.plot(detrended)
plt.title('Air Passengers detrended by subtracting the trend component', fontsize=16)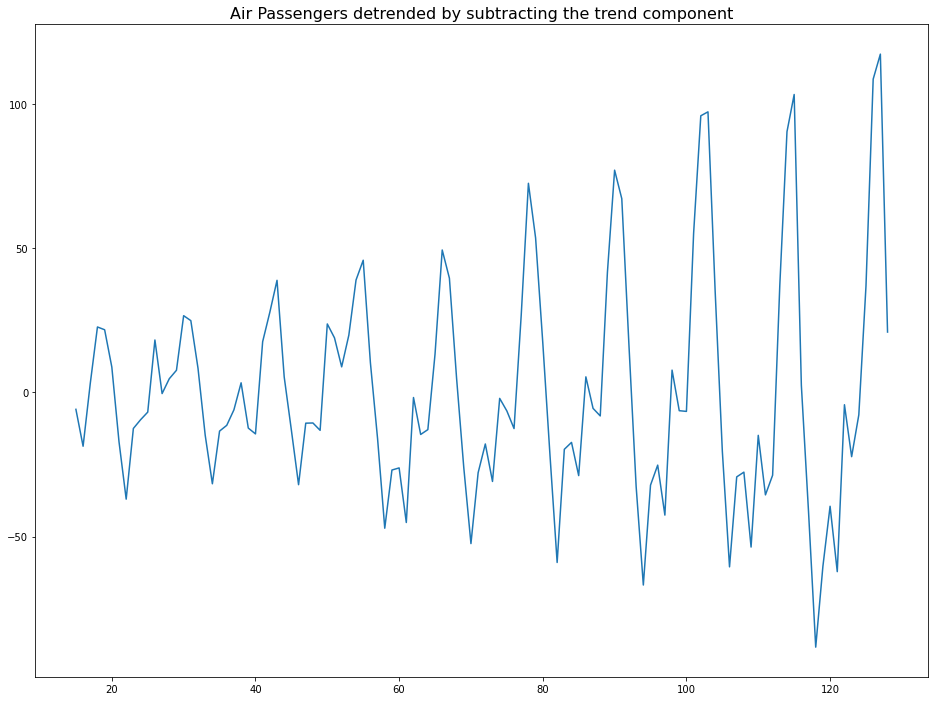
주관적 방법
kaggle 노트북을 보다가 알아낸 방법이다. 이동평균을 구하고 이를 시계열 데이터에서 뺀다.
logscaleL=stationarypart(L1)+trend(LT)
movingavgoflogscaleA=stationarypart(A1)+trend(AT)
resultseriesR=L−A=(L1+LT)−(A1+AT)=(L1−A1)+(LT−AT)
계절성 제거
계절성을 제거하는 몇가지 방법이 있다.
- 계절성 Window에 맞는 길이로 이동평균하기
- 계절성 차분 이용하기
- 시계열 데이터를 분해로 얻은 계절성으로 나누기
result_mul = seasonal_decompose(df['Number of Passengers'], model='multiplicative', period=30)

deseasonalized = df['Number of Passengers'].values / result_mul.seasonal

plt.plot(deseasonalized)
plt.title('Air Passengers Deseasonalized', fontsize=16)
plt.plot()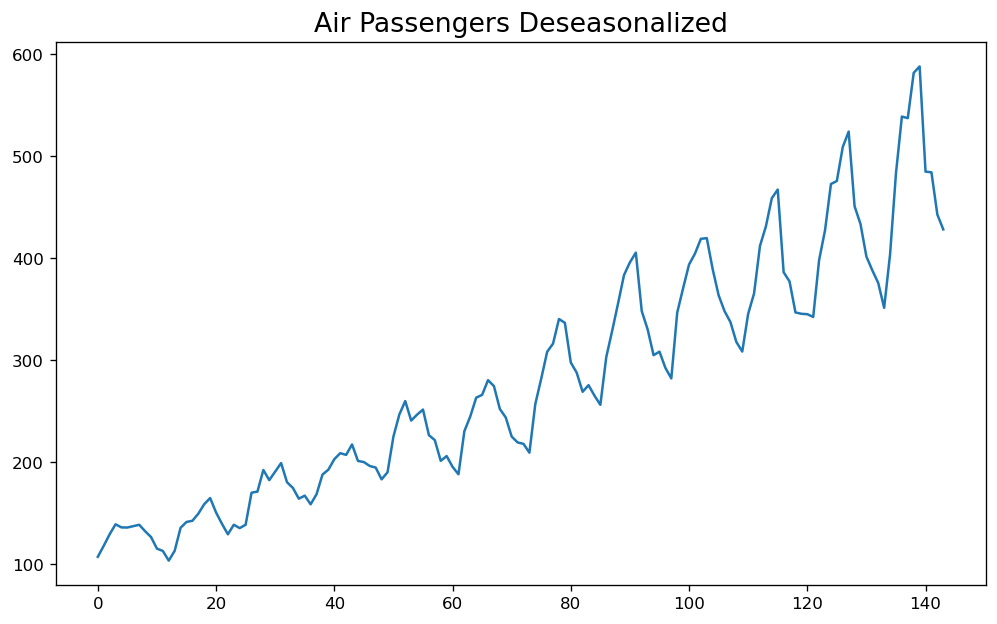
계절성 테스트
시계열 데이터에서 계절성을 테스트하는 가장 보편적인 방법은 plot화 해서 일정 기간안에 반복적인 패턴이 있는지 확인하는 것이다.
- Hours of day
- Day of month
- Weekly
- Monthly
- Yearly
그러나, 더 정확한 관측을 하고 싶다면 ACF 그래프를 이용하면 된다. 만약 강한 계절적 패턴이 있다면, ACF 그래프에서 다수의 게절적 window에서 반복적인 spikes가 나타날 것이다.
from pandas.plotting import autocorrelation_plot

plt.rcParams.update({'figure.figsize':(10, 6), 'figure.dpi':120})
autocorrelation_plot(df['Number of Passengers'].tolist())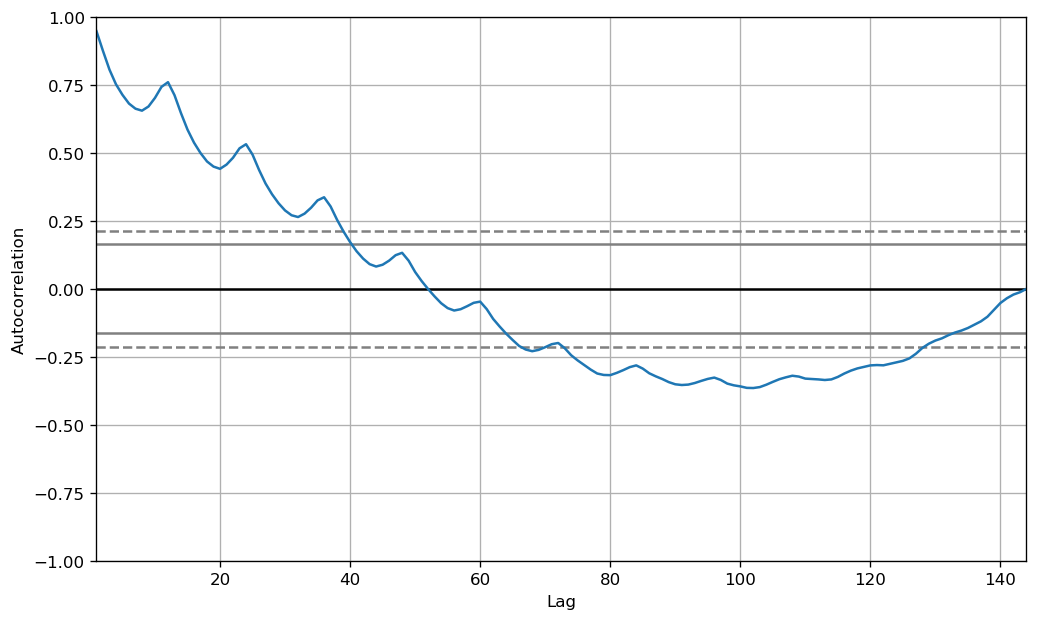
통계학적인 테스트로는 CH Test가 있다.
ACF & PCAF
- ACF : ACF는 자기 자신의 시차를 가지고 자기상관을 한 것이다. 자기상관계수가 크다면, 그 시계열 데이터는 이전의 값으로 미래를 예측하는데 도움이 될 것이다. 자기상관이 크다는 것은 일정한 패턴이 있기 때문이다.
- PACF : PACF도 유사한 정보를 전달하지만 중간의 시차로부터 기여받은 자기상관을 제외하고 순수한 시계열과 시차에 대한 자기상관을 제공한다.
즉, 어떤 것들에 대한 상관관계를 보려고 할 때, 그에 영향을 주는 요소들을 제외하고 상관관계를 볼 때 PACF 를 이용한다는 것이다.
예를 들어서 x라는 변수와 y라는 현상이 상관관계가 있을 때 실제로는 다른 이유인 z에 의해서 y현상이 영향을 끼치는 것이지만, 이를 제외하고 순수하게 x와 y의 상관관계만 보는 것이다.
from statsmodels.tsa.stattools import acf, pacf
from statsmodels.graphics.tsaplots import plot_acf, plot_pacf

fig, ax = plt.subplots(1, 2, figsize=(16, 3), dpi=100)
plot_acf(df['Number of Passengers'].tolist(), lags=50, ax=ax[0])
plot_pacf(df['Number of Passengers'].tolist(), lags=50, ax=ax[1])
Lag Plots
Lag Plots은 자체 Lag에 대한 시계열의 산점도이다. 이것은 일반적으로 자기상관을 체크하기 위해 사용된다. 만약 어떠한 패턴이 존재한다면, 그 시계열은 자기상관이 존재한다는 뜻이다. 패턴이 없다면, 시계열은 랜덤 백색 소음일 가능성이 있다.
이에 대한 자세한 설명은 여기서 볼 수 있다. 유투브 강의도 있다.
from pandas.plotting import lag_plot
plt.rcParams.update({'ytick.left' : False, 'axes.titlepad' : 10})

fig, axes = plt.subplots(1, 4, figsize=(10, 3), sharex=True, sharey=True, dpi=100)
for i, ax in enumerate(axes.flatten()[:4]):
    lag_plot(df['Number of Passengers'], lag=i+1, ax=ax, c='firebrick')
    ax.set_title('Lag' + str(i+1))

fig.suptitle('Lag Plots of Air Passengers', y=1.05)
plt.show()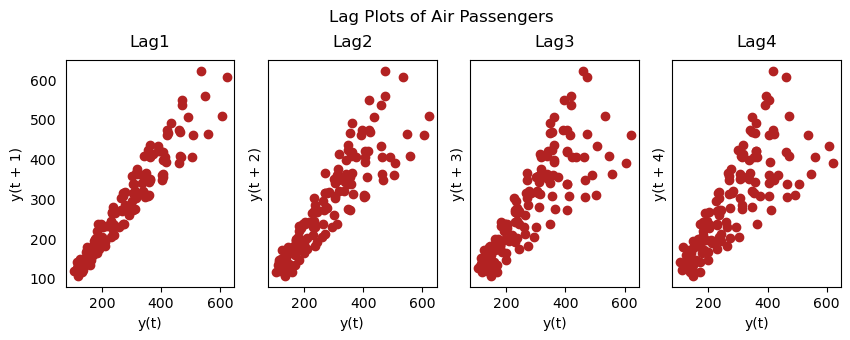
Granger Causality Test
- 그레인저 인과관계란 이전 시차 독립변수들이 종속변수를 예측하는데 통계적으로 유의미함을 의미한다. 즉, 한 변수의 변화가 시차를 두고 다른 변수에 영향을 미치는 경우이다. 이는 x(설명변수)가 y(목표변수)의 원인이라는 가정하에, y의 이전 값과 x의 이전 값을 기반으로 한 y의 예측이 y의 이전 값만으로 한 예측을 능가한다는 생각을 기반으로 한다.
- Granger Causality Test는 y의 lag에 대해서 테스트 하는 것이 아니다. 이 테스트는 일반적으로 외적인 요인 변수(not y lag)에만 사용된다.
- Granger Test는 2D array를 받는다. 첫번째 컬럼에는 value를, 두번째 컬럼에는 설명변수(x)를 둔다. 귀무가설은
두번째 컬럼의 변수는 첫번째 값에 대해 그랜저 인과관계를 이루지 않는다이다. 만약 p-value가 5% 이내라면 귀무가설은 기각되고 lag of x는 유용하다라는 것을 의미한다.
from statsmodels.tsa.stattools import grangercausalitytests
data = pd.read_csv('dataset.txt')
data['date'] = pd.to_datetime(data['date'])
data['month'] = data.date.dt.month
grangercausalitytests(data[['value', 'month']], maxlag=2)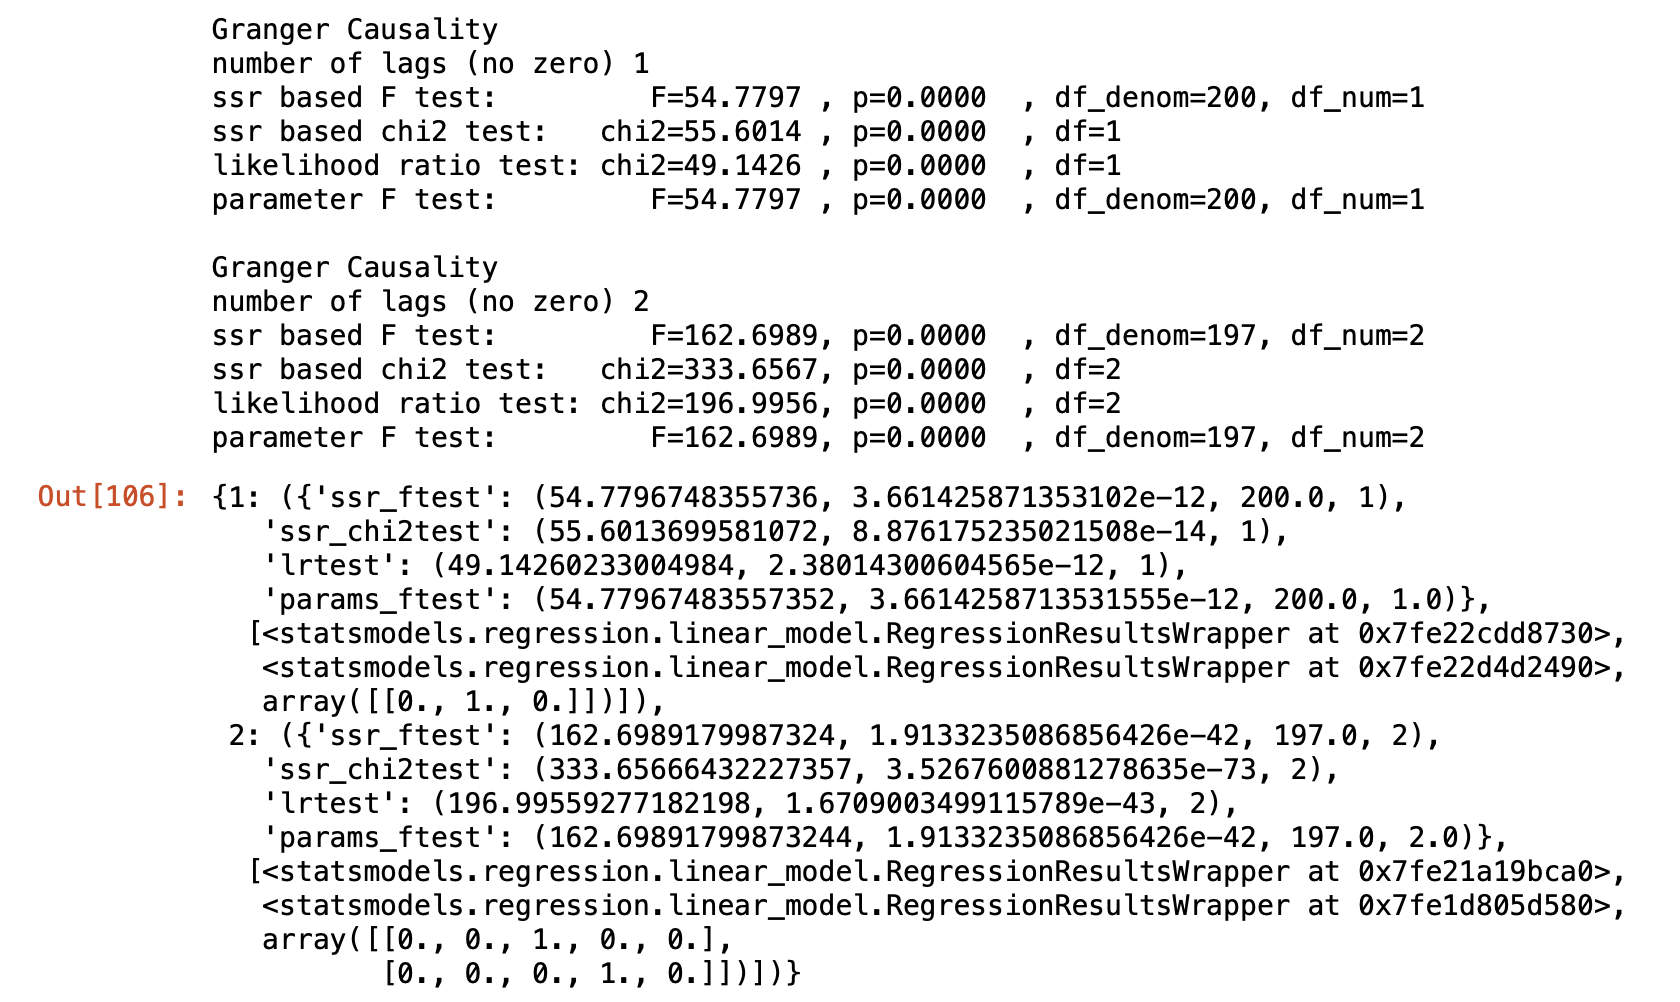
이 결과로 봤을 때 모든 p-value가 0이므로 귀무가설은 기각. month는 미래를 예측하는데 사용될 수 있다.
시계열 평활화(smoothening)
시계열을 평활화하는 것은 다음의 상황에서 유용하다.
- signal에서 노이즈의 영향을 줄이면 노이즈 필터링된 시계열의 근사치를 얻을 수 있다.
- 평활화된 시계열 버전은 오리지널 시계열을 설명하는데 사용된다.
- 근본적인 추세를 더 잘 시각화 할 수 있다.
그럼 어떻게 평활화를 하느냐.
- 이동평균 사용
- 로컬 회귀 사용(LOESS 평활화)
- 로컬 가중 회귀 사용 (LOWESS 평활화)
이동 평균
이동 평균은 정의된 넓이의 window로 이동하면서 평균을 내는 기법이다. 이 넓이를 현명하게 선택해야 한다. 만약 엄청 넓은(12달?) window로 이동 평균을 낸다면 과도하게 smooth한 시계열이 될 것이다. seasonal 영향을 무효화 하기 때문이다.
Localized Regression
LOESS는 여러 회귀를 각 포인트의 인접한 부근에 적용한다. 이 방법은 전체 데이터 중 local 부분에 최소제곱회귀를 적용하는 비모수적 방법으로 수치 벡터들을 평활하기에 적합한 방법이다.
이에 대한 부분은 여기서 확인하자.
