0. Olivetti Faces 데이터 로드
fetch_olivetti_faces()를 사용해 데이터 로드
from sklearn.datasets import fetch_olivetti_faces

faces_all = fetch_olivetti_faces()
out:
{'data': array([[0.30991736, 0.3677686 , 0.41735536, ..., 0.15289256, 0.16115703,
         0.1570248 ],
        [0.45454547, 0.47107437, 0.5123967 , ..., 0.15289256, 0.15289256,
         0.15289256],
        [0.3181818 , 0.40082645, 0.49173555, ..., 0.14049587, 0.14876033,
         0.15289256],
        ...,
        [0.5       , 0.53305787, 0.607438  , ..., 0.17768595, 0.14876033,
         0.19008264],
        [0.21487603, 0.21900827, 0.21900827, ..., 0.57438016, 0.59090906,
         0.60330576],
        [0.5165289 , 0.46280992, 0.28099173, ..., 0.35950413, 0.3553719 ,
         0.38429752]], dtype=float32),
 'images': array([[[0.30991736, 0.3677686 , 0.41735536, ..., 0.37190083,
          0.3305785 , 0.30578512],...
  ....
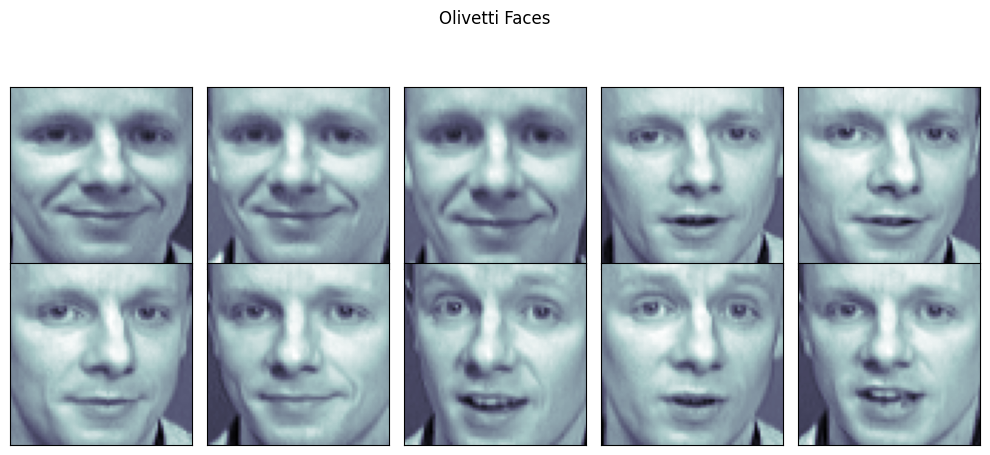
1. Olivetti Faces 데이터 로드 및 시각화
- 특정 인물(k=20)의 이미지만 필터링하여 2x5 형식으로 출력
plt.subplots_adjust()를 활용해 subplot 간격 조정ax.imshow()를 사용하여 얼굴 이미지 표시
import matplotlib.pyplot as plt

k = 20
faces = faces_all.images[faces_all.target == k]

N = 2
M = 5

fig = plt.figure(figsize=(10, 5))
plt.subplots_adjust(top=1, bottom=0, hspace=0, wspace=0.05)

for n in range(N * M):
    ax = fig.add_subplot(N, M, n + 1)
    ax.imshow(faces[n], cmap=plt.cm.bone)
    ax.grid(False)
    ax.xaxis.set_ticks([])
    ax.yaxis.set_ticks([])

plt.suptitle('Olivetti Faces')
plt.tight_layout()
plt.show()
out:
2. PCA 적용 및 복원
PCA(n_components=2)를 사용해 주성분 2개 추출- 원본 데이터를 변환하여 차원 축소 수행
inverse_transform()을 사용해 원본 데이터로 복원
from sklearn.decomposition import PCA

pca = PCA(n_components=2)
X = faces_all.data[faces_all.target==k]
w = pca.fit_transform(X)
X_inv = pca.inverse_transform(w)
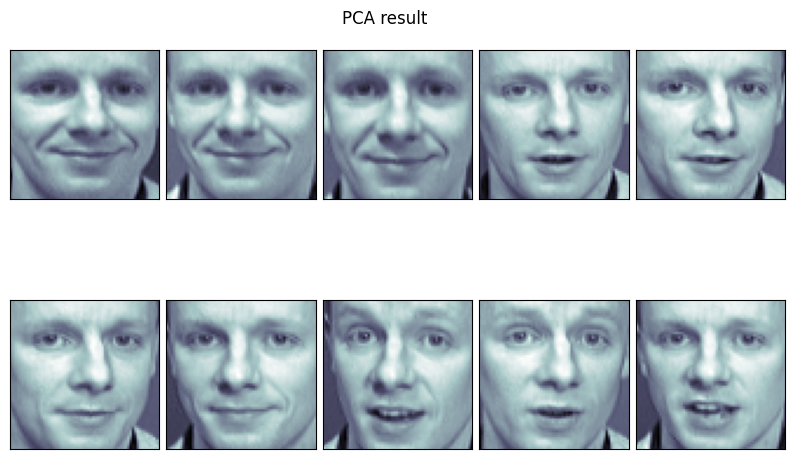
3. PCA 변환 결과 시각화
ax.imshow()를 사용해 PCA 변환 후 이미지를 출력plt.suptitle('PCA result')를 추가하여 그래프 제목 설정
fig = plt.figure(figsize=(10, 5))
plt.subplots_adjust(top=1, bottom=0, hspace=0, wspace=0.05)

for n in range(N * M):
    ax = fig.add_subplot(N, M, n + 1)
    ax.imshow(faces[n], cmap=plt.cm.bone)
    ax.grid(False)
    ax.xaxis.set_ticks([])
    ax.yaxis.set_ticks([])

plt.suptitle('PCA result')
plt.tight_layout()
plt.show()
out:
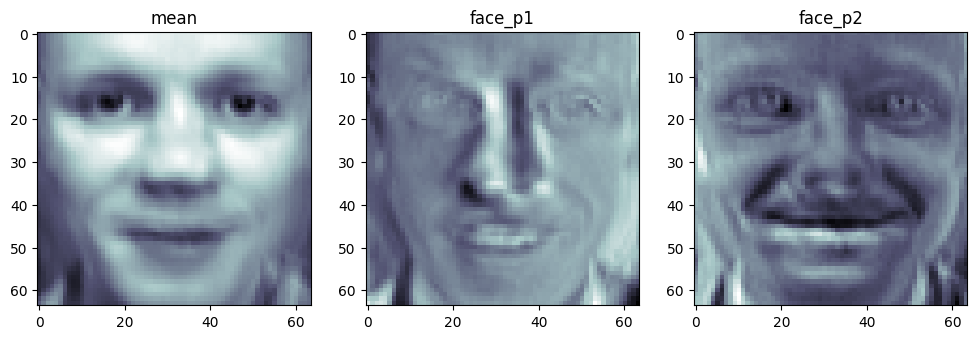
4. 평균 얼굴 및 주성분 시각화
pca.mean_을 사용해 평균 얼굴 출력pca.components_에서 주성분 2개를 가져와 시각화
face_mean = pca.mean_.reshape(64,64)
face_p1 = pca.components_[0].reshape(64,64)
face_p2 = pca.components_[1].reshape(64,64)

plt.figure(figsize=(12,7))
plt.subplot(131)
plt.imshow(face_mean, cmap=plt.cm.bone)
plt.title('mean')
plt.subplot(132)
plt.imshow(face_p1, cmap=plt.cm.bone)
plt.title('face_p1')
plt.subplot(133)
plt.imshow(face_p2, cmap=plt.cm.bone)
plt.title('face_p2')
plt.show()
out:
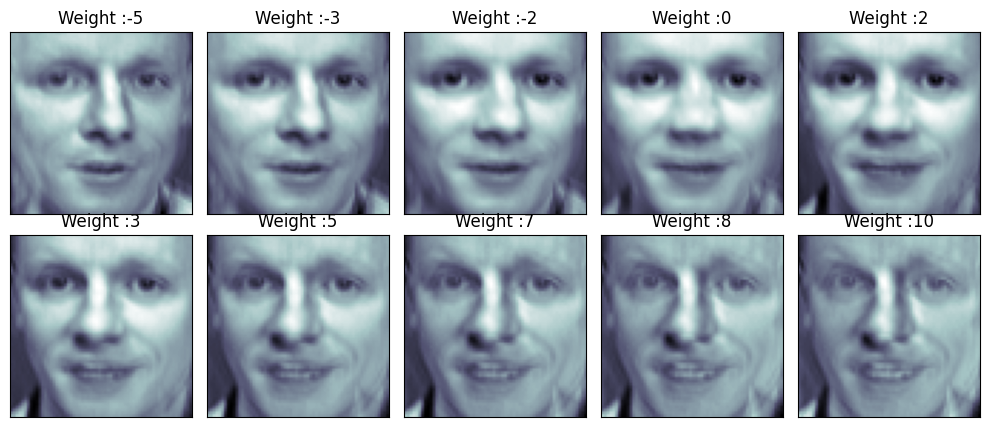
5. 주성분 가중치 변화를 통한 얼굴 변형
np.linspace()를 활용해 가중치 범위 설정- 첫 번째 주성분(face_p1)을 적용해 얼굴 변형 시각화
import numpy as np
fig = plt.figure(figsize=(10,5))
plt.subplots_adjust(top=1, bottom=0, hspace=0, wspace=0.05)
N=2; M=5
w = np.linspace(-5,10,N*M)

for n in range(N*M):
    ax = fig.add_subplot(N,M,n+1)
    ax.imshow(face_mean+w[n]*face_p1, cmap=plt.cm.bone)
    ax.grid(False)
    plt.xticks([])
    plt.yticks([])
    plt.title('Weight :' + str(round(w[n])))

plt.tight_layout()
plt.show()
out:
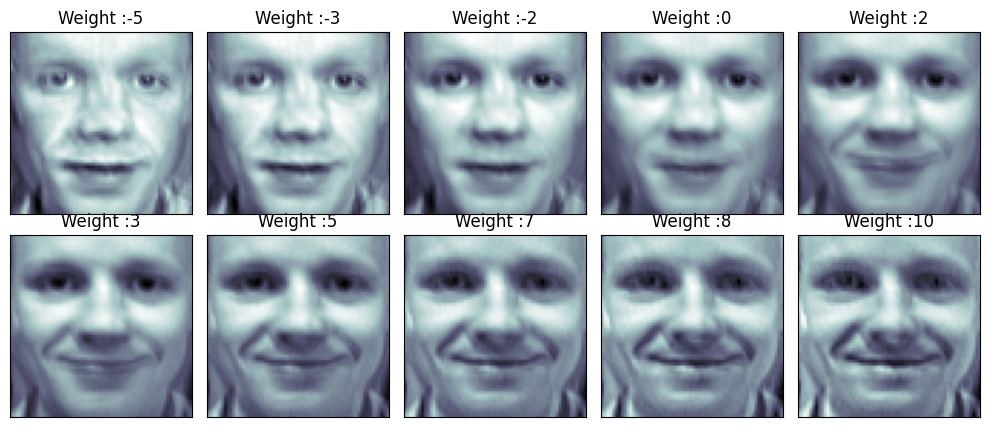
6. 두 번째 주성분 적용
face_p2를 활용해 얼굴 변형 결과 확인
fig = plt.figure(figsize=(10,5))
plt.subplots_adjust(top=1, bottom=0, hspace=0, wspace=0.05)
w = np.linspace(-5,10,N*M)

for n in range(N*M):
    ax = fig.add_subplot(N,M,n+1)
    ax.imshow(face_mean+w[n]*face_p2, cmap=plt.cm.bone)
    ax.grid(False)
    plt.xticks([])
    plt.yticks([])
    plt.title('Weight :' + str(round(w[n])))

plt.tight_layout()
plt.show()
out:
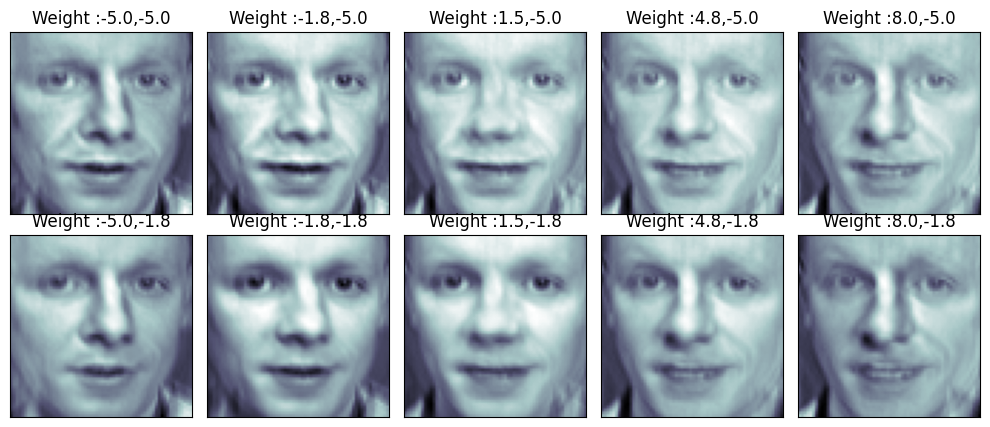
7. 주성분 2개를 동시에 적용한 얼굴 변형
np.meshgrid()를 활용해 두 주성분의 조합 생성face_mean + w1 * face_p1 + w2 * face_p2로 얼굴 생성
nx,ny = (5,5)
x = np.linspace(-5,8,nx)
y = np.linspace(-5,8,ny)
w1,w2 = np.meshgrid(x,y)
w1 = w1.reshape(-1,) # 5x5 -> 25x1
w2 = w2.reshape(-1,) # 5x5 -> 25x1

fig = plt.figure(figsize=(10,5))
plt.subplots_adjust(top=1, bottom=0, hspace=0, wspace=0.05)

for n in range(N*M):
    ax = fig.add_subplot(N,M,n+1)
    ax.imshow(face_mean+w1[n]*face_p1+w2[n]*face_p2, cmap=plt.cm.bone)
    ax.grid(False)
    plt.xticks([])
    plt.yticks([])
    plt.title('Weight :' + str(round(w1[n],1))+','+str(round(w2[n],1)))

plt.tight_layout()
plt.show()
out:
결론
- Olivetti Faces 데이터셋을 PCA로 분석하여 주성분을 추출함
- 평균 얼굴 및 주성분을 활용해 얼굴 변형을 시각화함
- 주성분 가중치를 조절하여 얼굴 이미지의 변화를 확인함
- PCA를 통한 얼굴 데이터의 특징 벡터를 활용할 수 있음

gpt로 다시 배우는 개발