
-
Transformer
-
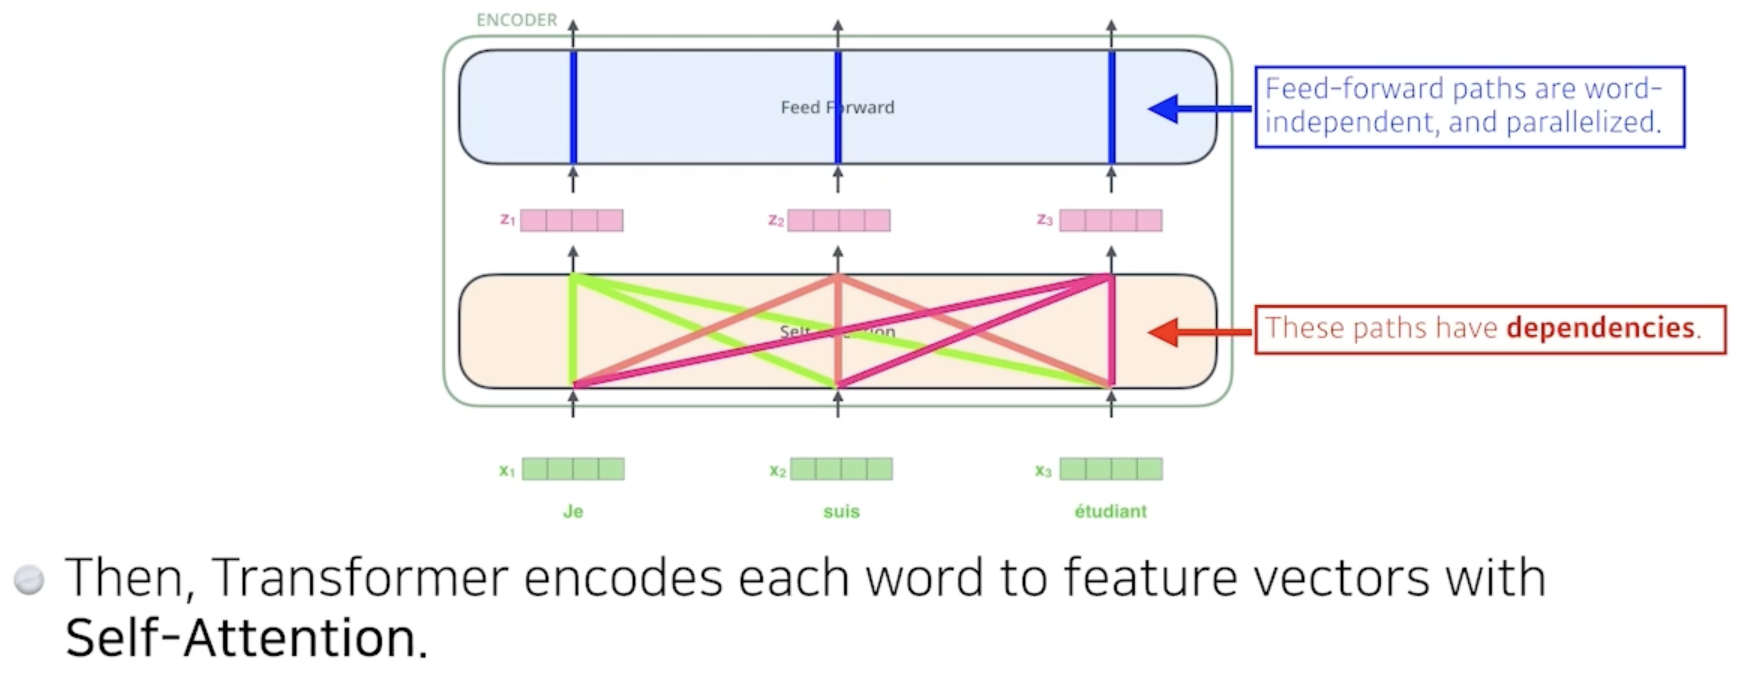
Encoder(Self-Attention)에서 RNN과 다르게 여러개의 단어를 한번에 처리 가능
-
-
Self-Attention의 경우 하나의 벡터를 임베딩할 때 해당 벡터만을 사용하는 것이 아닌 모든 input값을 사용한다.
-
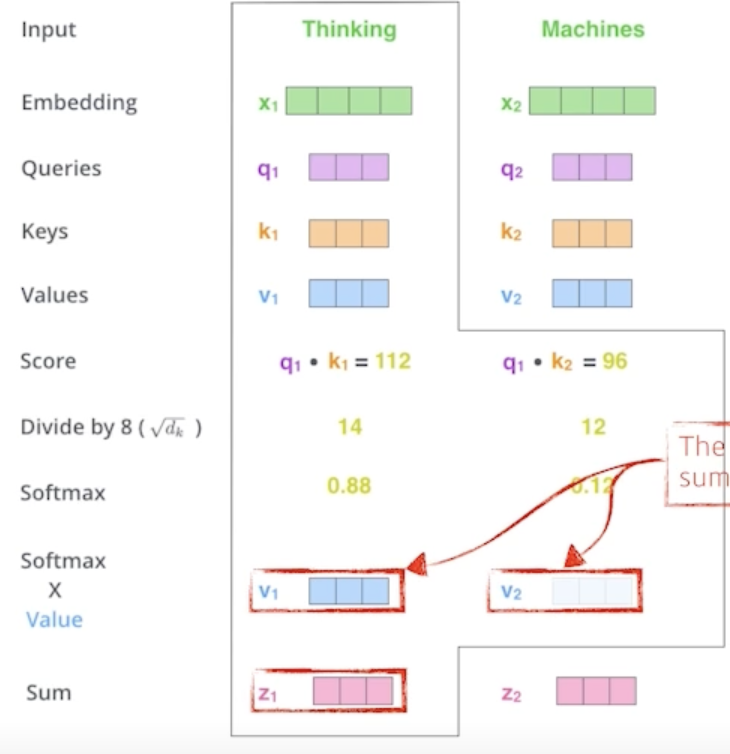
Self-Attention : Queries, Keys, Values vectors are computed per each word(=embedding)
-
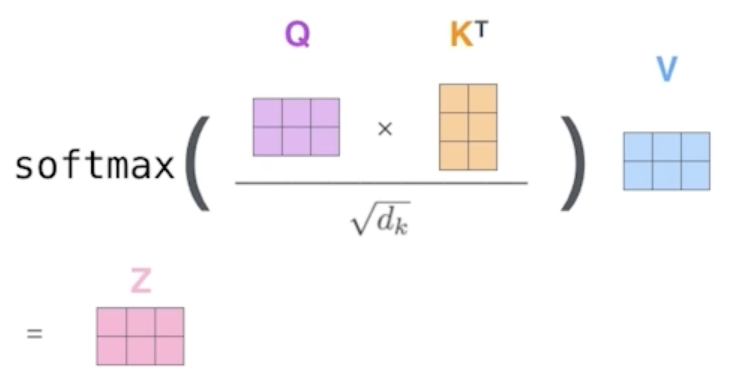
Q,K,V를 통해 Score vector를 구한다.
- 해당 Score vector을 통해 다른 단어와의 연관성을 구한다.
-
-
-
입력 값이 달라지면 Imbedding vector가 달라지기에 보다 flexible한 모델
-
computation cost :
-
Multi-headed attention(MHA) : 하나의 input에 대해 여러개의 Q,K,V를 만듦
-
Transforemr transfers K,V to Decorders
-
Output sequence is generated in an autoregressive manner
-
학습 단계에서는 decoder에서 masking을 사용한다.
-
- Generative Models
- 이미지를 통해 확률 분포 을 학습한다.
- Generation : 우리가 ~ 을 샘플한다면, 은 input 이미지와 비슷해야한다.
- Densitiy estimation : should be high if x looks like a input image, and low otherwise
- This is also known as explicit models
- explicit : 현재 알고있는 시스템의 상태로부터 미래 시간의 시스템의 상태를 계산, 새로운 입력에 대해 모델링 하는 것과 얼마나 likely한지 density를 구할 수 있는 모델
- implicit : 현재와 미래 시스템의 상태로부터 미래 시간의 시스템의 상태를 계산
- This is also known as explicit models
- Example
- Suppose we have of n binary pixels
- Number of cases?
- How many parameters do we need to specify?
- Number of cases?
- What if are independent, then
- =
- Number of cases?
- How many parameters do we need to specify?
- 개의 Parameters가 필요한 확률분포 학습을 하기에는 데이터가 너무 많이 필요하다.
- 그렇다고 독립을 가정하여 개의 Parameters를 사용하면 모델의 표현범위가 너무 작다.
- 그렇기에 그 중간인 Conditional Independence를 사용한다.
- Conditional Independence
- Chain rule
- Bayes'rule
- Conditional independence
- Markov assumption을 적용하여 개의 Parameters
- Suppose we have of n binary pixels
- Autoregressive Model
- Suppose binary pixels
- Our goal is to learn over
- Chain rule, Markove assumption을 통해
- This is called an autoregressive model
- Note that we need an ordering of all random variables
- Easy to sample but in a sequentail manner, slow
- Easy to compute probability(explicit) # GAN is implicit
- Maximum Likelihood Learning
- finding best-approximating density model from the model family
- how can we evaluate the goodness of the approximation
- 이미지를 통해 확률 분포 을 학습한다.
Data Viz
- 데이터 시각화란 데이터를 그래픽 요소로 매핑하여 시각적으로 표현하는 것
- 시각화는 다양한 요소가 포함된 Task
- 목적
- 독자
- 데이터
- 스토리
- 방법
- 디자인
- 데이터의 종류는 대표적으로 4가지로 분류
- 수치형
- 연속형 : 길이, 무게, 온도 등
- 이산형 : 주사위, 눈금, 사람 수 등
- 범주형
- 명목형 : 혈액형, 종교 등
- 순서형 : 학년, 별점, 등급 등
- 수치형
- A mark is a basic graphical element in an image
- 점, 선, 면
- 각 마크를 변경할 수 있는 요소들이 존재한다.
- 위치, 모양, 사이즈, 색상 등
- 전주의적 속성(Pre-attentive Attribute)
- 주의를 주지 않아도 인지하게 되는 요소
- Length, Width, Size, Shape, contrast 등
- 동시에 사용하면 인지하기 어렵다.
- 적절하게 사용할 때, 시각적 분리
- Matplotlib
-
Figure라는 큰 틀에 ax라는 서브플롯을 추가해서 만든다(최소 1개)
# 서브플롯 추가 fig = plt.figure() ax = fig.add_subplot() plt.show() -
2개 이상 그리고 싶다면 위치를 지정
# 2개 이상 그리기 fig = plt.figure() ax = fig.add_subplot(1,2,1) ax = fig.add_subplot(1,2,2) -
한 서브플롯에서 여러 개 그리기
# 하나에 여러개 그리기 fig = plt.figure() ax = fig.add_subplot(1,1,1) # 동시에 그리면 색상이 자동적으로 구분된다. ax.plot([1,1,1]) ax.plot([1,2,3]) ax.plort({3,3,3]) plt.show() -
범례를 사용하기
# 범례 사용 fig = plt.figure() ax = fig.add_subplot(1,1,1) ax.plot([1, 1, 1], label='1') ax.plot([2, 2, 2], label='2') ax.plot([3, 3, 3], label='3') ax.set_title('Basic Plot') # 제목 추가 ax.legend() print(ax.get_title()) # 제목을 불러올 수 있음 plt.show() -
ticks : 축에 적히는 수 위치를 지정한다.
# ticks
fig = plt.figure()
ax = fig.add_subplot(111)

ax.plot([1, 1, 1], label='1')
ax.plot([2, 2, 2], label='2')
ax.plot([3, 3, 3], label='3')

ax.set_title('Basic Plot')
ax.set_xticks([0, 1, 2])
ax.set_xticklabels(['zero','one','two']) # 축에 적히는 텍스트 수정

ax.legend()
plt.show()
-
출처 : Naver BoostCamp

AI 새싹