1. 이변량 질적자료 분석
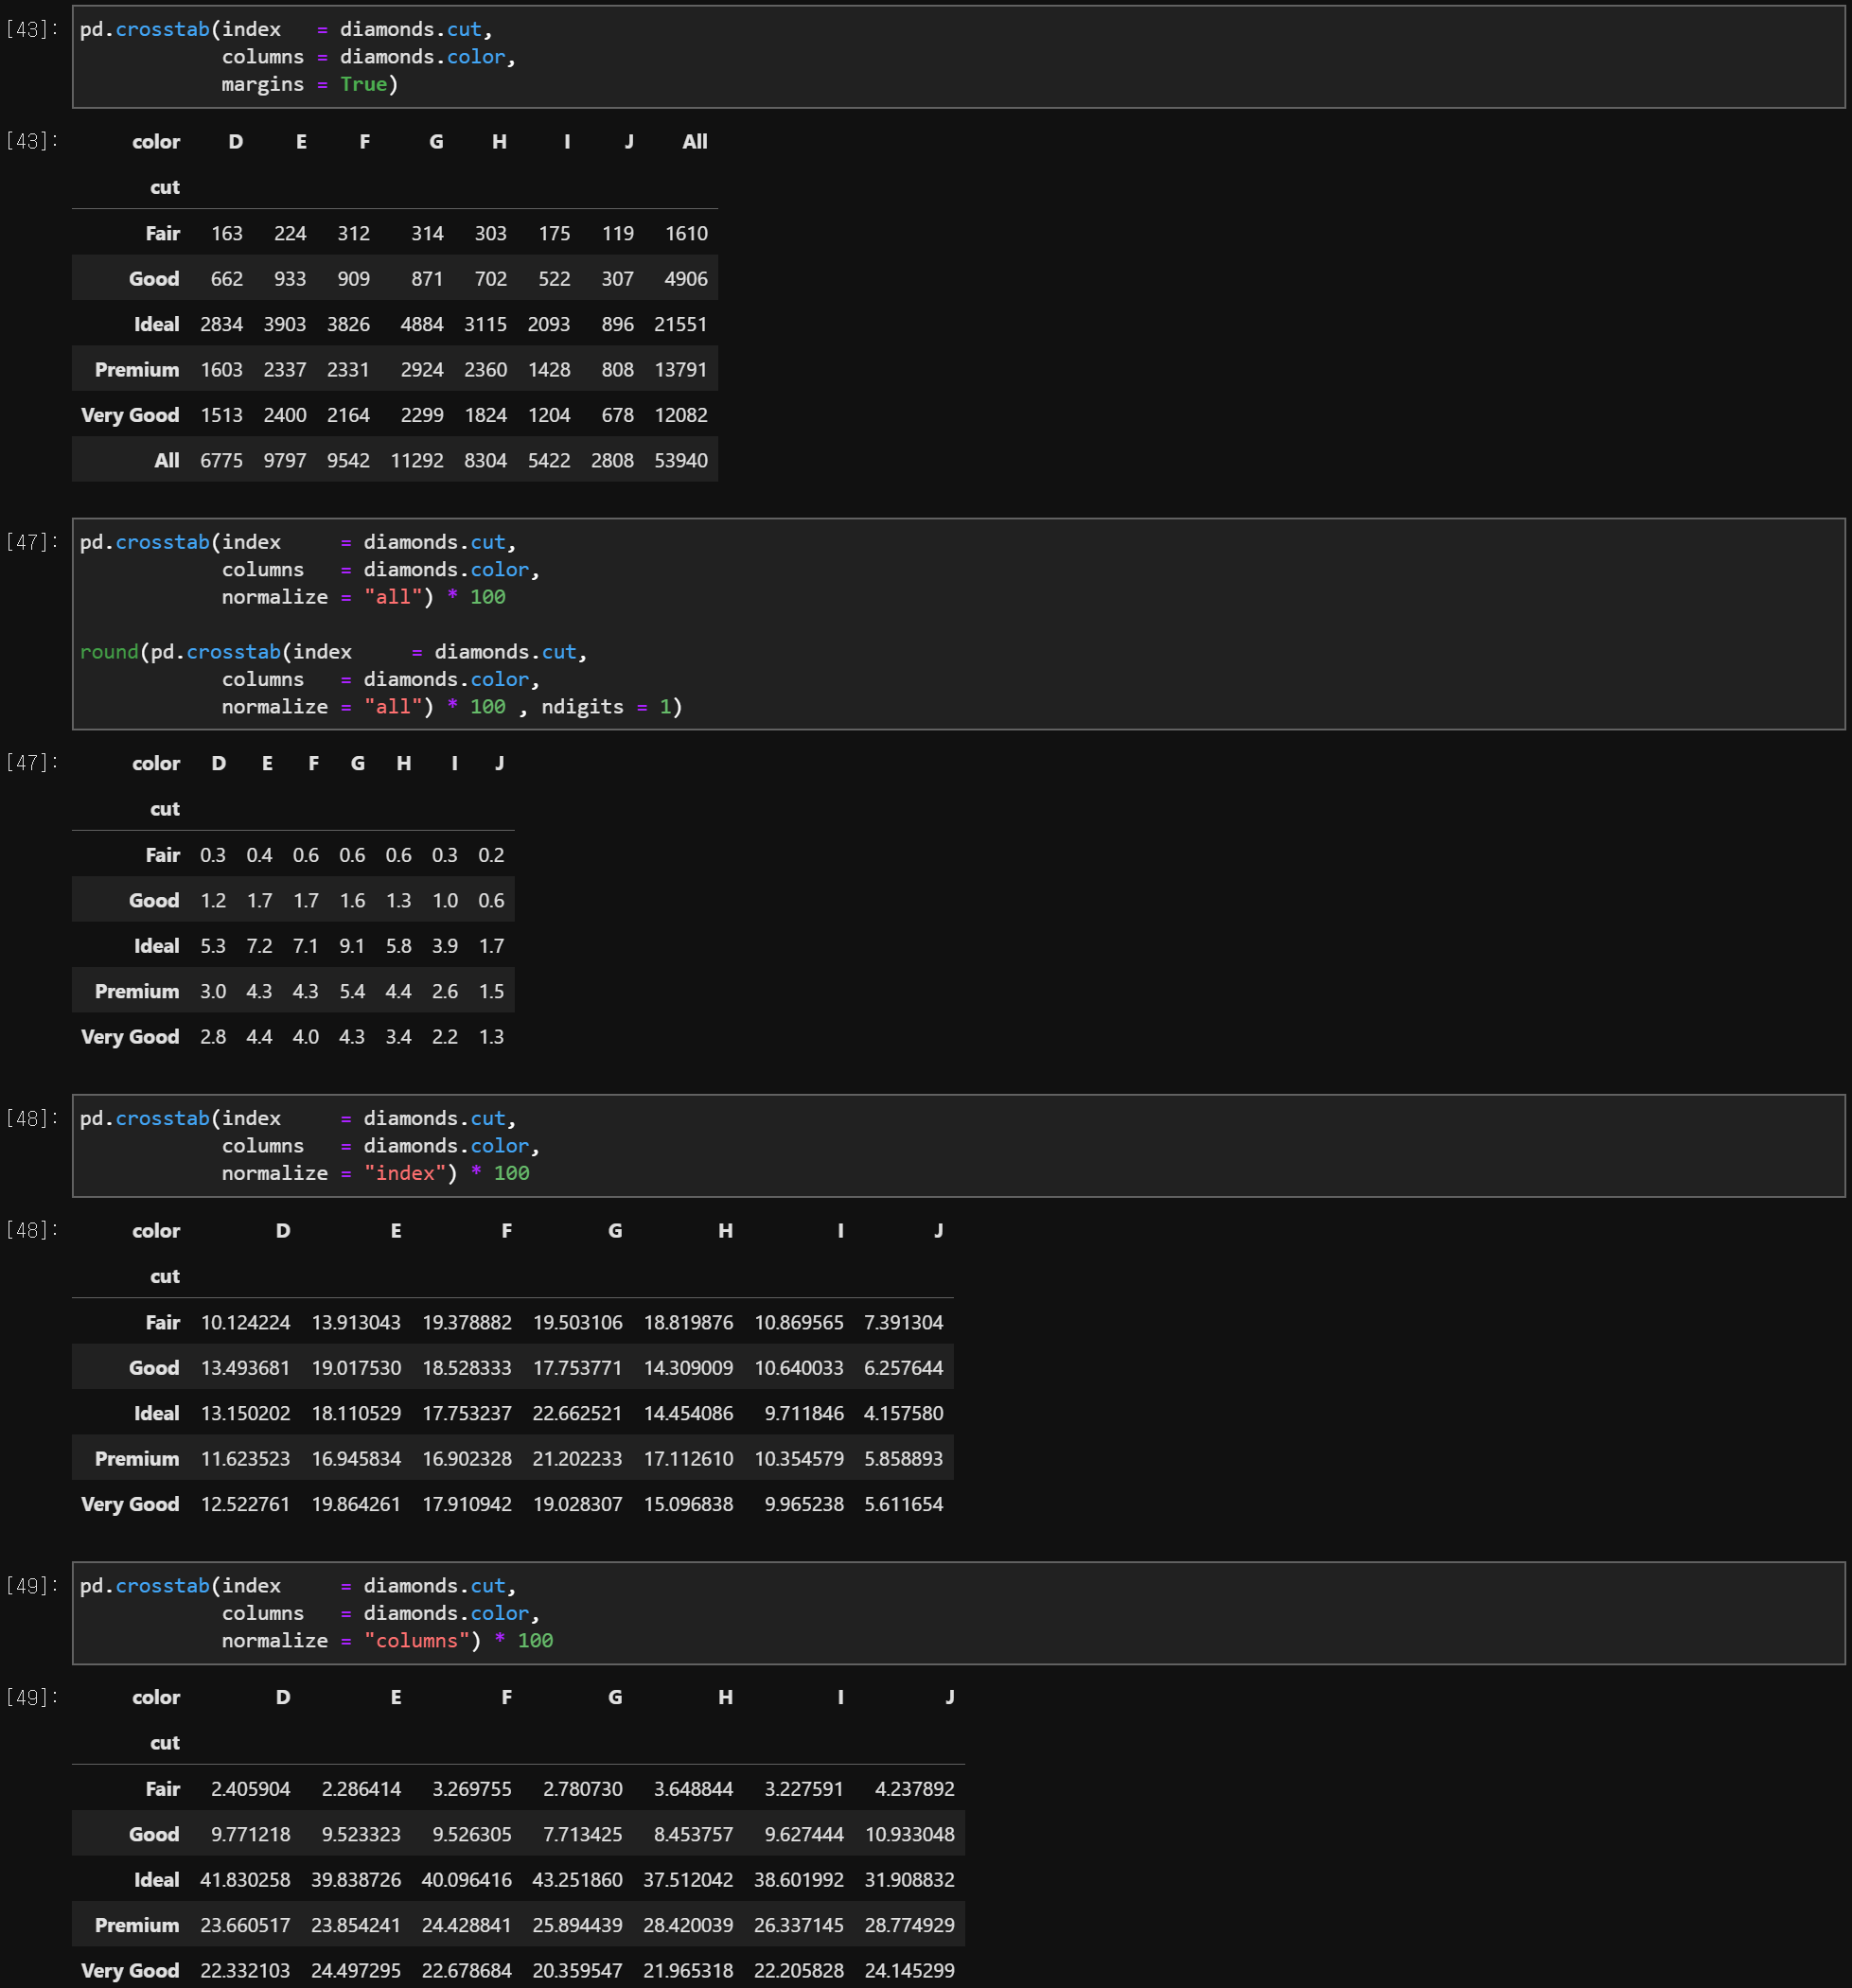
1) 교차표
pd.crosstab(data.variable1, data.variable2,
margins = True or False,
normalize = 'all', 'index', 'column')
2) 그래프
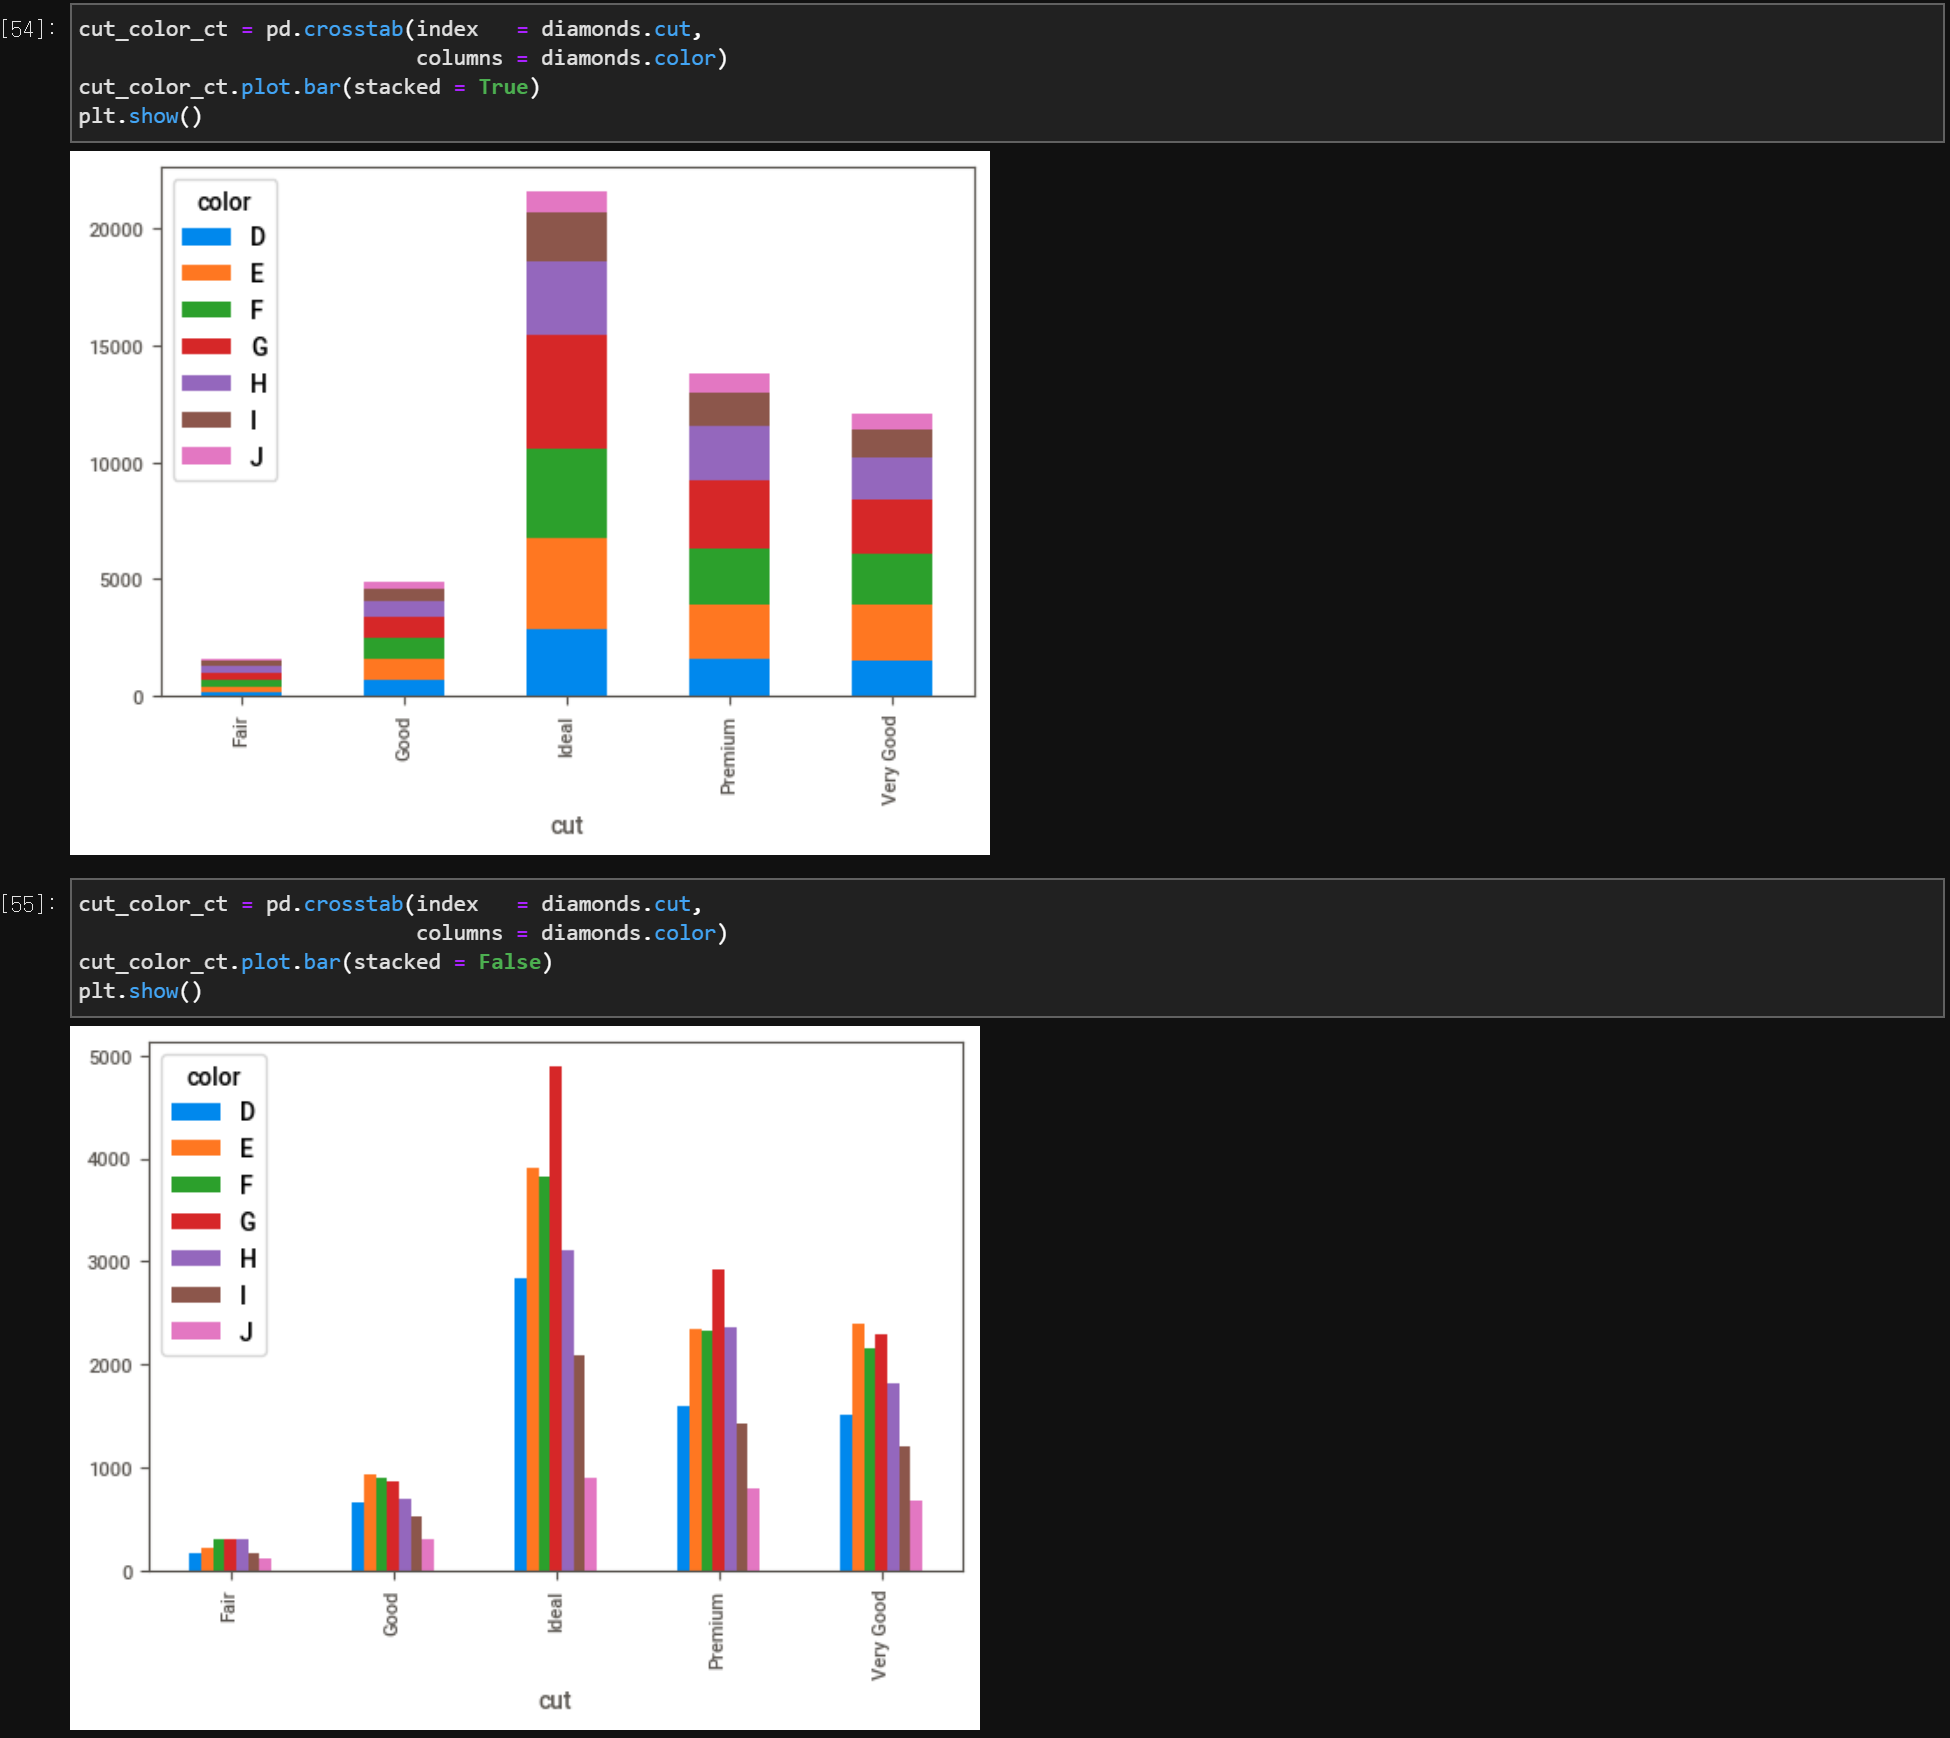
result = pd.crosstab(index = , columns = , normalize = )
result.plot.bar(stacked = True or False)
plt.show()
2. 집단별(질적 자료) 양적 자료 분석
1) 집단별 그래프
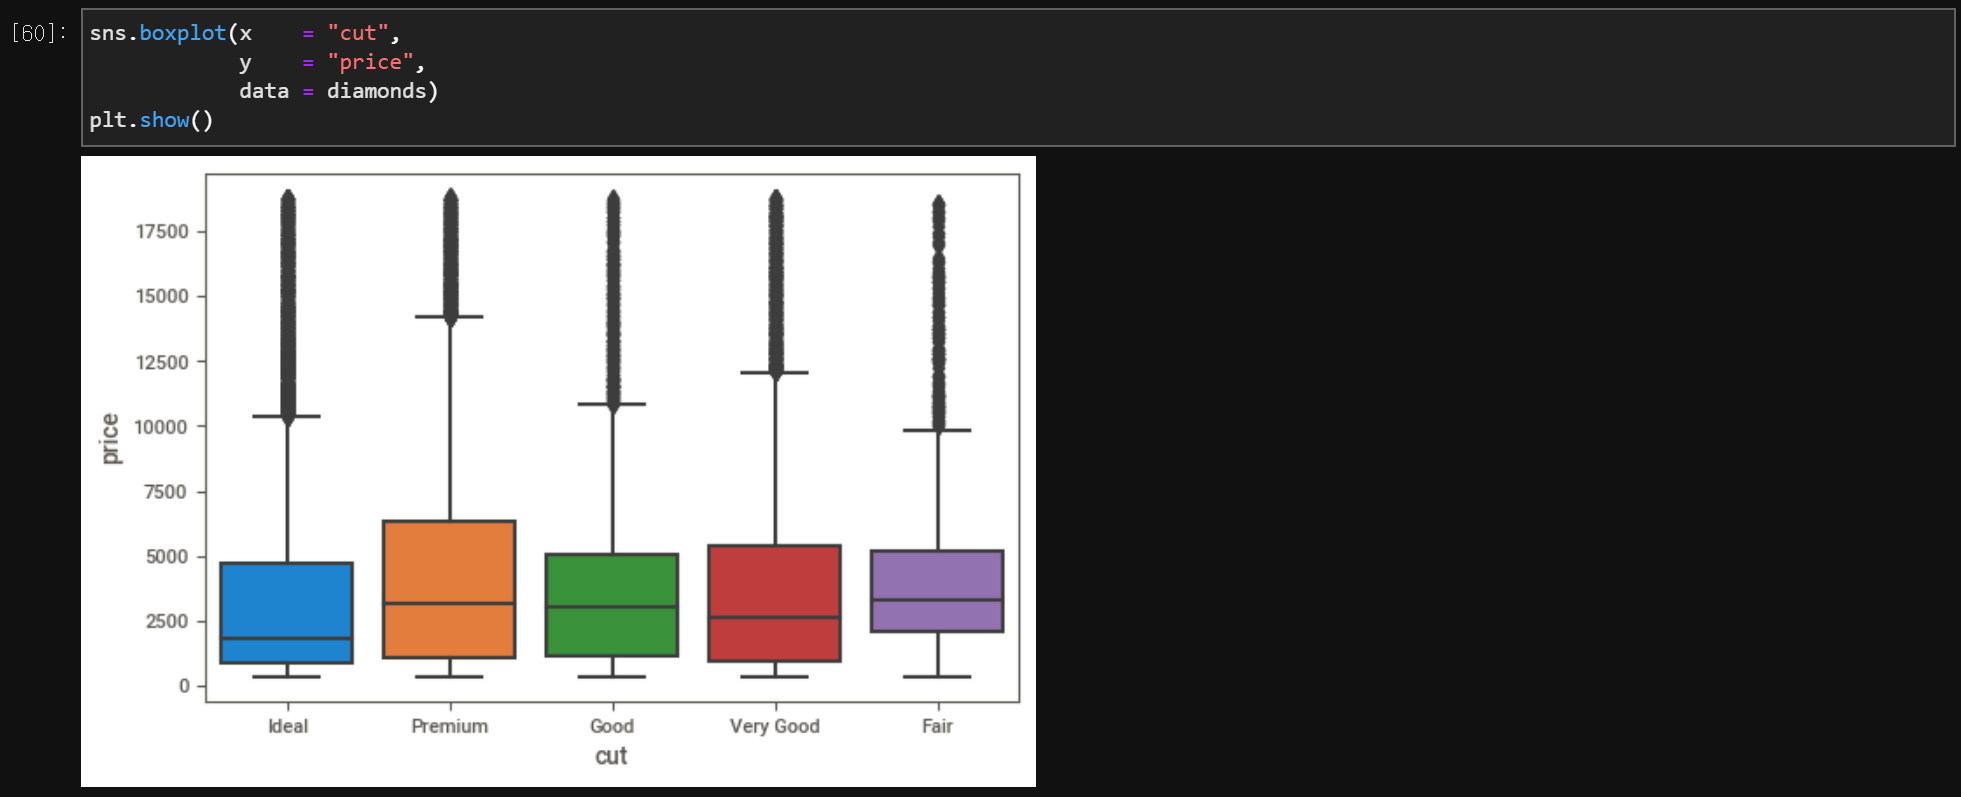
(1) 집단별 상자그림
import seaborn as sns
sns.boxplot(x = 'variable1', y = 'variable2', data = )
plt.show()
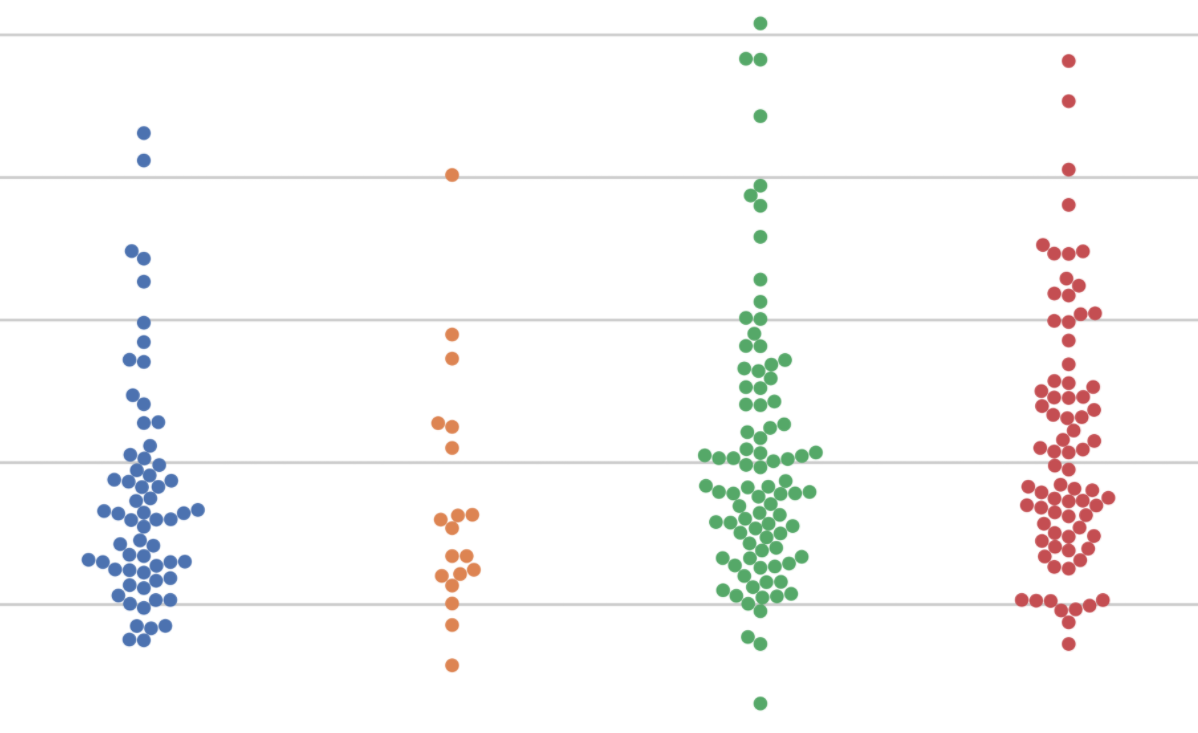
(2) 집단별 swarmplot
sns.swarmplot(x = 'variable1', y = 'variable2', data = )
plt.show()
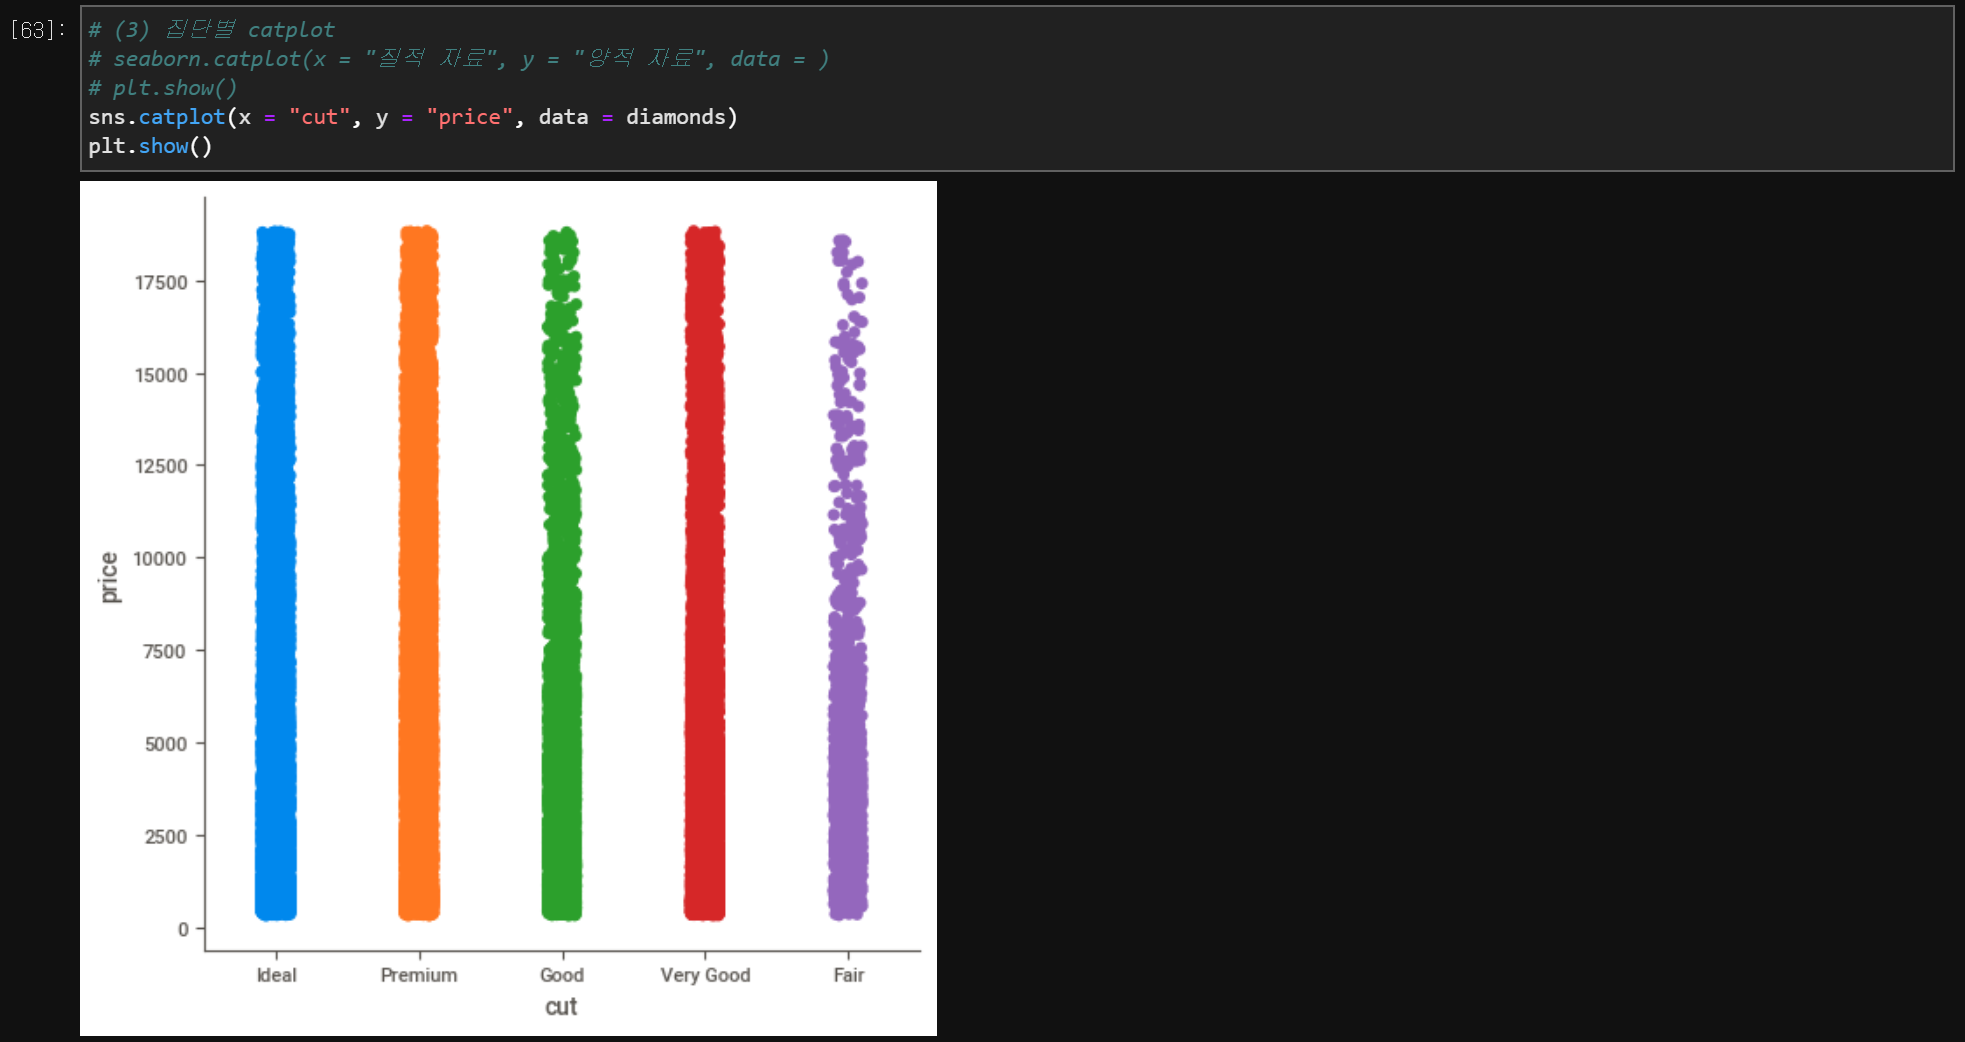
(3) 집단별 catplot
sns.catplot(x = 'variable1', y = 'variable2', data = )
plt.show()
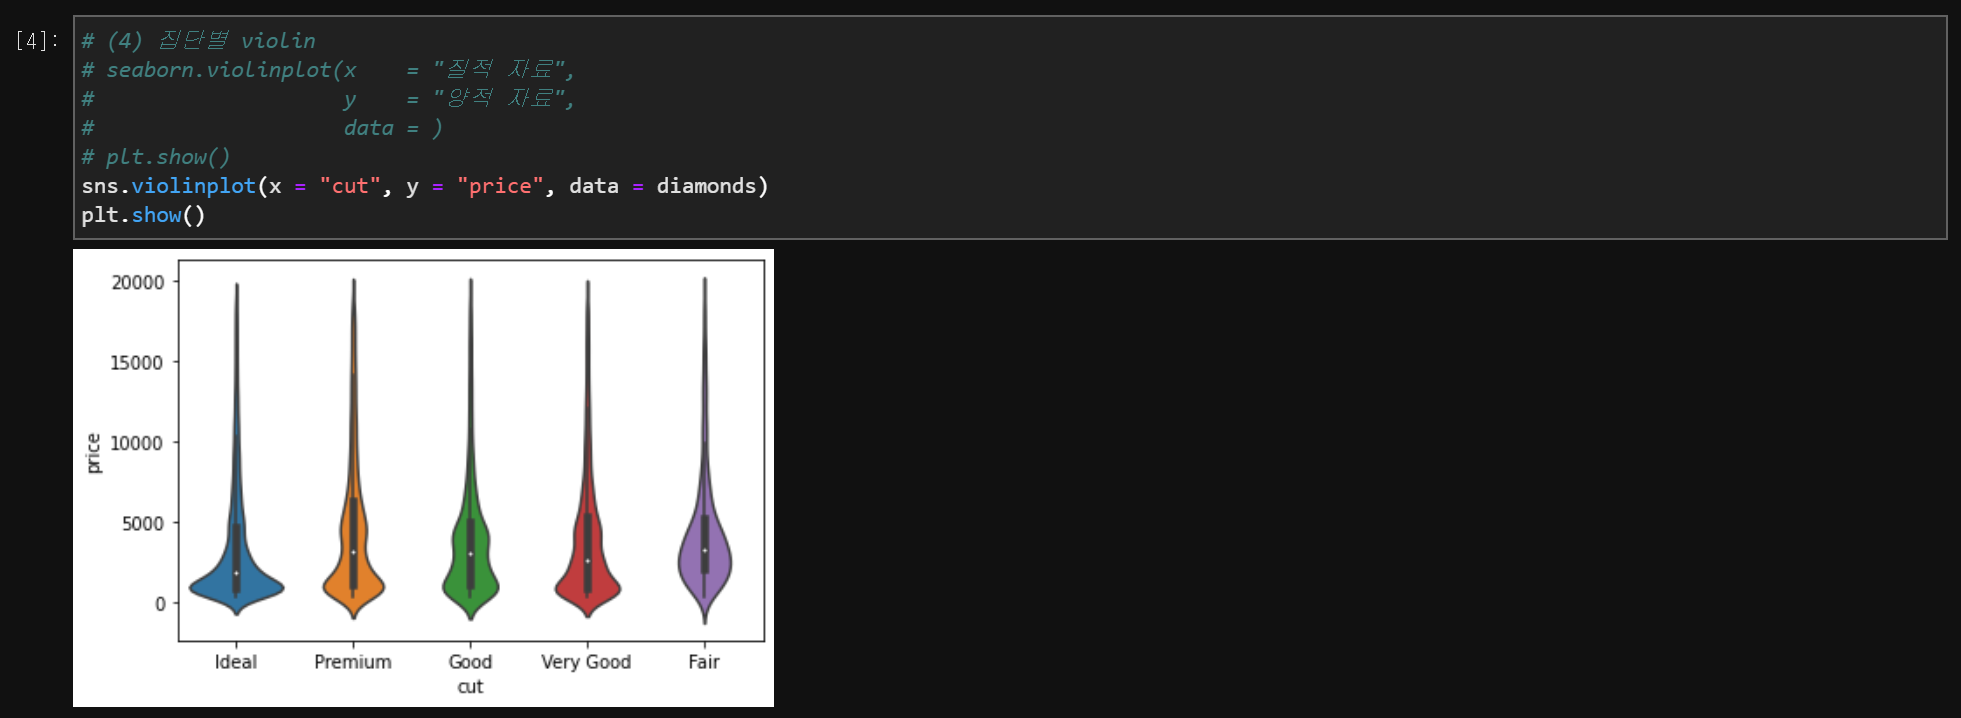
(4) 집단별 violinplot
sns.violinplot(x = 'variable1', y = 'variable2', data = )
plt.show()
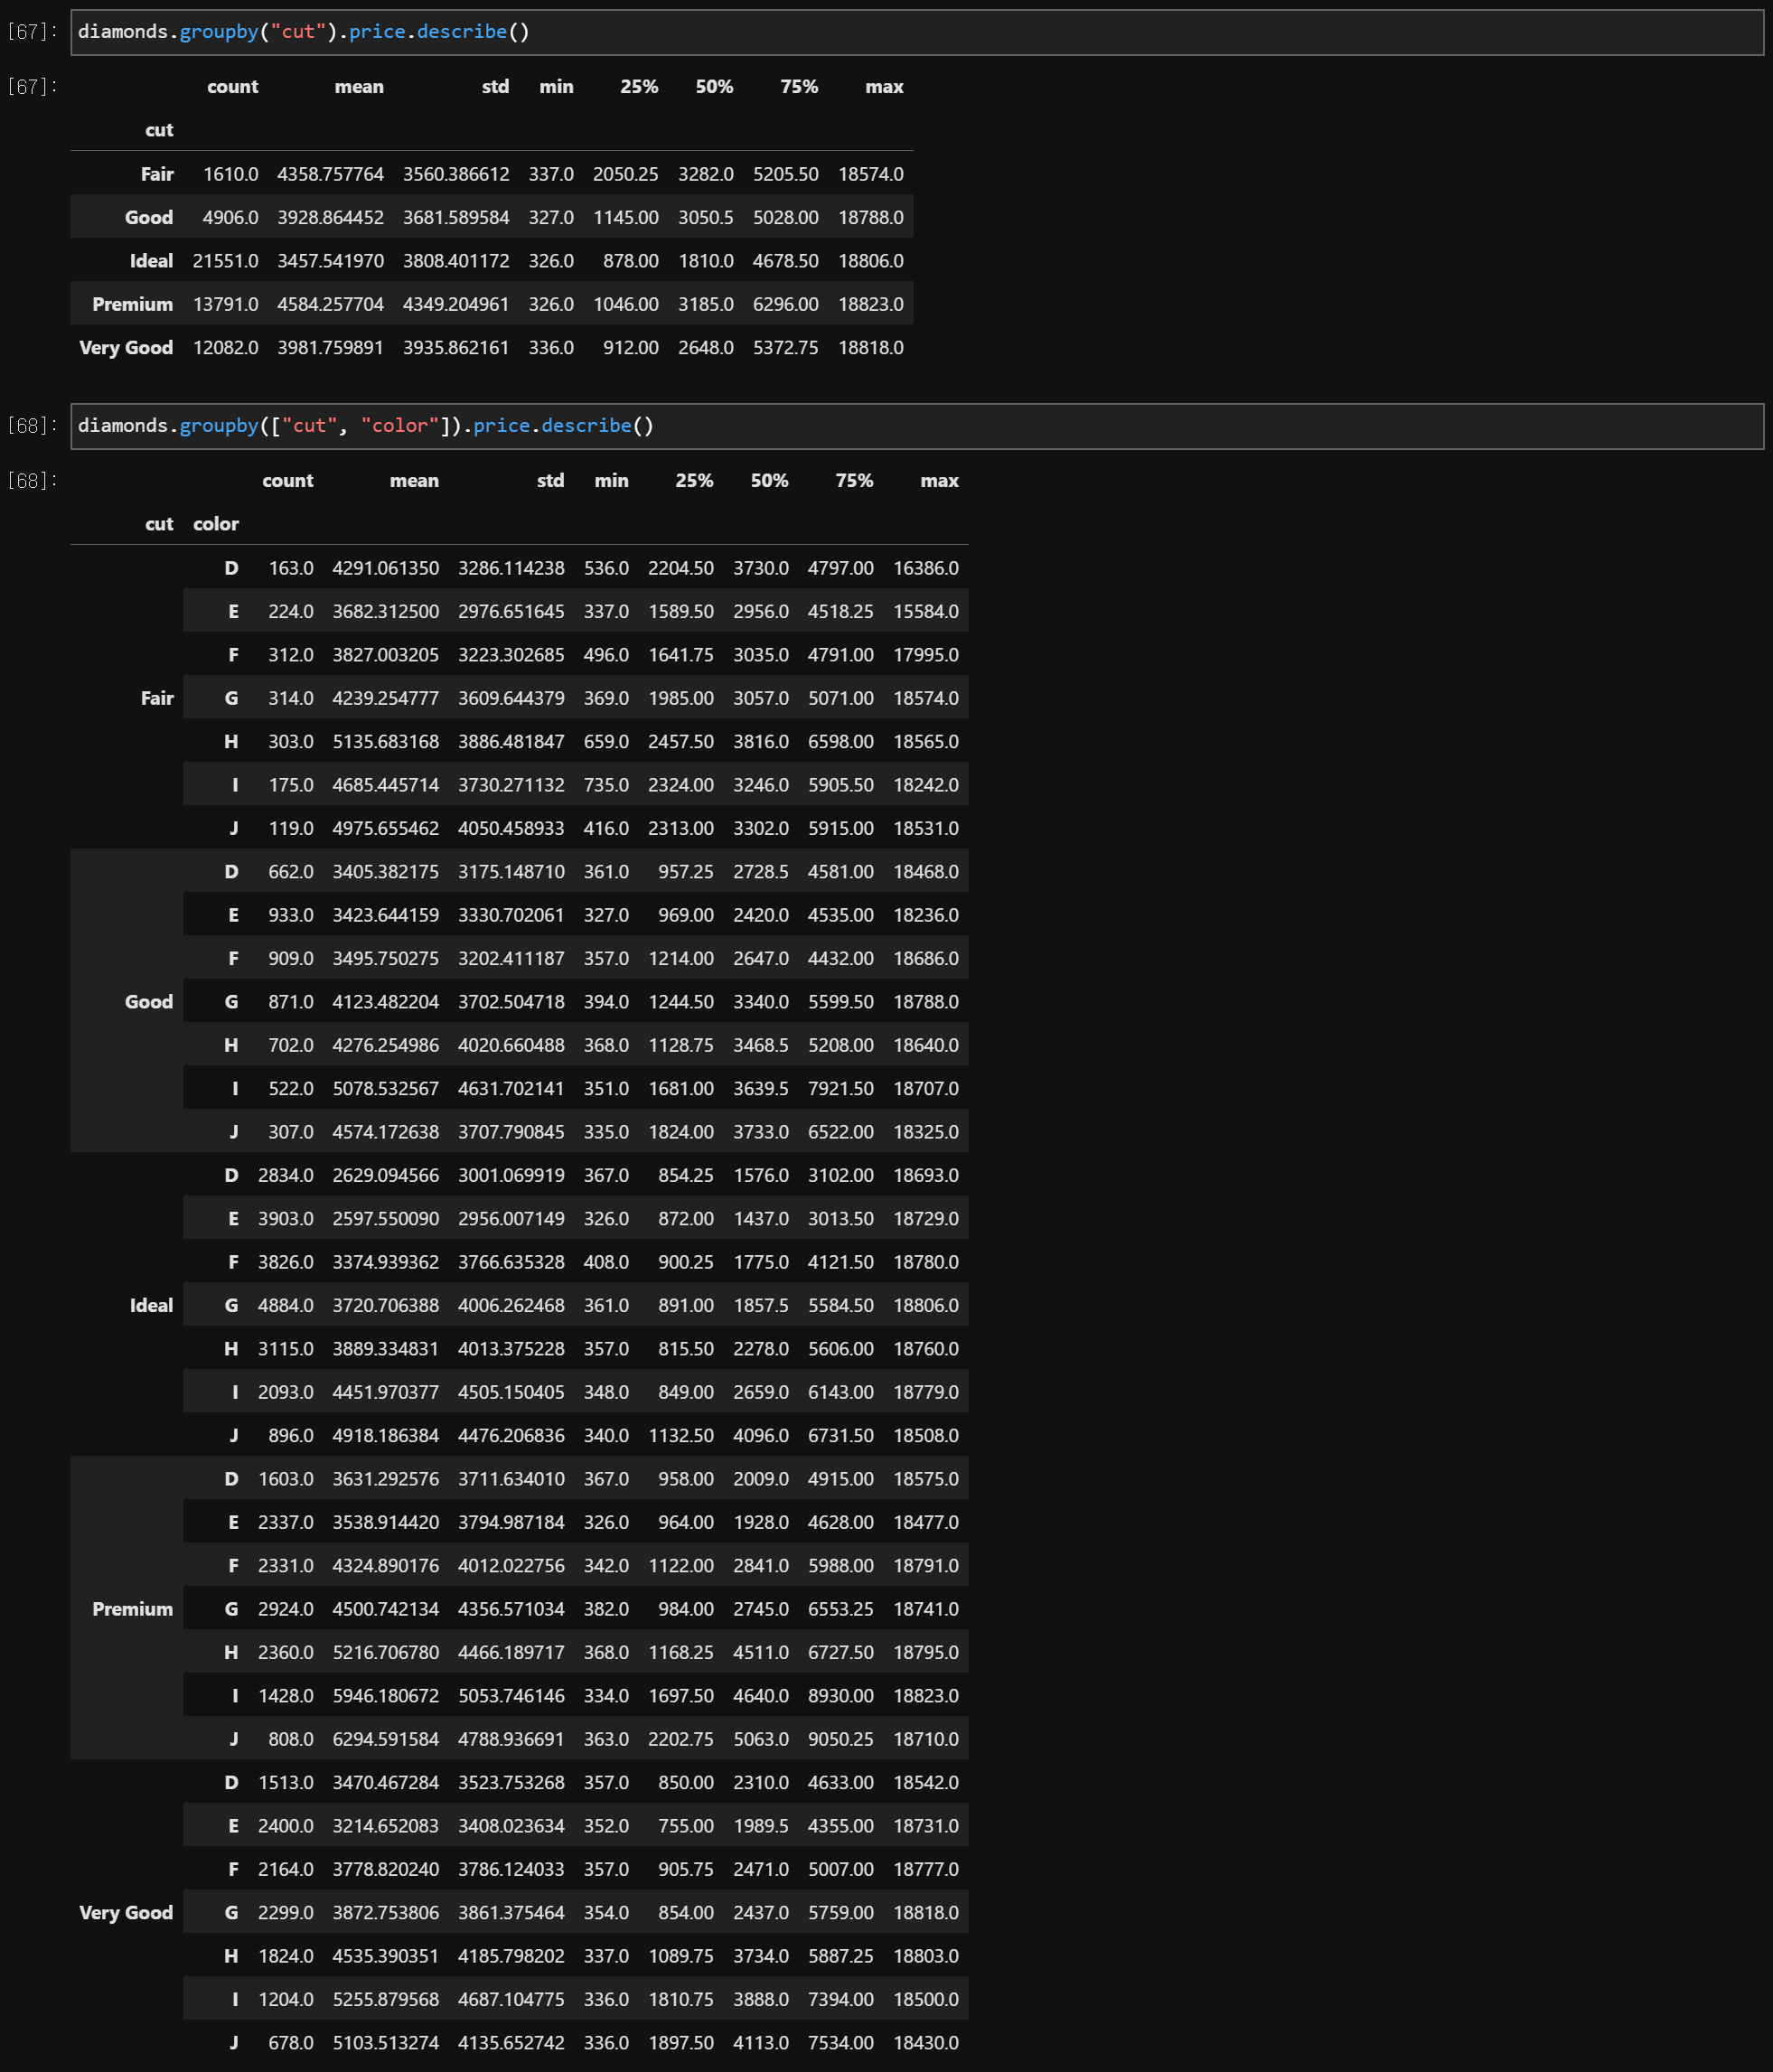
2) 집단별 기술통계량
data.groupby('variable').variable.describe()
data.groupby(['variable1', 'variable2']).price.describe()
3. 이변량 양적 자료 분석
1) 산점도 (Scatter plot)
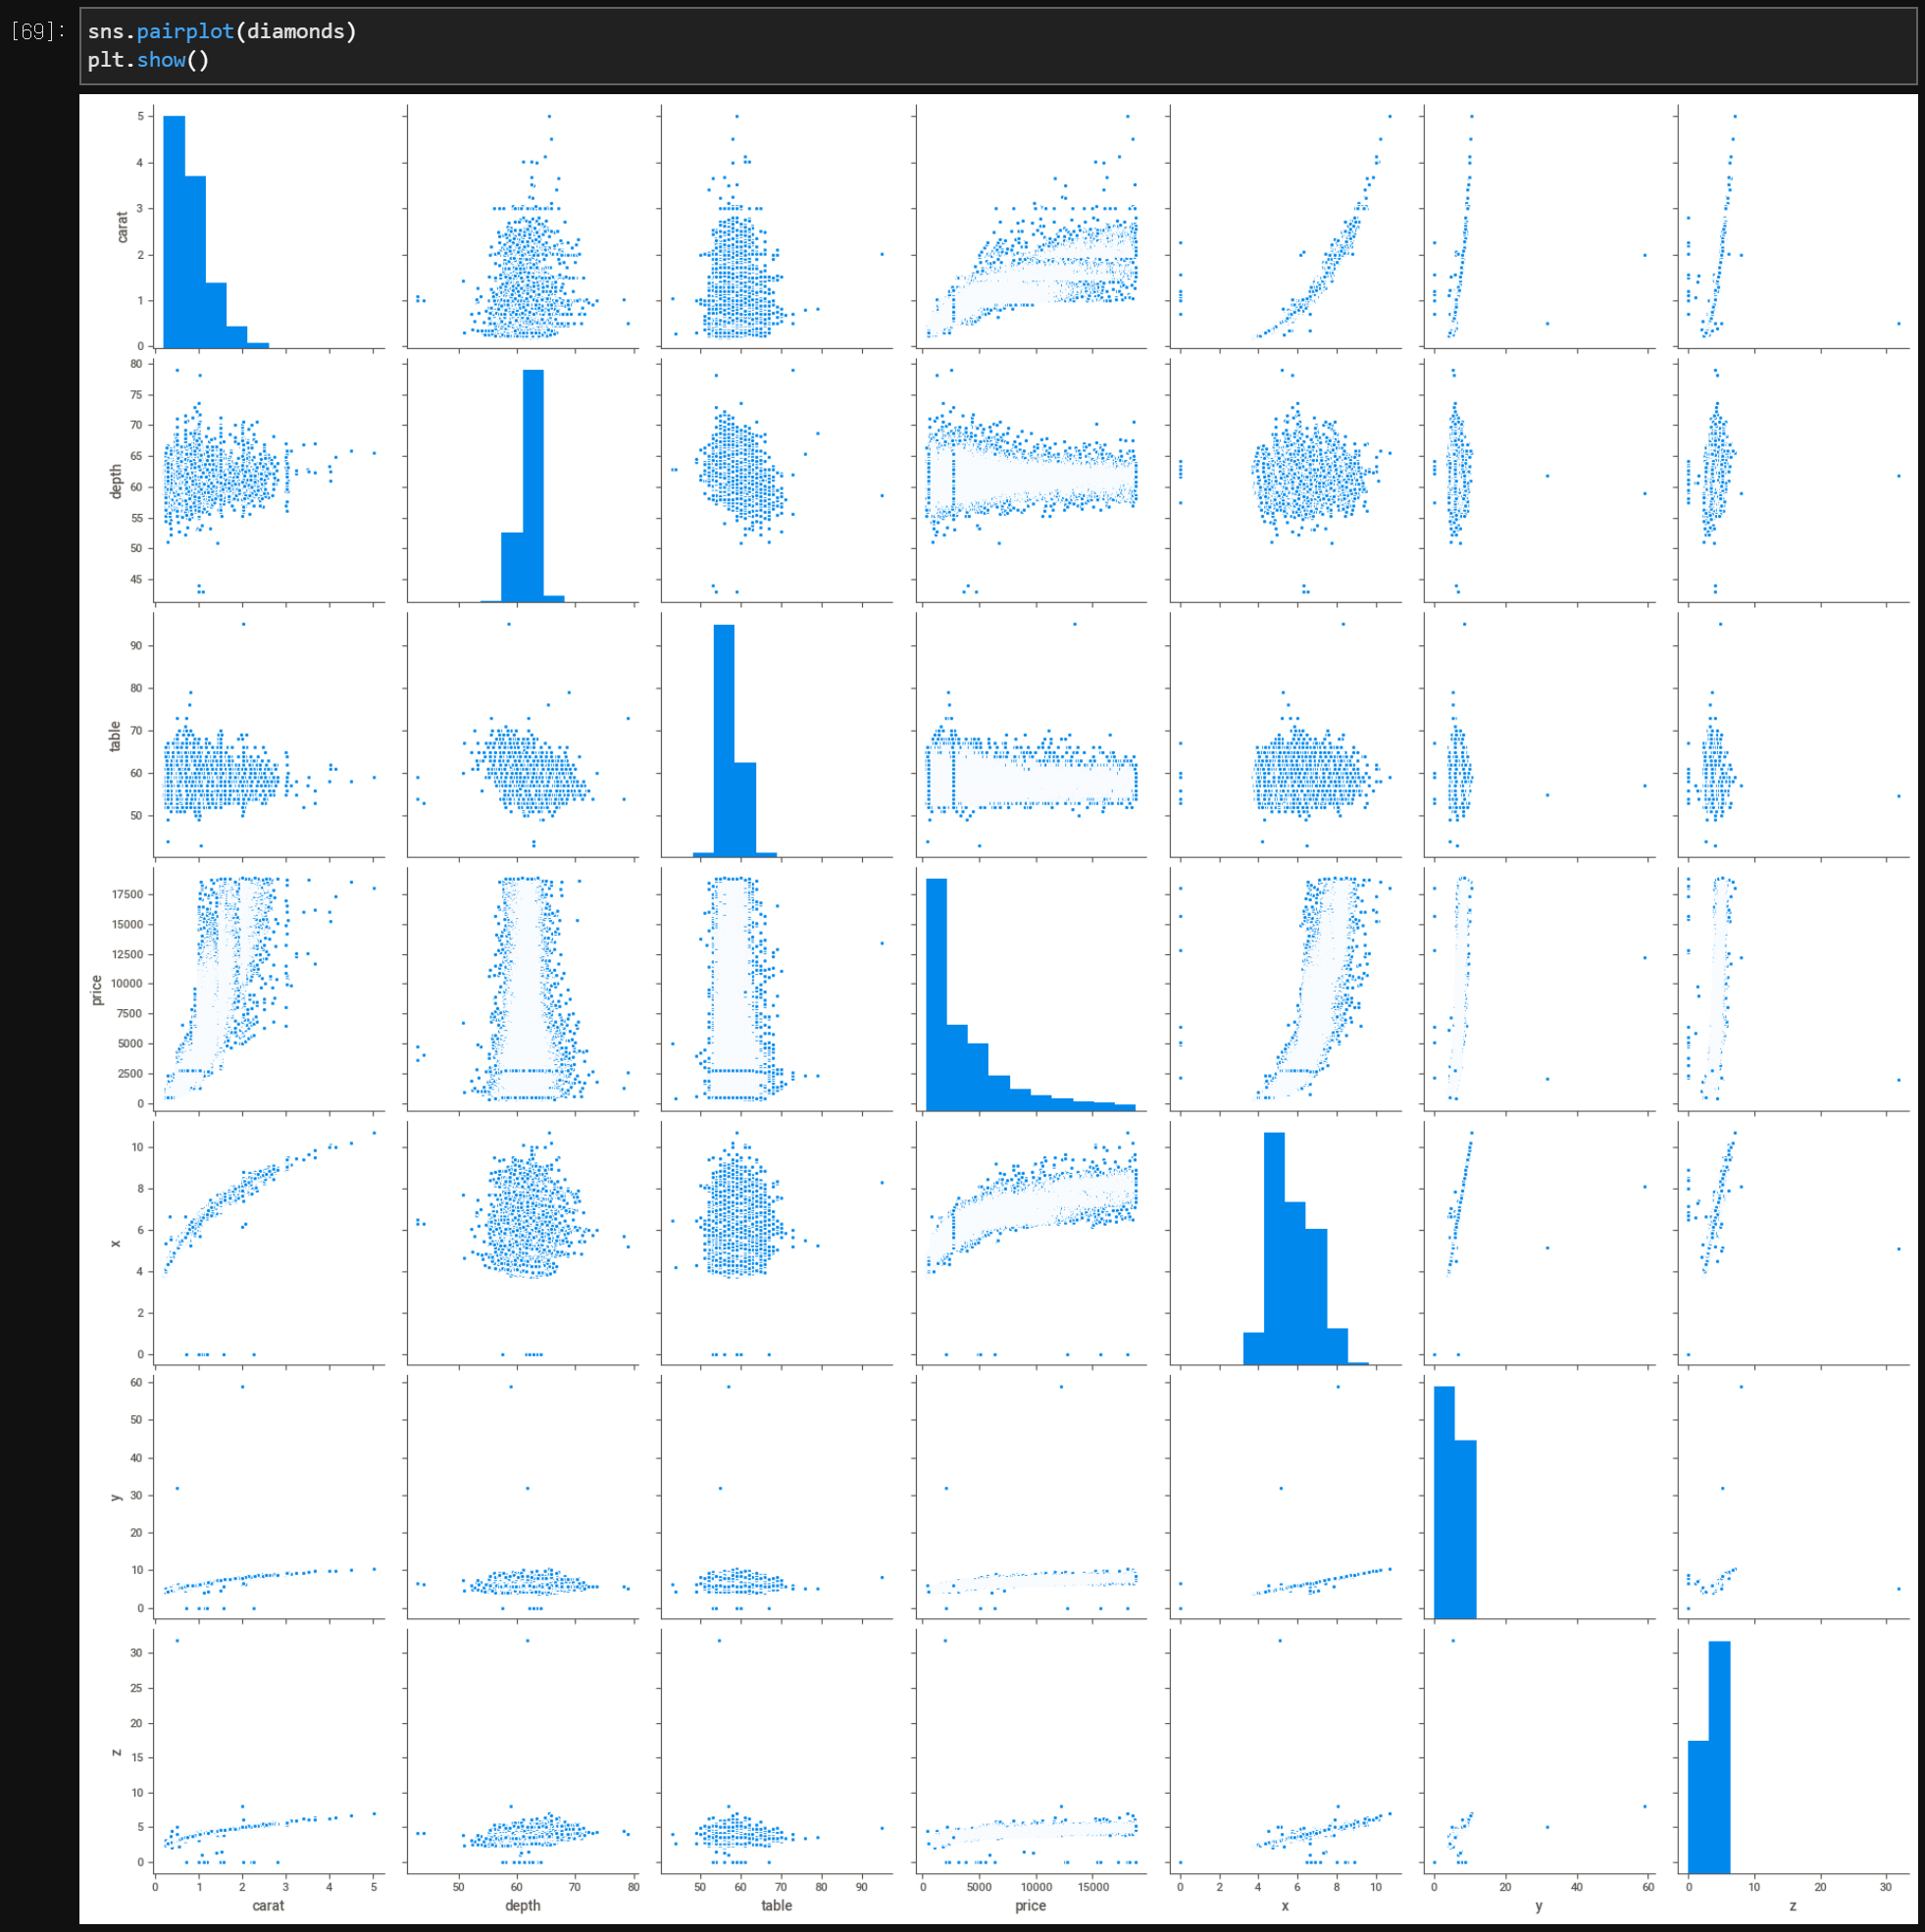
sns.pairplot(data = )
plt.show()
