[MicrosoftDataSchool] 56일차 - Azure databricks Image Classification Captioning, Streamlit, AutoLoader, 메달리온 아키텍처
Microsoft Data School 3기

Image Classification Captioning 실습(이어서)
Part B: 이미지 캡셔닝 — Foundation Model API
이미지 캡셔닝: 이미지를 보고 자연어로 설명을 생성하는 작업
활용 사례:
- 시각장애인을 위한 이미지 설명 (접근성)
- 이커머스 상품 이미지 자동 태깅
- SNS 자동 캡션 생성
- 의료 영상 소견 자동 작성
Databricks Foundation Model API의 멀티모달 LLM을 사용하면
모델 학습 없이 바로 이미지 캡셔닝이 가능
Step B-1: Foundation Model API 설정
import base64, io, json
from mlflow.deployments import get_deploy_client

# Databricks Foundation Model API 클라이언트
client = get_deploy_client("databricks")

# 멀티모달 모델 선택 (이미지 + 텍스트 이해 가능)
# Gemma 3 12B: Google의 멀티모달 모델 (가볍고 빠름)
# Claude: Anthropic의 멀티모달 모델 (고품질, 토큰 비용 높음)
VISION_MODEL = "databricks-gemma-3-12b"   # 1순위: 가볍고 비전 지원
# VISION_MODEL = "databricks-claude-sonnet-4"  # 2순위: 고품질 (위가 안 되면 이걸 사용)

print(f"✅ Vision 모델: {VISION_MODEL}")
print("   이미지 + 텍스트를 함께 이해하는 멀티모달 모델입니다.")
Step B-2: 이미지 캡셔닝 함수 작성
def caption_image(image, prompt="Describe this food image in detail. Include the type of food, its appearance, and likely ingredients."):
    """
    이미지를 Foundation Model API로 캡셔닝

    Parameters:
        image: PIL Image 객체
        prompt: 캡셔닝 프롬프트 (영어 권장 — 한국어 출력이 불안정할 수 있음)

    Returns:
        캡션 텍스트
    """
    # PIL 이미지 → base64 인코딩
    buf = io.BytesIO()
    image.save(buf, format="JPEG")
    img_b64 = base64.b64encode(buf.getvalue()).decode("utf-8")

    # Foundation Model API 호출
    response = client.predict(
        endpoint=VISION_MODEL,
        inputs={
            "messages": [
                {
                    "role": "user",
                    "content": [
                        {
                            "type": "image_url",
                            "image_url": {
                                "url": f"data:image/jpeg;base64,{img_b64}"
                            }
                        },
                        {
                            "type": "text",
                            "text": prompt
                        }
                    ]
                }
            ],
            "max_tokens": 200,
            "temperature": 0.3
        }
    )

    return response["choices"][0]["message"]["content"]
Step B-3: 음식 이미지 캡셔닝 실행
# 각 카테고리별 1장씩 캡셔닝
print("📝 이미지 캡셔닝 결과:\n")
print("=" * 70)

captions = {}
for food_name in target_foods:
    idx = filtered_data["label_name"].index(food_name)
    image = filtered_data["image"][idx]

    try:
        caption = caption_image(image)
        captions[food_name] = caption
        print(f"\n🍽️ [{food_name}]")
        print(f"   {caption}")
        print("-" * 70)
    except Exception as e:
        print(f"\n⚠️ [{food_name}] 캡셔닝 실패: {e}")
        captions[food_name] = f"Error: {e}"
📝 이미지 캡셔닝 결과:
======================================================================
🍽️ [pizza]
Here's a detailed description of the food image:
**Type of Food:** The image showcases a pizza. It appears to be a Neapolitan-style pizza, judging by the charred crust and relatively simple toppings.
**Appearance:**
* **Crust:** The crust is thick, puffy, and has a distinctly charred and blistered appearance around the edges. It's uneven, with some areas significantly darker than others, indicating a high-heat cooking method (likely a wood-fired oven). The crust has a rustic, slightly irregular shape.
* **Toppings:** The pizza is generously covered with:
* **Cheese:** A creamy, melted cheese (likely mozzarella) forms the base layer.
* **Tomatoes:** A large quantity of diced fresh tomatoes are scattered across the pizza. They appear juicy and bright red.
* **Ham:** Small pieces of ham are visible, interspersed among the tomatoes.
*
----------------------------------------------------------------------
🍽️ [sushi]
Here's a detailed description of the food in the image:
**Type of Food:** The image showcases a selection of sushi, a traditional Japanese dish.
**Appearance:**
* **Presentation:** The sushi is presented on a small, light-colored wooden board, which is a common serving style for sushi.
* **Sushi Pieces:** There are three distinct sushi pieces visible:
* **Salmon Nigiri:** A piece with a slice of bright pink salmon draped over a small mound of white sushi rice.
* **Shrimp Nigiri:** A piece featuring a cooked shrimp with a pinkish-orange hue, also over a bed of rice.
* **Unagi (Eel) Roll:** A small roll with a dark, glossy topping of what appears to be unagi (freshwater eel) brushed with a sweet and savory sauce. It sits on a bed of rice and nori (seaweed).
* **G
----------------------------------------------------------------------
🍽️ [fried_rice]
Here's a detailed description of the food image:
**Type of Food:** The dish appears to be fried rice, likely of an Asian (possibly Southeast Asian) origin.
**Appearance:**
* **Presentation:** The fried rice is served on a vibrant red plate. A large, silver serving spoon rests on the rice, partially obscuring the dish. The rice is garnished with a generous amount of fresh herbs and colorful vegetable strips.
* **Rice:** The rice itself is a light golden-brown color, indicating it has been stir-fried with oil and other ingredients. It appears fluffy and well-separated.
* **Ingredients:** The fried rice contains a mix of visible ingredients:
* **Eggs:** Scrambled egg pieces are scattered throughout the rice.
* **Peas:** Bright green peas are visible, adding pops of color.
* **Carrots:** Thinly sliced, orange carrot strips are arranged on top
----------------------------------------------------------------------
🍽️ [ramen]
Here's a detailed description of the food in the image:
**Type of Food:** This is a bowl of Ramen.
**Appearance:**
* **Bowl:** The ramen is served in a dark brown, ceramic bowl with a slightly rustic texture.
* **Broth:** The broth is a rich, orange-red color, suggesting a pork-based or miso-based broth. It appears quite thick and flavorful.
* **Noodles:** There's a generous portion of yellow ramen noodles submerged in the broth. They appear to be the classic, wavy style.
* **Protein:** Sliced pieces of grilled chicken are visible, arranged on top of the noodles. The chicken has grill marks and a slightly browned appearance.
* **Garnish:** The bowl is generously garnished with a variety of fresh ingredients:
* Sliced scallions (green onions)
* Thinly sliced red onion rings
* Sliced
----------------------------------------------------------------------
🍽️ [ice_cream]
Here's a detailed description of the food in the image:
**Type of Food:** This appears to be a dessert, specifically a sundae or a layered ice cream treat.
**Appearance:**
* **Main Components:** The image shows two distinct scoops of ice cream sitting in a glass bowl.
* **Chocolate Ice Cream:** A large scoop of dark chocolate ice cream dominates the right side of the bowl. It has a rich, dark brown color and a slightly textured surface, suggesting it's not perfectly smooth.
* **Vanilla Ice Cream:** A smaller scoop of vanilla ice cream sits on the left. It's a creamy, pale yellow color.
* **Toppings:**
* **Caramel Sauce/Toffee:** There's a piece of what looks like caramel or toffee on the left side of the bowl. It has a golden-brown color and a slightly bubbly, uneven surface, indicating it's
----------------------------------------------------------------------Step B-4: 다양한 프롬프트로 캡셔닝
# 프롬프트에 따라 캡션이 달라짐!
sample_image = filtered_data["image"][0]
sample_name = filtered_data["label_name"][0]

prompts = {
    "General": "What food is in this image?",
    "Detailed": "Describe this food image in detail including ingredients, cooking style, and likely origin.",
    "Nutritional": "Estimate the nutritional content of this food. List approximate calories, protein, carbs, and fat.",
    "Recipe": "Based on this food image, provide a brief recipe with key ingredients and cooking steps.",
}

print(f"📷 같은 이미지 [{sample_name}], 다른 프롬프트:\n")
for prompt_name, prompt_text in prompts.items():
    try:
        caption = caption_image(sample_image, prompt=prompt_text)
        print(f"💬 [{prompt_name}]")
        print(f"   Prompt: {prompt_text}")
        print(f"   → {caption[:200]}...")
        print()
    except Exception as e:
        print(f"⚠️ [{prompt_name}] 실패: {e}\n")
📷 같은 이미지 [ramen], 다른 프롬프트:
💬 [General]
Prompt: What food is in this image?
→ Based on the image, this appears to be a bowl of **Ramen**.
Here's a breakdown of what I can see:
* **Noodles:** The long, white strands are ramen noodles.
* **Broth:** A rich, orange-colored b...
💬 [Detailed]
Prompt: Describe this food image in detail including ingredients, cooking style, and likely origin.
→ Here's a detailed description of the food in the image:
**Overall Impression:**
The image shows a bowl of ramen, a popular Japanese noodle soup. It appears to be a hearty and flavorful dish with a r...
💬 [Nutritional]
Prompt: Estimate the nutritional content of this food. List approximate calories, protein, carbs, and fat.
→ Okay, let's break down the estimated nutritional content of this ramen dish. Please keep in mind this is an *estimate* based on the image and common ramen ingredients. Actual values can vary significa...
💬 [Recipe]
Prompt: Based on this food image, provide a brief recipe with key ingredients and cooking steps.
→ Okay, here's a brief recipe inspired by the image of the ramen, focusing on a chicken-based version. It's simplified for ease, but aims to capture the essence of what's visible.
**Chicken Ramen Reci...Part C: 분류 + 캡셔닝 통합 파이프라인
Step C-1: 통합 분석 — 분류 + 캡셔닝
import mlflow

mlflow.set_experiment("/Users/" + spark.sql("SELECT current_user()").first()[0] + "/image_classification_lab")

# 5장의 대표 이미지에 분류 + 캡셔닝 동시 수행
with mlflow.start_run(run_name="combined_classify_caption"):
    results_table = []

    for food_name in target_foods:
        idx = filtered_data["label_name"].index(food_name)
        image = filtered_data["image"][idx]

        # 1) ViT 분류
        classify_result = classify_image(image, top_k=1)
        predicted = classify_result[0]["label"]
        confidence = classify_result[0]["confidence"]

        # 2) Foundation Model 캡셔닝
        try:
            caption = caption_image(image)
        except:
            caption = "(캡셔닝 실패)"

        results_table.append({
            "food": food_name,
            "vit_prediction": predicted,
            "confidence": f"{confidence:.1%}",
            "caption": caption[:100] + "..."
        })

        print(f"✅ {food_name}: {predicted} ({confidence:.1%})")

    # MLflow에 결과 기록
    mlflow.log_param("pipeline", "classify + caption")
    mlflow.log_param("classifier", "google/vit-base-patch16-224")
    mlflow.log_param("captioner", VISION_MODEL)
✅ pizza: pizza, pizza pie (98.0%)
✅ sushi: plate (44.0%)
✅ fried_rice: wok (29.3%)
✅ ramen: consomme (50.7%)
✅ ice_cream: ice cream, icecream (96.3%)# 결과를 Spark DataFrame으로 표시
import pandas as pd
results_pdf = pd.DataFrame(results_table)
results_df = spark.createDataFrame(results_pdf)
display(results_df)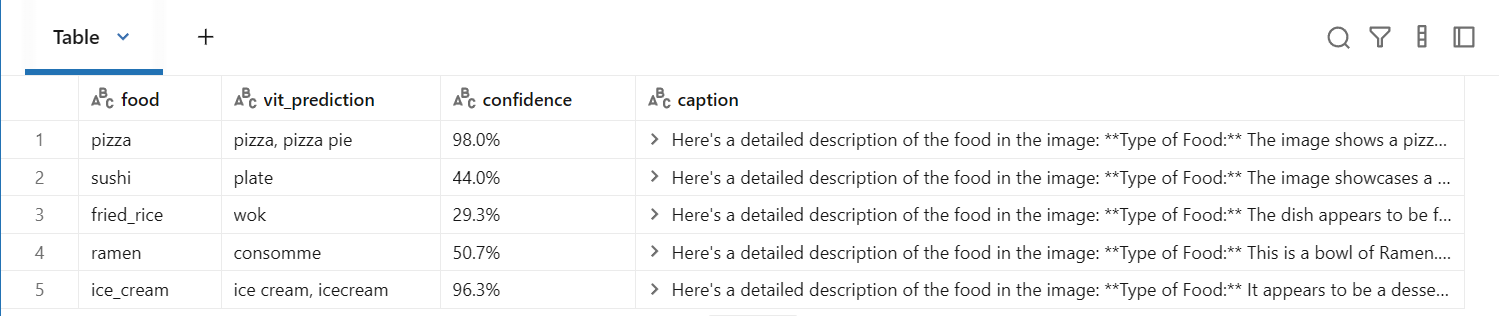
Step C-2: 결과를 Delta 테이블로 저장
# 분석 결과 저장
results_df.write.mode("overwrite").saveAsTable(
    f"{CATALOG}.{SCHEMA}.image_analysis_results_lab"
)

print(f"✅ 분석 결과 저장 완료: {CATALOG}.{SCHEMA}.image_analysis_results_lab")
정리
| 방법 | 모델 | 용도 | GPU 필요? | 비용 |
|---|---|---|---|---|
| ViT 분류 | google/vit-base-patch16-224 | 이미지 → 카테고리 | ❌ CPU OK | 무료 (오픈소스) |
| Foundation Model 캡셔닝 | 멀티모달 LLM | 이미지 → 텍스트 설명 | ❌ API 호출 | 토큰당 과금 |
| 통합 파이프라인 | ViT + LLM | 분류 + 설명 자동화 | ❌ | 최소 비용 |
- Transfer Learning: 사전학습된 ViT 모델로 학습 없이 이미지 분류
- 멀티모달 API: Foundation Model API로 이미지 캡셔닝 (코드 몇 줄!)
- 프롬프트 엔지니어링: 같은 이미지라도 프롬프트에 따라 다른 분석 가능
- MLflow 추적: 이미지 분석 실험도 MLflow로 재현 가능하게 관리
Part D: ViT 모델 저장 & Unity Catalog 등록
모델 저장 이유
- 지금까지는 매번 HuggingFace에서 모델을 다운로드해서 사용
- 실무에서는 이렇게 하면 문제 발생
- 재현성: 어떤 버전의 모델을 사용했는지 추적 불가
- 의존성: HuggingFace 서버가 다운되면 모델 사용 불가
- 배포: 웹 서비스로 만들려면 모델이 저장소에 있어야 함
- 거버넌스: 누가, 언제, 어떤 모델을 배포했는지 관리 필요
해결책: MLflow로 모델을 저장하고, Unity Catalog에 등록
Step D-1: transformers 파이프라인을 MLflow에 로깅
import mlflow
from transformers import pipeline
import os

os.environ["HF_HOME"] = "/tmp/hf_home"
os.environ["TRANSFORMERS_CACHE"] = "/tmp/hf_cache"

# Unity Catalog를 모델 레지스트리로 설정
mlflow.set_registry_uri("databricks-uc")

# ViT 파이프라인 생성
vit_pipeline = pipeline(
    "image-classification",
    model="google/vit-base-patch16-224",
)

# 등록할 모델 이름
MODEL_NAME = f"{CATALOG}.{SCHEMA}.vit_image_classifier"

print(f"📦 모델을 저장할 위치: {MODEL_NAME}")
# MLflow에 모델 로깅 + Unity Catalog 등록
mlflow.set_experiment(
"/Users/" + spark.sql("SELECT current_user()").first()[0] + "/image_classification_lab"
)
with mlflow.start_run(run_name="vit_model_registration") as run:
# 모델 파라미터 기록
mlflow.log_param("model_name", "google/vit-base-patch16-224")
mlflow.log_param("task", "image-classification")
mlflow.log_param("num_labels", 1000) # ImageNet 클래스 수
# transformers 파이프라인을 MLflow 모델로 저장
model_info = mlflow.transformers.log_model(
transformers_model=vit_pipeline,
artifact_path="model",
registered_model_name=MODEL_NAME, # Unity Catalog에 자동 등록
task="image-classification",
)
print(f"✅ 모델 저장 완료!")
print(f" Run ID: {run.info.run_id}")
print(f" Model URI: {model_info.model_uri}")
print(f" Registry: {MODEL_NAME}")Step D-2: 저장된 모델 확인
from mlflow import MlflowClient

client = MlflowClient(registry_uri="databricks-uc")

# 등록된 모델 버전 확인
versions = client.search_model_versions(f"name='{MODEL_NAME}'")
for v in versions:
    print(f"📌 버전 {v.version}")
    print(f"   상태: {v.status}")
    print(f"   생성: {v.creation_timestamp}")
    print(f"   Run ID: {v.run_id}")
    print()

latest_version = max(int(v.version) for v in versions)
print(f"✅ 최신 버전: {latest_version}")
📌 버전 1
상태: READY
생성: 1774487105838
Run ID: 0e2aa3be2c8349dbaee9e7a131d2ebaa
✅ 최신 버전: 1Step D-3: 저장된 모델로 추론 테스트
# Unity Catalog에서 모델 로드 (transformers 네이티브 파이프라인으로)
loaded_pipeline = mlflow.transformers.load_model(f"models:/{MODEL_NAME}/{latest_version}")

# 테스트 이미지로 추론
test_image = filtered_data["image"][0]  # 첫 번째 이미지
test_label = filtered_data["label_name"][0]

# transformers 파이프라인은 PIL 이미지를 직접 받음
result = loaded_pipeline(test_image, top_k=3)

print(f"📷 테스트 이미지: {test_label}")
print(f"🔍 저장된 모델 추론 결과:")
print(result)
📷 테스트 이미지: ramen
🔍 저장된 모델 추론 결과:
[{'label': 'consomme', 'score': 0.5065412521362305}, {'label': 'hot pot, hotpot', 'score': 0.34765300154685974}, {'label': 'soup bowl', 'score': 0.07414259016513824}]Part E: 서빙 엔드포인트 생성 & 테스트
서빙 엔드포인트란?
- 모델을 REST API로 호출할 수 있게 만드는 것
현재: 노트북 → 모델 로드 → 추론 (클러스터 필요)
서빙: HTTP 요청 → 엔드포인트 → 추론 (클러스터 불필요, 서버리스)
장점:
- 클러스터 없이도 모델 사용 가능 (서버리스)
- REST API로 어디서든 호출 (웹앱, 모바일, 다른 서비스)
- 자동 스케일링 (트래픽에 따라 확장/축소)
- scale-to-zero: 안 쓸 때 비용 0
Step E-1: 서빙 엔드포인트 생성
import requests
import json

# Databricks API 접속 정보
ctx = dbutils.notebook.entry_point.getDbutils().notebook().getContext()
host = ctx.browserHostName().get()
token = ctx.apiToken().get()

# 엔드포인트 설정
ENDPOINT_NAME = "vit-image-classifier"

endpoint_config = {
    "name": ENDPOINT_NAME,
    "config": {
        "served_entities": [
            {
                "entity_name": MODEL_NAME,
                "entity_version": str(latest_version),
                "workload_size": "Small",           # Small/Medium/Large
                "scale_to_zero_enabled": True,       # 안 쓸 때 비용 0
            }
        ]
        # traffic_config 불필요 — 엔티티 1개면 자동 100% 할당
    }
}

# 엔드포인트 생성 API 호출
resp = requests.post(
    f"https://{host}/api/2.0/serving-endpoints",
    headers={"Authorization": f"Bearer {token}", "Content-Type": "application/json"},
    json=endpoint_config
)

if resp.status_code == 200:
    print(f"✅ 서빙 엔드포인트 생성 요청 완료: {ENDPOINT_NAME}")
    print(f"   상태를 아래에서 확인하세요.")
elif resp.status_code == 400 and "already exists" in resp.text:
    print(f"ℹ️ 엔드포인트 '{ENDPOINT_NAME}'가 이미 존재합니다.")
    print(f"   기존 엔드포인트를 사용합니다.")
else:
    print(f"❌ 오류 ({resp.status_code}): {resp.text[:500]}")
Step E-2: 엔드포인트 상태 확인
import time

def check_endpoint_status(host, token, endpoint_name):
    """엔드포인트 상태 확인"""
    resp = requests.get(
        f"https://{host}/api/2.0/serving-endpoints/{endpoint_name}",
        headers={"Authorization": f"Bearer {token}"}
    )
    if resp.status_code == 200:
        data = resp.json()
        state = data.get("state", {})
        return state.get("ready", "UNKNOWN"), state.get("config_update", "UNKNOWN")
    return "ERROR", resp.text[:200]

# 상태 폴링 (최대 20분 대기)
print(f"⏳ 엔드포인트 '{ENDPOINT_NAME}' 준비 대기 중...")
print(f"   (처음 생성 시 5~15분 소요)\n")

for i in range(40):
    ready, config = check_endpoint_status(host, token, ENDPOINT_NAME)
    print(f"   [{i*30}초] Ready: {ready}, Config: {config}")

    if ready == "READY":
        print(f"\n✅ 엔드포인트 준비 완료!")
        break
    elif ready == "ERROR":
        print(f"\n❌ 오류: {config}")
        break

    time.sleep(30)
else:
print("\n⚠️ 시간 초과. Databricks UI의 Serving 페이지에서 상태를 확인하세요.")- 오래걸리고 잘 안됨
- pytorch onyx 모델 사용시 경량화 가능
# PyTorch → ONNX 변환
from optimum.exporters.onnx import main_export
main_export("google/vit-base-patch16-224", output="vit_onnx/")

# ONNX 모델을 MLflow에 로깅
mlflow.onnx.log_model(onnx_model, "model",
    registered_model_name="jhleews.default.vit_onnx")
Step E-3: 서빙 엔드포인트로 추론 테스트
import base64
from io import BytesIO

# 테스트 이미지를 base64로 인코딩
test_image = filtered_data["image"][0]
buf = BytesIO()
test_image.save(buf, format="JPEG")
img_b64 = base64.b64encode(buf.getvalue()).decode("utf-8")

# 엔드포인트 호출
resp = requests.post(
    f"https://{host}/serving-endpoints/{ENDPOINT_NAME}/invocations",
    headers={
        "Authorization": f"Bearer {token}",
        "Content-Type": "application/json"
    },
    json={
        "inputs": [img_b64]
    }
)

if resp.status_code == 200:
    result = resp.json()
    print(f"📷 테스트 이미지: {filtered_data['label_name'][0]}")
    print(f"🔍 서빙 엔드포인트 추론 결과:")
    print(json.dumps(result, indent=2, ensure_ascii=False)[:500])
else:
    print(f"❌ 호출 오류 ({resp.status_code}):")
    print(resp.text[:500])
    print()
    print("💡 엔드포인트가 아직 준비 중일 수 있습니다.")
    print("   Step E-2 셀을 다시 실행하여 상태를 확인하세요.")
Step E-4: 여러 이미지로 배치 테스트
# 5개 카테고리 대표 이미지로 배치 테스트
print("🔍 서빙 엔드포인트 배치 테스트:\n")

for food_name in target_foods:
    idx = filtered_data["label_name"].index(food_name)
    img = filtered_data["image"][idx]

    buf = BytesIO()
    img.save(buf, format="JPEG")
    img_b64 = base64.b64encode(buf.getvalue()).decode("utf-8")

    resp = requests.post(
        f"https://{host}/serving-endpoints/{ENDPOINT_NAME}/invocations",
        headers={
            "Authorization": f"Bearer {token}",
            "Content-Type": "application/json"
        },
        json={"inputs": [img_b64]}
    )

    if resp.status_code == 200:
        result = resp.json()
        # 결과 형태에 따라 파싱
        predictions = result.get("predictions", result)
        print(f"📷 [{food_name}] → {str(predictions)[:120]}")
    else:
        print(f"📷 [{food_name}] → ❌ 오류: {resp.status_code}")
Step E-5: 엔드포인트 정리
resp = requests.delete(
     f"https://{host}/api/2.0/serving-endpoints/{ENDPOINT_NAME}",
     headers={"Authorization": f"Bearer {token}"}
 )
 if resp.status_code == 200:
     print(f"✅ 엔드포인트 '{ENDPOINT_NAME}' 삭제 완료")
 else:
     print(f"❌ 삭제 실패: {resp.text}")
Lab09: Streamlit 웹 서비스 — 이미지 분류 & 캡셔닝
이미지 분류(ViT) + 캡셔닝(Foundation Model API) 파이프라인을
Streamlit 웹 앱으로 만들어 실제 서비스처럼 사용
학습 목표
- ML 모델을 웹 서비스로 래핑하는 방법 이해
- Streamlit으로 인터랙티브 UI 구현
- Databricks Driver Proxy를 통한 웹 앱 접근
- Foundation Model API를 REST로 호출하는 패턴
아키텍처
사용자 (브라우저)
    │  이미지 업로드
    ▼
┌──────────────────────────────────┐
│  Streamlit 웹 앱 (Driver Node)   │
│                                  │
│  ┌────────────┐ ┌──────────────┐ │
│  │ ViT 분류   │ │ Foundation   │ │
│  │ (로컬모델) │ │ Model API    │ │
│  └────────────┘ └──────────────┘ │
└──────────────────────────────────┘
    │  결과 반환
    ▼
사용자 (분류 + 캡션 결과 확인)클러스터: ML Runtime 14.x 이상
환경설정
%pip install streamlit transformers torch torchvision Pillow --quiet
dbutils.library.restartPython()
설정값
import os

# ── HuggingFace 캐시 설정 (Databricks 권한 이슈 방지) ──
os.environ["HF_HOME"] = "/tmp/hf_home"
os.environ["TRANSFORMERS_CACHE"] = "/tmp/hf_cache"

# ── Databricks 접속 정보 (Streamlit 앱 → Foundation Model API 호출용) ──
ctx = dbutils.notebook.entry_point.getDbutils().notebook().getContext()

DATABRICKS_HOST = ctx.browserHostName().get()
DATABRICKS_TOKEN = ctx.apiToken().get()

# ── 비전 모델 엔드포인트 (Lab07에서 사용한 것과 동일) ──
VISION_MODEL = "databricks-gemma-3-12b"

# ── 클러스터 정보 (Driver Proxy URL 생성용) ──
CLUSTER_ID = spark.conf.get("spark.databricks.clusterUsageTags.clusterId")
ORG_ID = ctx.workspaceId().get()

print(f"✅ Host: {DATABRICKS_HOST}")
print(f"✅ Cluster ID: {CLUSTER_ID}")
print(f"✅ Vision Model: {VISION_MODEL}")
Part B: Streamlit 앱 코드 작성
Streamlit 앱의 전체 코드를 /tmp/image_app.py 파일로 저장
# ── Streamlit 앱 전체 코드 ──

app_code = r'''
import streamlit as st
import requests
import base64
import json
import os
from io import BytesIO
from PIL import Image

# ━━━━━━━━━━━━━━━━━━━━━━━━━━━━━━━━━━━━━
# 환경 변수에서 설정 읽기
# ━━━━━━━━━━━━━━━━━━━━━━━━━━━━━━━━━━━━━
DATABRICKS_HOST = os.environ.get("DATABRICKS_HOST", "")
DATABRICKS_TOKEN = os.environ.get("DATABRICKS_TOKEN", "")
VISION_MODEL = os.environ.get("VISION_MODEL", "databricks-gemma-3-12b")

os.environ["HF_HOME"] = "/tmp/hf_home"
os.environ["TRANSFORMERS_CACHE"] = "/tmp/hf_cache"


# ━━━━━━━━━━━━━━━━━━━━━━━━━━━━━━━━━━━━━
# 페이지 설정
# ━━━━━━━━━━━━━━━━━━━━━━━━━━━━━━━━━━━━━
st.set_page_config(
    page_title="AI Image Analyzer",
    page_icon="🖼️",
    layout="wide"
)

st.title("🖼️ AI 이미지 분석기")
st.markdown("**이미지를 업로드하면 자동으로 분류하고 설명을 생성합니다.**")
st.markdown("---")


# ━━━━━━━━━━━━━━━━━━━━━━━━━━━━━━━━━━━━━
# ViT 모델 로딩 (캐시)
# ━━━━━━━━━━━━━━━━━━━━━━━━━━━━━━━━━━━━━
@st.cache_resource
def load_vit_model():
    """ViT 이미지 분류 모델을 로딩하고 캐시합니다."""
    from transformers import pipeline
    classifier = pipeline(
        "image-classification",
        model="google/vit-base-patch16-224",
    )
    return classifier


# ━━━━━━━━━━━━━━━━━━━━━━━━━━━━━━━━━━━━━
# Foundation Model API — 이미지 캡셔닝
# ━━━━━━━━━━━━━━━━━━━━━━━━━━━━━━━━━━━━━
def get_image_caption(image: Image.Image, prompt: str) -> str:
    """Databricks Foundation Model API로 이미지 캡셔닝"""
    # 이미지 → base64 인코딩
    buffered = BytesIO()
    image_rgb = image.convert("RGB")
    image_rgb.save(buffered, format="JPEG", quality=85)
    img_base64 = base64.b64encode(buffered.getvalue()).decode("utf-8")

    # REST API 호출
    url = f"https://{DATABRICKS_HOST}/serving-endpoints/{VISION_MODEL}/invocations"
    headers = {
        "Authorization": f"Bearer {DATABRICKS_TOKEN}",
        "Content-Type": "application/json"
    }
    payload = {
        "messages": [
            {
                "role": "user",
                "content": [
                    {
                        "type": "image_url",
                        "image_url": {"url": f"data:image/jpeg;base64,{img_base64}"}
                    },
                    {
                        "type": "text",
                        "text": prompt
                    }
                ]
            }
        ],
        "max_tokens": 500,
        "temperature": 0.7
    }

    try:
        response = requests.post(url, headers=headers, json=payload, timeout=60)
        response.raise_for_status()
        result = response.json()
        return result["choices"][0]["message"]["content"]
    except requests.exceptions.HTTPError as e:
        return f"API 오류 ({response.status_code}): {response.text[:200]}"
    except Exception as e:
        return f"오류: {str(e)}"


# ━━━━━━━━━━━━━━━━━━━━━━━━━━━━━━━━━━━━━
# 사이드바
# ━━━━━━━━━━━━━━━━━━━━━━━━━━━━━━━━━━━━━
with st.sidebar:
    st.header("⚙️ 설정")

    prompt_option = st.selectbox(
        "캡셔닝 프롬프트",
        [
            "이 이미지를 한국어로 자세히 설명해주세요.",
            "이 이미지에 있는 물체들을 나열해주세요.",
            "이 이미지의 분위기와 느낌을 한국어로 설명해주세요.",
            "이 음식의 이름과 재료를 추측해주세요.",
            "직접 입력"
        ]
    )

    if prompt_option == "직접 입력":
        custom_prompt = st.text_area("프롬프트 입력", value="이 이미지를 분석해주세요.")
    else:
        custom_prompt = prompt_option

    top_k = st.slider("분류 결과 Top-K", min_value=1, max_value=10, value=5)

    st.markdown("---")
    st.markdown("**모델 정보**")
    st.markdown(f"- 분류: `ViT-base-patch16-224`")
    st.markdown(f"- 캡셔닝: `{VISION_MODEL}`")
    st.markdown("---")
    st.markdown("**사용법**")
    st.markdown("1. 이미지 파일 업로드")
    st.markdown("2. 자동으로 분류 + 캡셔닝 실행")
    st.markdown("3. 프롬프트를 바꿔가며 실험")


# ━━━━━━━━━━━━━━━━━━━━━━━━━━━━━━━━━━━━━
# 메인 영역
# ━━━━━━━━━━━━━━━━━━━━━━━━━━━━━━━━━━━━━
uploaded_file = st.file_uploader(
    "이미지를 업로드하세요",
    type=["jpg", "jpeg", "png", "webp", "bmp"],
    help="지원 형식: JPG, PNG, WebP, BMP"
)

if uploaded_file is not None:
    image = Image.open(uploaded_file)

    col1, col2 = st.columns([1, 1])

    # ── 왼쪽: 업로드된 이미지 ──
    with col1:
        st.subheader("📷 업로드된 이미지")
        st.image(image, use_container_width=True)
        st.caption(f"파일: {uploaded_file.name} | 크기: {image.size[0]} x {image.size[1]}")

    # ── 오른쪽: 분석 결과 ──
    with col2:
        st.subheader("🔍 분석 결과")

        # 1) 이미지 분류
        with st.spinner("🏷️ 이미지 분류 중..."):
            try:
                classifier = load_vit_model()
                results = classifier(image, top_k=top_k)

                st.markdown("#### 🏷️ 이미지 분류 (ViT)")
                for i, r in enumerate(results):
                    label = r["label"]
                    score = r["score"]
                    st.progress(score, text=f"{i+1}. {label} ({score:.1%})")
            except Exception as e:
                st.error(f"분류 오류: {str(e)}")
                results = []

        st.markdown("---")

        # 2) 이미지 캡셔닝
        with st.spinner("💬 이미지 설명 생성 중..."):
            caption = get_image_caption(image, custom_prompt)
            st.markdown("#### 💬 AI 이미지 설명")
            st.info(caption)

    # ── 하단: 상세 정보 ──
    with st.expander("📊 상세 분류 결과 (JSON)"):
        if results:
            st.json(results)
        else:
            st.write("분류 결과가 없습니다.")

    # ── 재실행 버튼 ──
    st.markdown("---")
    col_a, col_b, col_c = st.columns([1, 1, 1])
    with col_b:
        if st.button("🔄 다른 프롬프트로 캡셔닝 재실행", use_container_width=True):
            with st.spinner("💬 재생성 중..."):
                new_caption = get_image_caption(image, custom_prompt)
                st.info(new_caption)

else:
    # ── 업로드 전 안내 화면 ──
    st.info("👆 위에서 이미지를 업로드하면 AI가 자동으로 분석합니다.")

    col_a, col_b, col_c = st.columns(3)
    with col_a:
        st.markdown("### 🏷️ 이미지 분류")
        st.markdown("ViT 모델이 1,000개 카테고리 중에서 이미지의 종류를 판별합니다.")
    with col_b:
        st.markdown("### 💬 이미지 캡셔닝")
        st.markdown("Foundation Model API가 이미지를 보고 한국어 설명을 생성합니다.")
    with col_c:
        st.markdown("### 🔄 프롬프트 실험")
        st.markdown("사이드바에서 프롬프트를 바꿔가며 다양한 설명을 받아보세요.")
'''

# 앱 코드를 파일로 저장
with open("/tmp/image_app.py", "w", encoding="utf-8") as f:
    f.write(app_code)

print("✅ Streamlit 앱 코드 저장 완료: /tmp/image_app.py")
print(f" 파일 크기: {os.path.getsize('/tmp/image_app.py'):,} bytes")- 실습인지라 노트북에서 토큰을 발급
- 실제로 사용할것이라면 databricks단에서 토큰을 발급
Part C: 앱 실행 & 접속
Step 3: Streamlit 앱 실행
import subprocess
import time
import os

# ── 환경 변수 설정 (Streamlit 앱에서 API 호출 시 사용) ──
os.environ["DATABRICKS_HOST"] = DATABRICKS_HOST
os.environ["DATABRICKS_TOKEN"] = DATABRICKS_TOKEN
os.environ["VISION_MODEL"] = VISION_MODEL

# ── 기존 Streamlit 프로세스 종료 ──
subprocess.run(["pkill", "-f", "streamlit"], capture_output=True)
time.sleep(2)

# ── 앱 실행 (백그라운드) ──
PORT = 8501

process = subprocess.Popen(
    [
        "streamlit", "run", "/tmp/image_app.py",
        "--server.port", str(PORT),
        "--server.headless", "true",
        "--server.address", "0.0.0.0",
        "--browser.gatherUsageStats", "false",
        "--server.enableCORS", "false",
        "--server.enableXsrfProtection", "false",
    ],
    stdout=subprocess.PIPE,
    stderr=subprocess.PIPE,
    env=os.environ.copy()
)

# 서버 기동 대기
time.sleep(5)

# 프로세스 확인
if process.poll() is None:
    print(f"✅ Streamlit 앱 실행 중! (PID: {process.pid}, Port: {PORT})")
else:
    stderr_output = process.stderr.read().decode()
    print(f"❌ 앱 실행 실패:\n{stderr_output}")
Step 4: 접속 URL 확인
# ── Driver Proxy URL 생성 ──
proxy_url = f"https://{DATABRICKS_HOST}/driver-proxy/o/{ORG_ID}/{CLUSTER_ID}/{PORT}/"

print("=" * 60)
print("🌐 Streamlit 앱 접속 URL")
print("=" * 60)
print()
print(f"  {proxy_url}")
print()
print("📌 사용법:")
print("   1. 위 URL을 브라우저 새 탭에 붙여넣기")
print("   2. 이미지 파일을 드래그 & 드롭으로 업로드")
print("   3. AI가 자동으로 분류 + 설명 생성")
print()
print("⚠️ Databricks 워크스페이스에 로그인된")
print("   브라우저에서만 접속 가능합니다.")
print("=" * 60)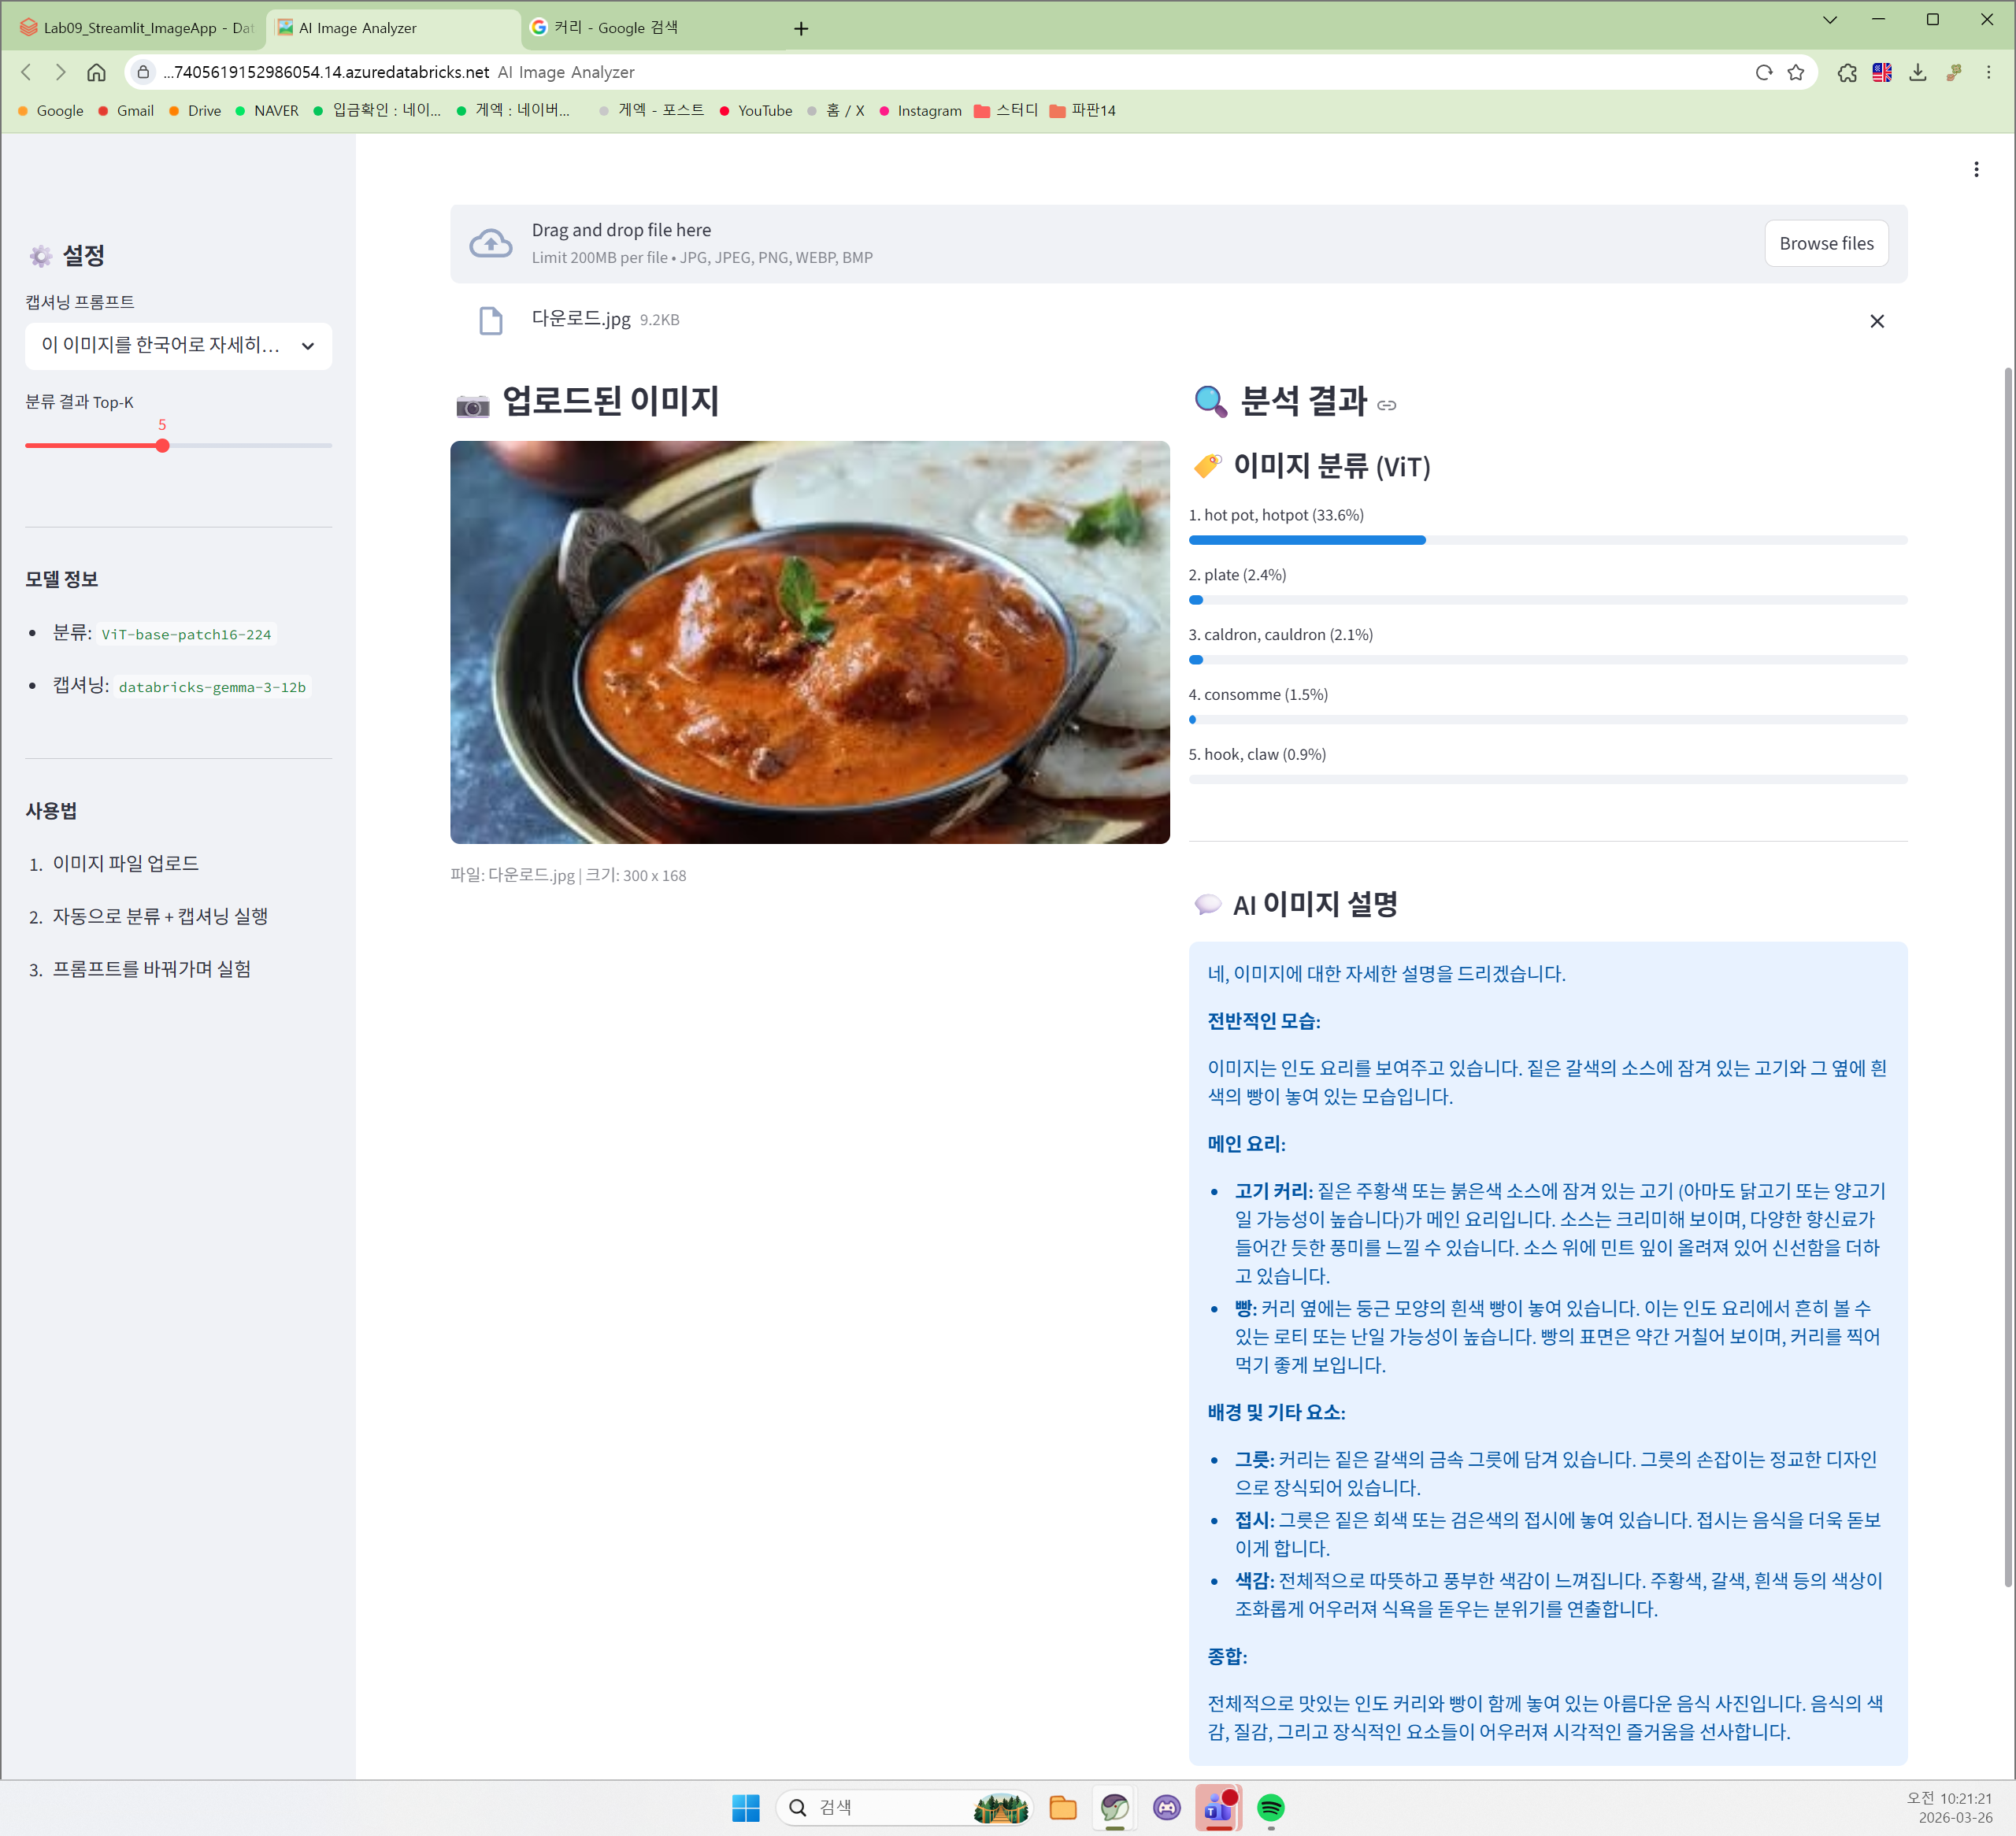
Part D: 관리 & 디버깅
앱 상태 확인
# 실행 중인 Streamlit 프로세스 확인
import subprocess

result = subprocess.run(["pgrep", "-af", "streamlit"], capture_output=True, text=True)
if result.stdout.strip():
    print("✅ Streamlit 프로세스 목록:")
    for line in result.stdout.strip().split("\n"):
        print(f"   {line}")
else:
    print("❌ Streamlit 프로세스가 없습니다.")
    print("   → Part C의 Step 3 셀을 다시 실행하세요.")
에러 로그 확인 (문제 발생 시)
# 앱이 비정상 종료된 경우 로그 확인
try:
    if process.poll() is not None:
        stdout = process.stdout.read().decode()
        stderr = process.stderr.read().decode()
        if stderr:
            print("=== 에러 로그 ===")
            print(stderr[-3000:])
        if stdout:
            print("\n=== 표준 출력 ===")
            print(stdout[-1000:])
    else:
        print("✅ 앱이 정상 실행 중입니다.")
except:
    print("ℹ️ 프로세스 정보를 가져올 수 없습니다. Step 3을 다시 실행해주세요.")
앱 코드 수정 후 재시작
코드를 수정하고 싶으면:
1. Part B의 app_code 내용을 수정
2. Part B 셀 실행 (파일 저장)
3. 아래 셀 실행 (재시작)
# 앱 재시작 (코드 수정 후 실행)
import subprocess, time, os

subprocess.run(["pkill", "-f", "streamlit"], capture_output=True)
time.sleep(2)

process = subprocess.Popen(
    [
        "streamlit", "run", "/tmp/image_app.py",
        "--server.port", str(PORT),
        "--server.headless", "true",
        "--server.address", "0.0.0.0",
        "--browser.gatherUsageStats", "false",
        "--server.enableCORS", "false",
        "--server.enableXsrfProtection", "false",
    ],
    stdout=subprocess.PIPE,
    stderr=subprocess.PIPE,
    env=os.environ.copy()
)
time.sleep(5)

if process.poll() is None:
    print(f"✅ 앱 재시작 완료! (PID: {process.pid})")
    print(f"📎 URL: https://{DATABRICKS_HOST}/driver-proxy/o/{ORG_ID}/{CLUSTER_ID}/{PORT}/")
else:
    print("❌ 재시작 실패. 에러 로그 확인 셀을 실행하세요.")
앱 종료
import subprocess
subprocess.run(["pkill", "-f", "streamlit"], capture_output=True)
print("✅ Streamlit 앱이 종료되었습니다.")
정리
| 개념 | 설명 |
|---|---|
| Streamlit | Python만으로 인터랙티브 웹 UI를 빠르게 구현 |
| 모델 서빙 | ViT 모델을 웹 앱에 통합하여 실시간 추론 |
| REST API | Foundation Model API를 HTTP로 호출하여 캡셔닝 |
| Driver Proxy | Databricks 클러스터의 웹 앱을 브라우저로 접근 |
| @st.cache_resource | 모델을 한 번만 로딩하여 성능 최적화 |
핵심 코드 패턴
# 1. 모델 캐싱 — 매 요청마다 재로딩 방지
@st.cache_resource
def load_model():
    return pipeline("image-classification", model="google/vit-base-patch16-224")

# 2. REST API 호출 — Foundation Model API
response = requests.post(
    f"https://{host}/serving-endpoints/{model}/invocations",
    headers={"Authorization": f"Bearer {token}"},
    json={"messages": [{"role": "user", "content": [...]}]}
)

# 3. Driver Proxy URL — Databricks 내 웹 앱 접속
url = f"https://{host}/driver-proxy/o/{org_id}/{cluster_id}/{port}/"
실무 확장
- Databricks Apps: Streamlit 앱을 Databricks 전용 앱으로 배포 (별도 컴퓨트)
- Azure App Service: 외부 사용자도 접근 가능한 URL로 배포
- Model Serving Endpoint: ViT도 서빙 엔드포인트로 배포하면 클러스터 없이 추론 가능
- 배치 파이프라인: 대량 이미지를 Delta Table로 처리하는 자동화 파이프라인과 결합
Data Engineering
카탈로그에서 볼륨 만들기
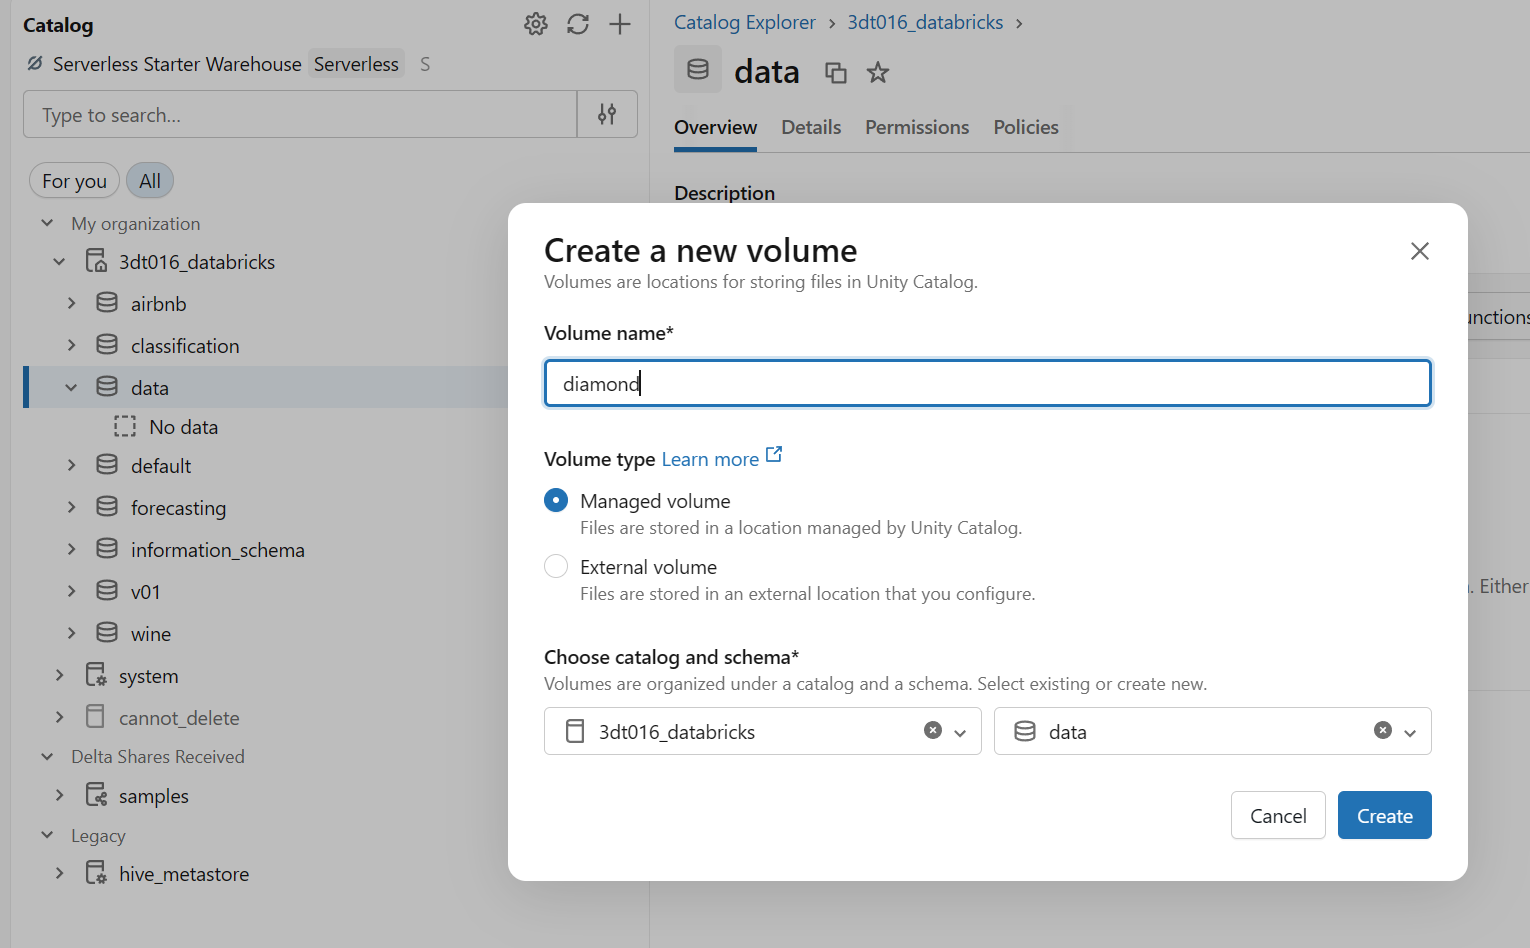
1. 스키마 생성
2. create에서 volume 선택
3. csv 파일 업로드
# 2. 업로드된 파일 경로 설정 (사용자 지정 경로)
# 해당 경로 아래에 csv 파일이 있다고 가정합니다. 만약 파일명이 포함되지 않은 디렉토리 경로라면 /*.csv를 붙여줍니다.
source_path = "/Volumes/3dt016_databricks/data/diamond/*.csv"

# CSV 파일 읽기
df_raw = spark.read.format("csv") \
  .option("header", "true") \
  .option("inferSchema", "true") \
  .load(source_path)

# 데이터 확인
print(f"총 {df_raw.count()} 건의 데이터를 로드했습니다.")
display(df_raw.limit(5))

# Bronze 테이블로 저장 (Raw Data 보존)
# Delta Lake 형식으로 저장하여 성능과 안정성을 확보합니다.
df_raw.write.format("delta").mode("overwrite").saveAsTable("bronze_diamonds")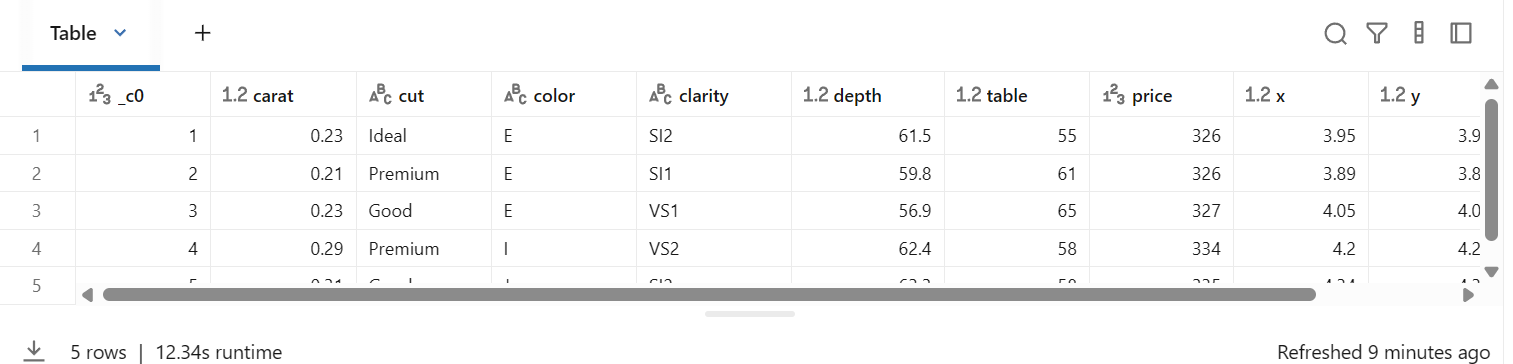
# 필요한 라이브러리 임포트
from pyspark.sql.functions import col, when, round, avg, current_timestamp
from pyspark.sql.types import DoubleType

# 3. Bronze 테이블 읽기
from pyspark.sql.functions import col, round, current_timestamp, when
# 3. Bronze 테이블 읽기
df_bronze = spark.read.table("bronze_diamonds")


# 데이터 변환 (Transformation)
df_silver = df_bronze \
    .withColumn("price", col("price").cast(DoubleType())) \
    .withColumn("volume", round(col("x") * col("y") * col("z"), 2)) \
    .withColumn("ingestion_time", current_timestamp()) \
    .filter((col("x") > 0) & (col("y") > 0) & (col("z") > 0)) # 크기가 0인 잘못된 데이터 제거

# 품질 등급(Quality Flag) 파생 변수 생성
df_silver = df_silver.withColumn(
    "quality_flag",
    when(col("cut").isin("Ideal", "Premium"), "High").otherwise("Standard")
)

# Silver 테이블 저장
df_silver.write.format("delta").mode("overwrite").option("mergeSchema", "true").saveAsTable("silver_diamonds_enriched")

print("Silver Layer 생성 완료")
display(df_silver.limit(5))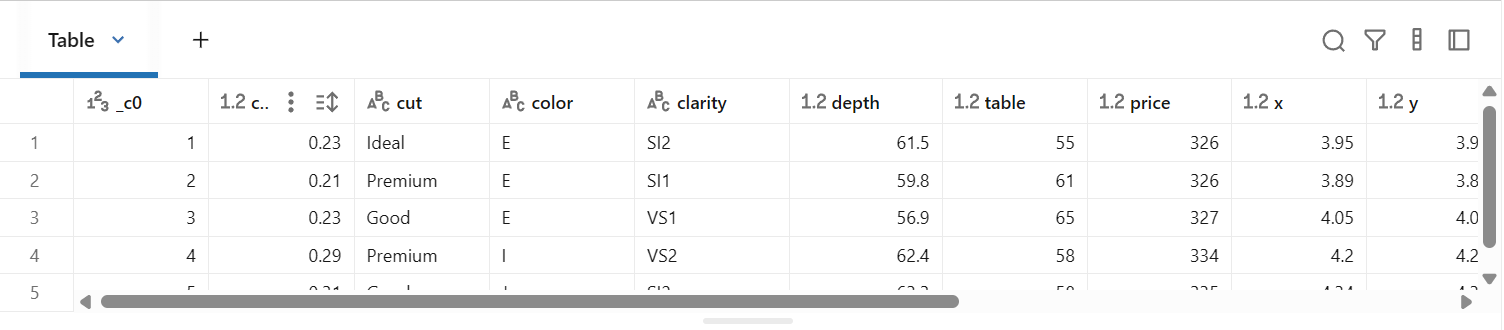
# 4. Silver 테이블 읽기
df_silver = spark.read.table("silver_diamonds_enriched")

# 집계 분석
df_gold = df_silver.groupBy("cut", "color") \
    .agg(
        avg("price").alias("avg_price"),
        avg("carat").alias("avg_carat"),
        round(avg("price") / avg("carat"), 2).alias("price_per_carat_index")
    ) \
    .orderBy("avg_price", ascending=False)

# Gold 테이블 저장
df_gold.write.format("delta").mode("overwrite").saveAsTable("gold_diamond_analytics")

print("Gold Layer 생성 완료")
display(df_gold)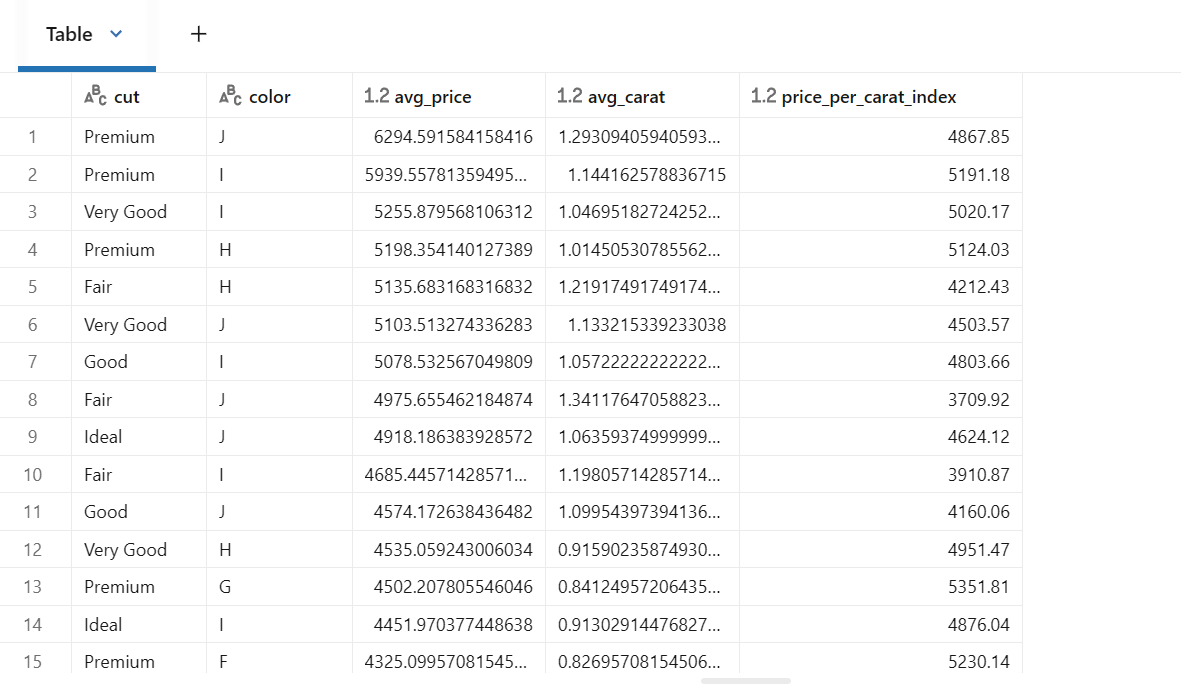
%sql
-- Gold 테이블 조회
SELECT
    cut,
    color,
    avg_price,
    price_per_carat_index
FROM gold_diamond_analytics
WHERE cut IN ('Ideal', 'Premium', 'Very Good')
ORDER BY price_per_carat_index DESC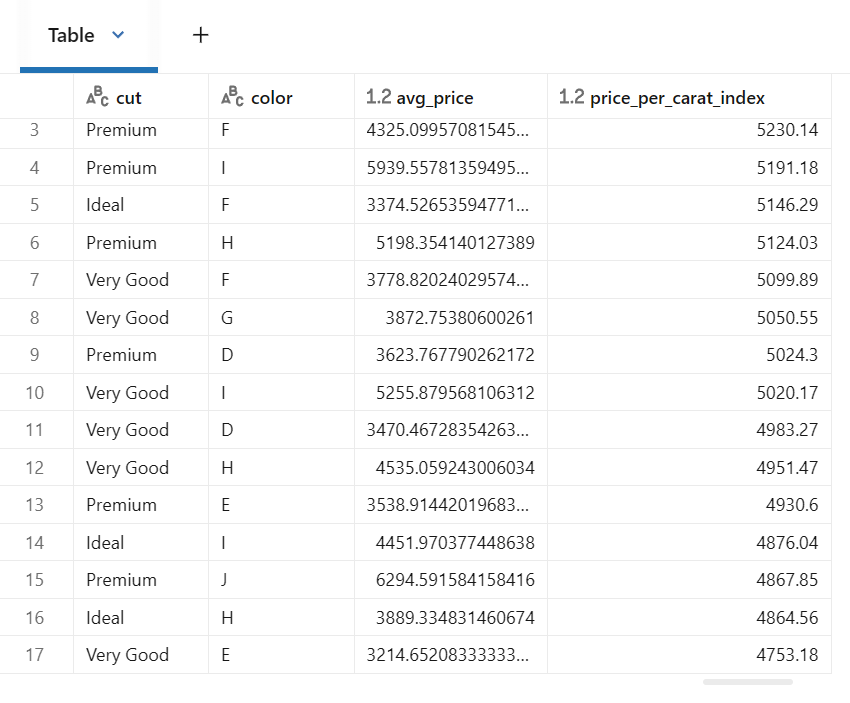
파티셔닝 전략
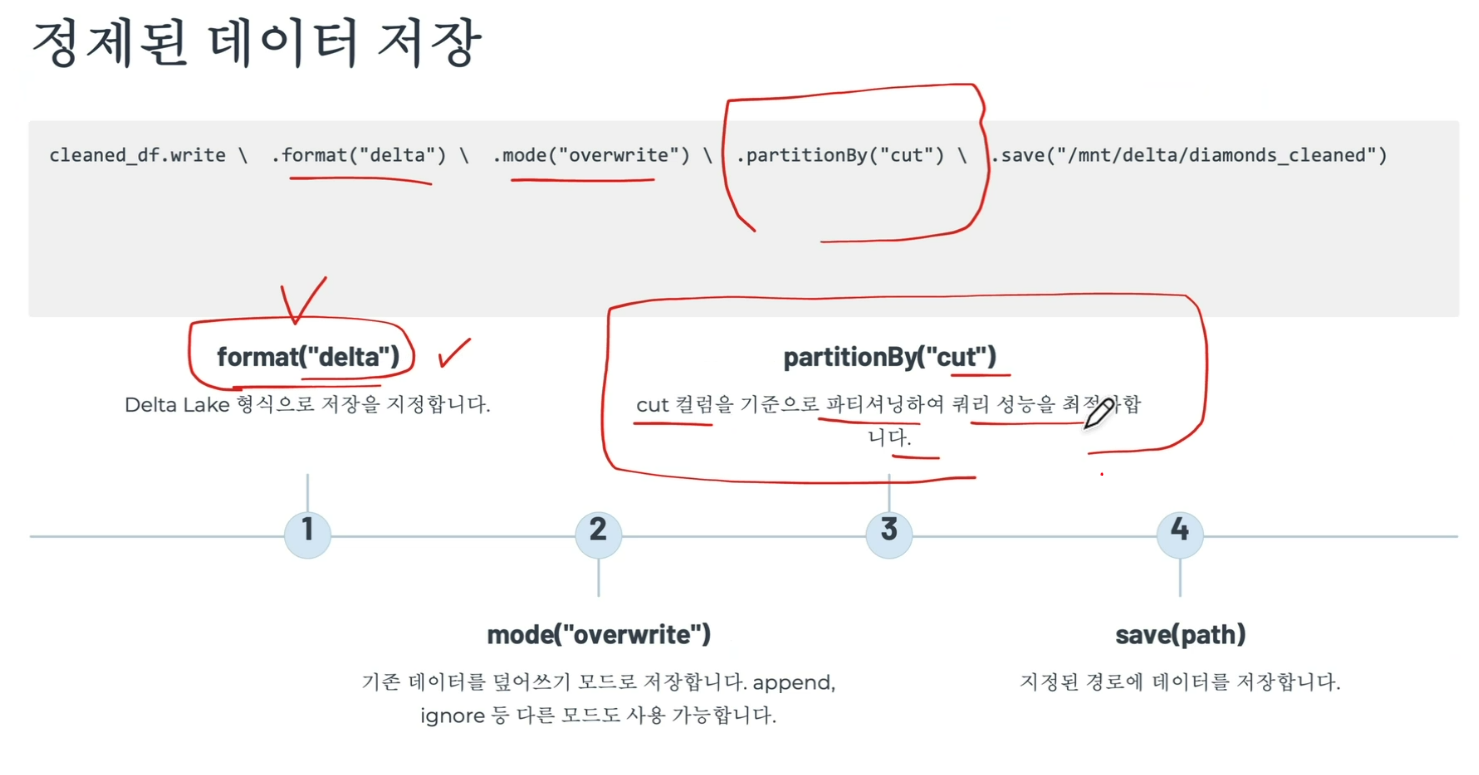
파티셔닝: 데이터를 특정 컬럼 값에 따라 디렉토리로 분할하여 저장하는 기법
쿼리 시 필요한 파티션만 읽어 I/O를 크게 줄일 수 있음
앞선 예제에서는 cut 컬럼으로 파티셔닝하여 Fair, Good, Very Good, Premium, Ideal의 5개의 파티션이 생성됨
파티셔닝 선택 기준
- 카디널리티: 너무 많거나 적지 않은 적절한 수의 고유 값을 가진 컬럼 선택
- 쿼리 패턴: 자주 필터링되는 컬럼을 파티션 키로 선택
- 데이터 분포: 각 파티션의 데이터 크기가 비교적 균등한 컬럼 선ㅌ개
- 조인 최적화: 조인에 자주 사용되는 컬럼 고려
ETL 파이프라인 흐름
1. 데이터 추출: Databricks 샘플 경로에서 CSV 파일 읽기
2. 스키마 확인: 데이터 구조 및 타입 검증
3. 데이터 정제: 이상치 제거 및 필터링
4. 파생 컬럼 생성: 비즈니스 로직 적용
5. 집계 분석: 품질별 통계 계산
6. Delta Lake 저장 : 최적화된 형식으로 영구 저장
성능 최적화 팁
1. 적절한 파티셔닝
자주 필터링되는 컬럼을 파티션 키로 선택하여 불필요한 데이터 스캔 줄이기
2. 캐싱 활용
여러 번 사용되는 DataFrame은 cache()또는 persist()로 메모리에 저장
3. 브로드캐스트 조인
작은 테이블은 broadcast()를 사용하여 모든 노드에 복제하면 셔플을 피할 수 있음
4. 컬럼 프루닝
필요한 컬럼만 select 하여 메모리 사용량과 I/O를 최소화
5. 필터 푸시다운
가능한 한 일찍 filter를 적용하여 처리할 데이터 양을 줄임
실무 활용 시나리오
일일 배치 처리
매일 새로운 다이아몬드 거래 데이터를 수집하여 정제하고 Delta Lake에 적재하는 배치 작업 스케줄링
Databricks Jobs를 사용하여 자동화
실시간 분석
Delta Lake에 저장된 데이터를 SQL 쿼리나 BI 도구로 실시간 분석하여 재고 관리, 가격 책정 전략 수립
머신러닝 피처
정제된 데이터와 파생 컬럼을 머신러닝 모델의 피처로 활용하여 가격 예측 모델 구축
증분 처리 패턴
전체 덮어쓰기 vs 증분 업데이트
실무에서는 새로운 데이터만 추가하거나 변경된 데이터만 업데이트하는 증분 처리가 효율적
| 방식 | 설명 | 특징/적합한 경우 |
|---|---|---|
| Append 모드 | 새로운 레코드를 기존 테이블에 추가 | processing_date 같은 타임스탬프 컬럼으로 신규 데이터 식별 |
| Merge (Upsert) 패턴 | 기존 레코드는 업데이트하고, 새 레코드는 삽입 | Delta Lake MERGE 사용, CDC(Change Data Capture) 시나리오에 적합 |
CDC: 데이터베이스에서 발생하는 행 수준의 변경 사항을 실시간으로 식별, 캡처하여 타 시스템으로 전달하는 데이터 통합 기술
소스 DB에 부하를 거의 주지 않고 트랜잭션 로그를 기반으로 변경된 데이터만 효율적으로 복제
- Azure Data Factory
모니터링 및 로깅
메트릭: 모니터링의 대상, 단위
주요 모니터링 항목
- 처리 레코드 수: 입력과 출력 레코드 수 비교
- 실행 시간: 파이프라인 성능 추적
- 에러율: 실패한 레코드나 예외 발생 건수
- 데이터 품질 메트릭: null 비율, 중복 건수 등
- 리소스 사용량: CPU, 메모리, 디스크 I/O
에러 핸들링 모범 사례
Try-Except 블록
Bad Records 처리
읽기 시 badRecordsPath 옵션을 사용하여 파싱 실패한 레코드를 별도 경로에 저장하고 나중에 분석
재시도 로직
알림 시스템
중요한 에러 발생 시 이메일, Slack 등으로 즉시 알림을 보내 신속한 대응이 가능하도록 함
마이크로서비스 ↔ 모놀리스
사라진이유: 유지보수가 복잡
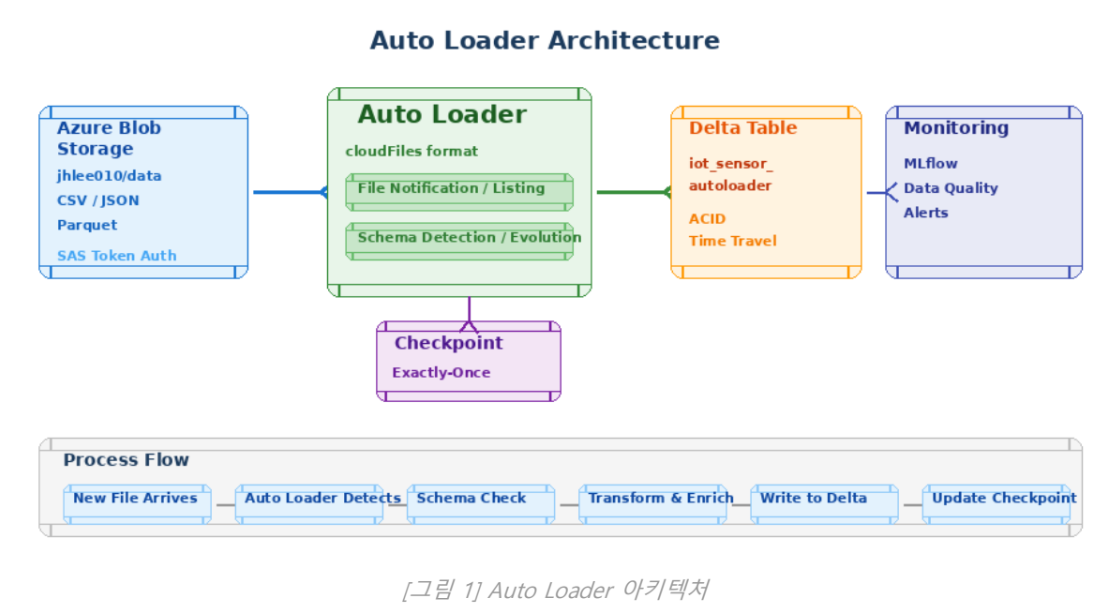
실습 8: Auto Loader — 스트리밍 데이터 수집
Azure Blob Storage에서 Auto Loader를 사용하여 새로운 파일이 도착하면 자동으로 Delta 테이블에 적재(증분처리)
- Auto Loader의 개념과 동작 원리
- cloudFiles 포맷으로 스트리밍 수집
- Schema Evolution (스키마 자동 진화)
- 체크포인트를 이용한 정확히 한 번(Exactly-Once) 처리
| 개념 | 설명 |
|---|---|
| Auto Loader | 클라우드 스토리지의 새 파일을 자동으로 감지하여 증분 처리하는 Databricks 기능 |
| cloudFiles | Auto Loader의 Spark 데이터 소스 포맷 이름. readStream.format("cloudFiles")로 사용 |
| Checkpoint | 어디까지 처리했는지 기록하는 위치 — 재시작해도 중복 없이 이어서 처리 |
| Schema Evolution | 새 컬럼이 추가되어도 자동으로 스키마를 업데이트.ALTER TABLE 불필요. |
| SAS (Shared Access Signature) | Azure Storage 접근을 위한 토큰 기반 인증 방식.시간 제한, 권한 제한 가능. |
이론적 배경
2.1 Auto Loader 아키텍처
Auto Loader는 클라우드 스토리지(Azure Blob, AWS S3, GCS)에 새로 도착하는 파일을 자동으로 감지하는 2가지 방식을 제공
- Directory Listing: 주기적으로 디렉토리를 스캠하여 새 파일 감지. 설정이 간단하지만 파일이 많으면 느릴 수 있음.
- File Notification: 클라우드 이벤트 알림을 사용. 수백만 파일에도 효율적. Azure Event Grid 또는 AWS SNS/SQS 활용.
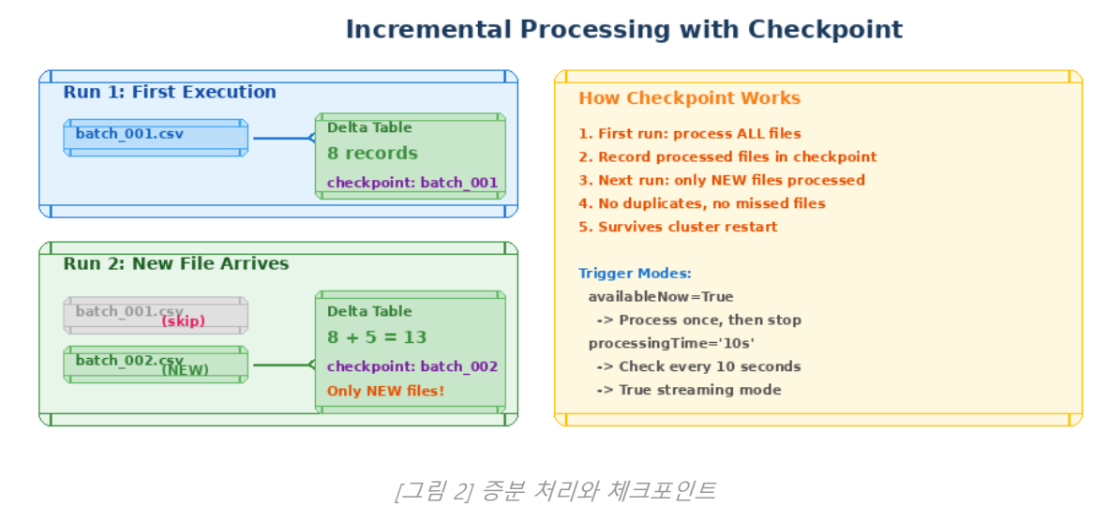
2.2 증분 처리와 체크포인트
- 어떤 파일까지 처리했는지 기록하여, 다음 실행 시 새 파일만 처리
- 클러스터가 재시작되더라도 중복이나 누락 없이 정확히 한 번(Exactly-Once) 처리를 보장
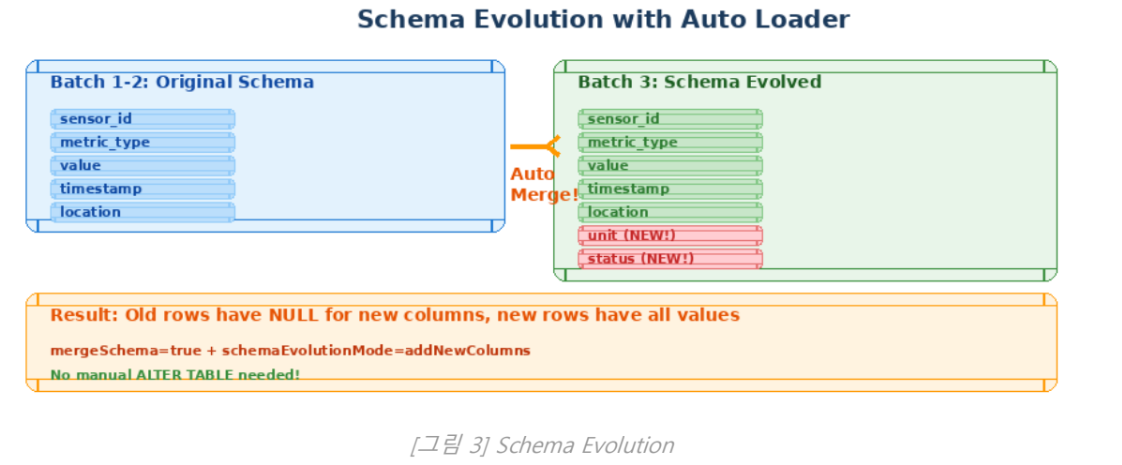
2.3 Schema Evolution
- Auto Loader는 새로운 파일에 새 컨럼이 추가되어도 자동으로 스키마를 업데이트
- 기존 데이터의 새 컬럼은 NULL로 채워짐
- schemaEvolutionMode=addNewColumns 옵션으로 활성화
Azure Storage SAS 연결
1. Azure Portal에서 스토리지 계정 생성
참고: ~managed 리소스 그룹은 자동으로 생성되는 그룹이며, 클라우드가 managing하는 리소스 그룹이다.
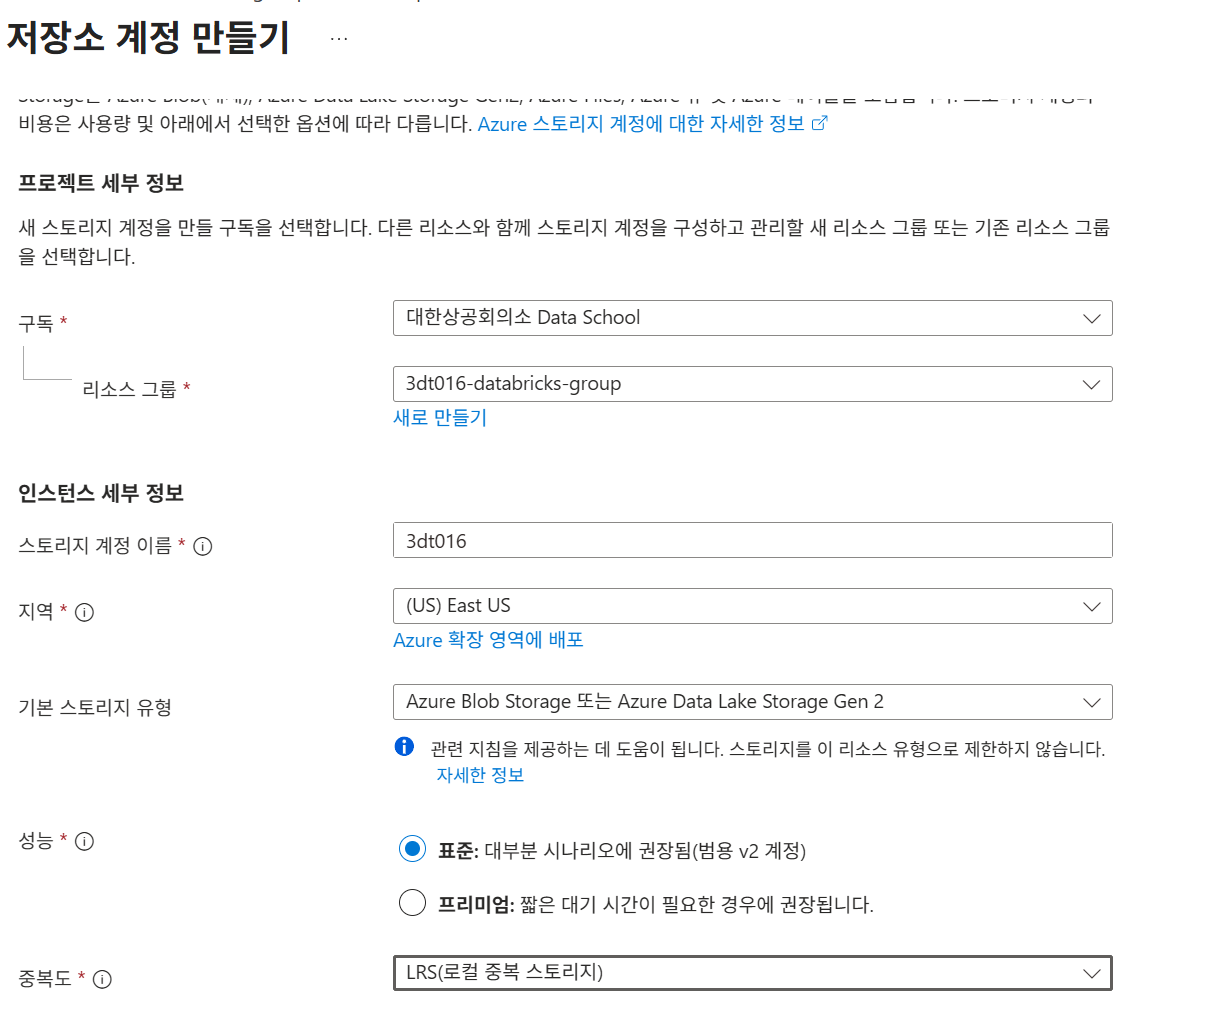
다음 페이지에서 계층 구조 네임스페이스를 켜면 ADLS Gen2 사용
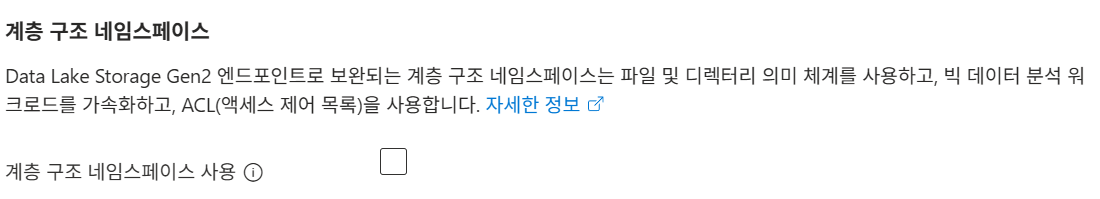
Azure Blob Storage vs Azure Data Lake Storage Gen2
- DataLake쪽이 Blob Storage의 차세대 기술로, 계층적 파일 시스템을 지원
- 보통 프로덕트에서는 ADLS Gen2 사용
2. SAS 토큰 생성 후 Spark 설정에 등록
공유 액세스 서명의 허용되는 리소스 종류 체크
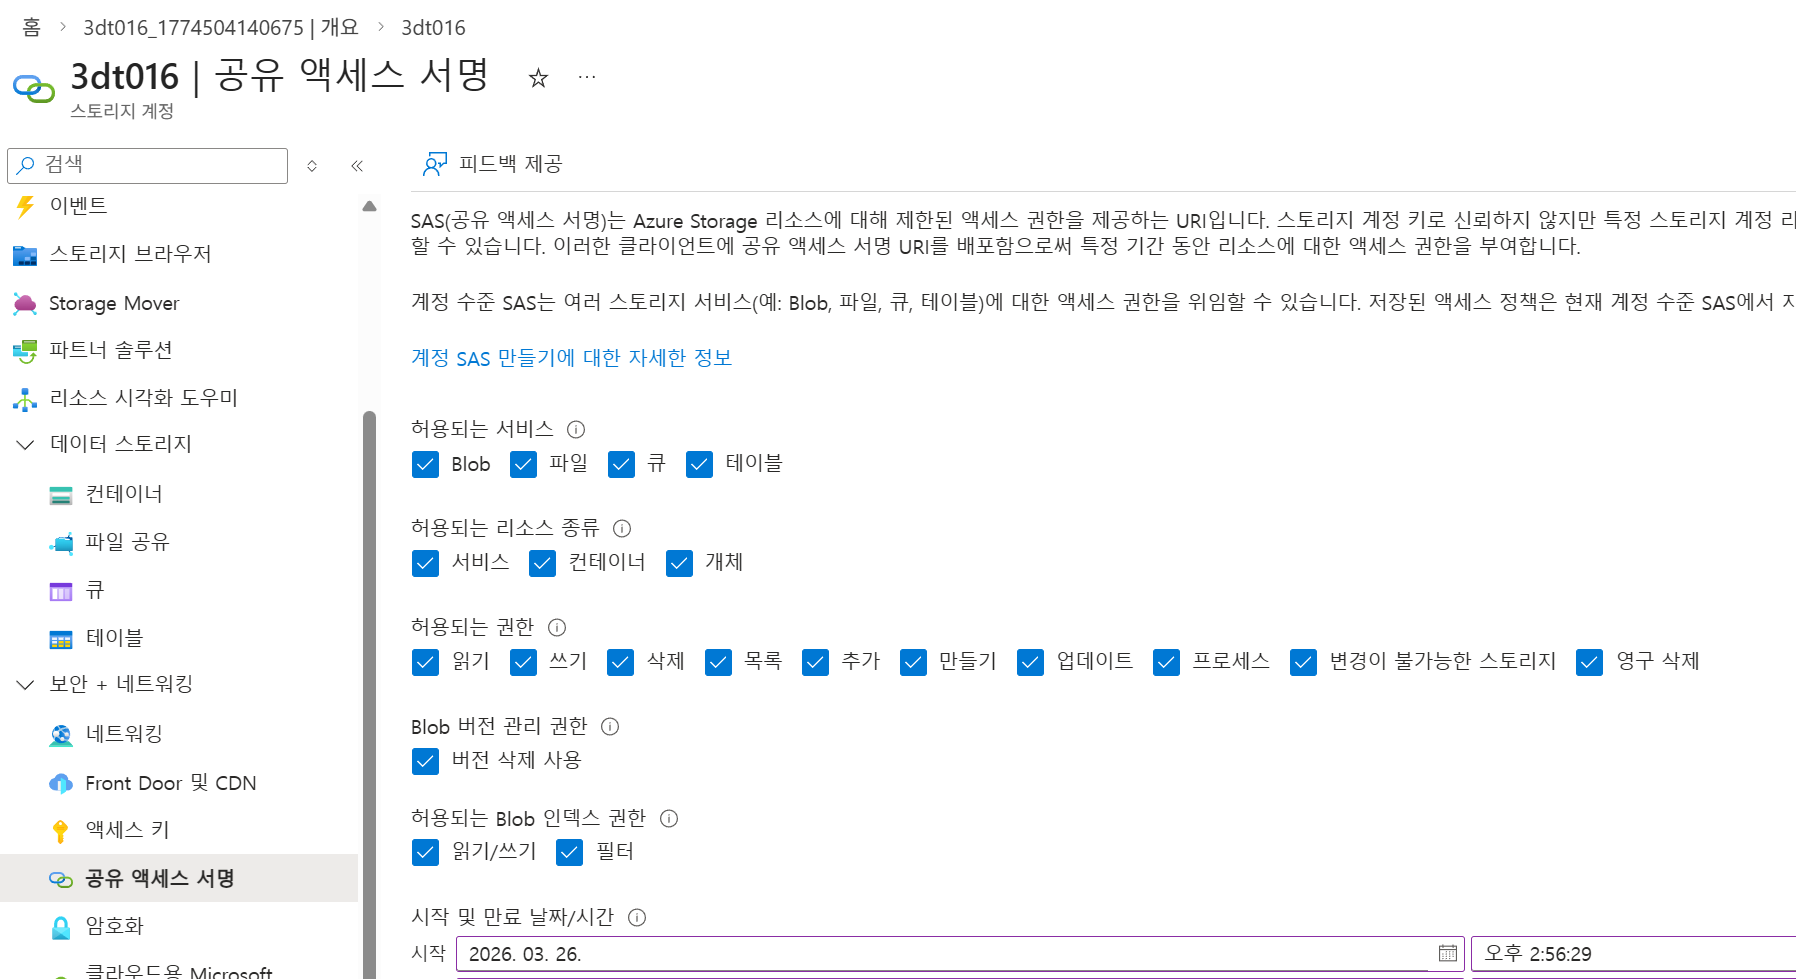
이후 하단의 SAS 및 연결 문자열 생성 클릭 후 SAS 토큰 복사
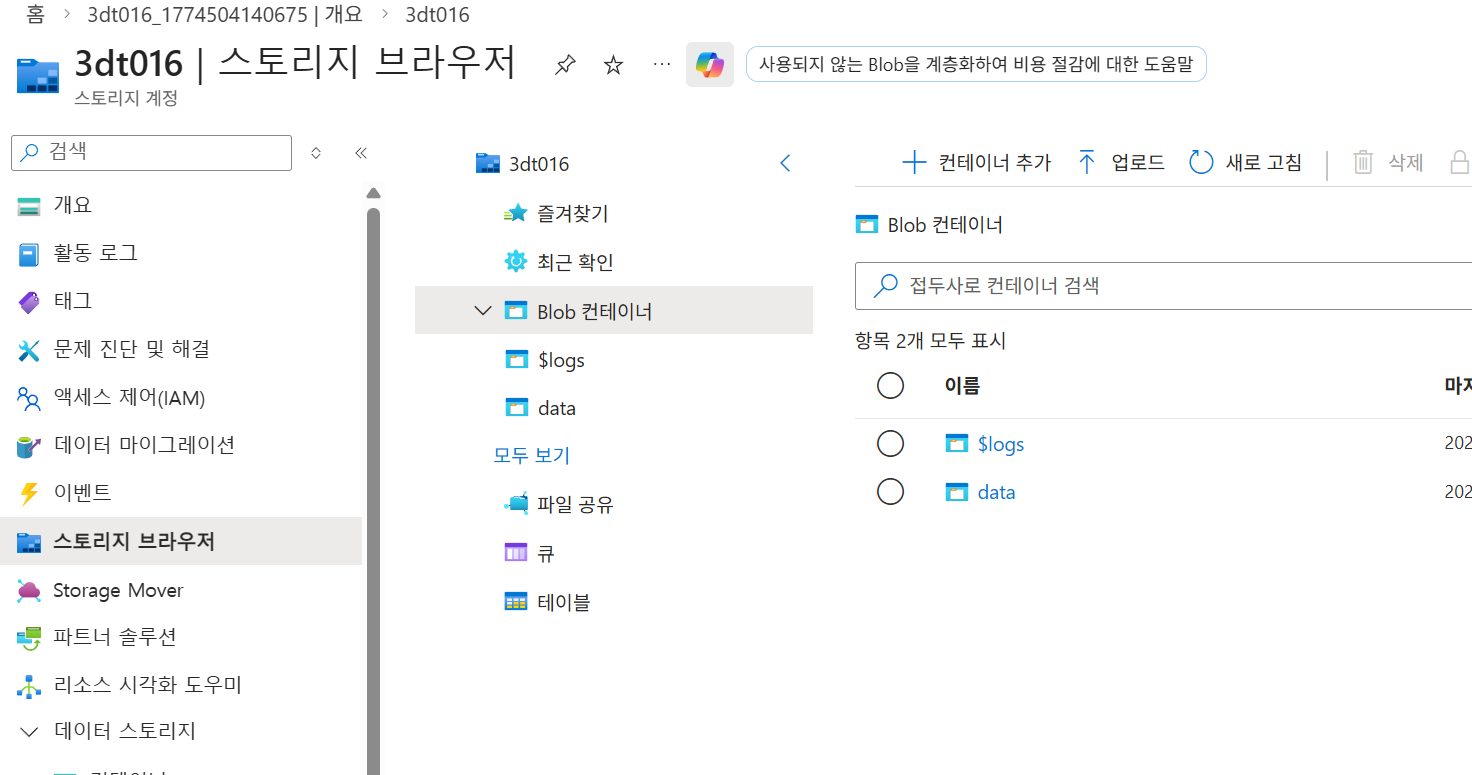
3. 컨테이너 생성
# Azure Blob Storage 연결 설정
# SAS (Shared Access Signature) 토큰으로 인증
STORAGE_ACCOUNT = ""
CONTAINER = ""

# ⚠️ 아래 SAS_TOKEN을 실제 값으로 교체하세요!
# Azure Portal → Storage Account → Shared access signature 에서 생성
SAS_TOKEN = ""

# Spark 설정에 SAS 토큰 등록
spark.conf.set(
    f"fs.azure.sas.{CONTAINER}.{STORAGE_ACCOUNT}.blob.core.windows.net",
    SAS_TOKEN
)

# 기본 경로 설정
BASE_PATH = f"wasbs://{CONTAINER}@{STORAGE_ACCOUNT}.blob.core.windows.net"

print(f"✅ Azure Storage 연결 설정 완료")
print(f"   Storage Account: {STORAGE_ACCOUNT}")
print(f"   Container: {CONTAINER}")
print(f"   Base Path: {BASE_PATH}")
# 연결 테스트 — 컨테이너 내 파일 목록 확인
try:
files = dbutils.fs.ls(BASE_PATH)
print(f"✅ 연결 성공! {len(files)}개 항목 발견:\n")
for f in files[:20]:
size_kb = f.size / 1024
print(f" {f.name:40s} {size_kb:>10.1f} KB")
if len(files) > 20:
print(f" ... 외 {len(files) - 20}개")
except Exception as e:
print(f"❌ 연결 실패: {e}")
print("\n🔧 확인사항:")
print(" 1. SAS_TOKEN이 올바른지 확인")
print(" 2. SAS 토큰의 만료 기간 확인")
print(" 3. 컨테이너 이름이 정확한지 확인")
print(" 4. SAS 토큰에 Read, List 권한이 있는지 확인")Auto Loader 동작 원리:
1. 클라우드 스토리지에 새 파일이 도착
2. Auto Loader가 자동으로 감지 (체크포인트로 추적)
3. 새 파일만 읽어서 처리
4. Delta 테이블에 적재
5. 체크포인트 업데이트 → 다음에는 더 새로운 파일만 처리
Step 2: 샘플 데이터 준비 — CSV 파일 업로드
# 샘플 CSV 데이터 생성 (IoT 센서 데이터 시뮬레이션)
from pyspark.sql import functions as F
from pyspark.sql.types import StructType, StructField, StringType, DoubleType, TimestampType, IntegerType
import datetime

CATALOG = "3dt016_databricks"
SCHEMA = "autoloader"

# 배치 1: 기본 IoT 센서 데이터
batch1_data = [
    ("sensor_001", "temperature", 23.5, "2024-03-01 10:00:00", "building_A"),
    ("sensor_001", "temperature", 24.1, "2024-03-01 10:05:00", "building_A"),
    ("sensor_002", "humidity", 65.3, "2024-03-01 10:00:00", "building_A"),
    ("sensor_002", "humidity", 64.8, "2024-03-01 10:05:00", "building_A"),
    ("sensor_003", "temperature", 21.2, "2024-03-01 10:00:00", "building_B"),
    ("sensor_003", "temperature", 21.8, "2024-03-01 10:05:00", "building_B"),
    ("sensor_004", "pressure", 1013.2, "2024-03-01 10:00:00", "building_B"),
    ("sensor_004", "pressure", 1013.5, "2024-03-01 10:05:00", "building_B"),
]

batch1_schema = StructType([
    StructField("sensor_id", StringType()),
    StructField("metric_type", StringType()),
    StructField("value", DoubleType()),
    StructField("timestamp", StringType()),
    StructField("location", StringType()),
])

batch1_df = spark.createDataFrame(batch1_data, batch1_schema)

# CSV로 저장 (스토리지에 업로드)
UPLOAD_PATH = f"{BASE_PATH}/autoloader_lab/incoming"
batch1_df.coalesce(1).write.mode("overwrite").option("header", "true").csv(f"{UPLOAD_PATH}/batch_001")

print(f"✅ 배치 1 업로드 완료: {UPLOAD_PATH}/batch_001")
print(f"   {batch1_df.count()}개 레코드")
display(batch1_df)
Step 3: Auto Loader로 스트리밍 수집
cloudFiles 포맷을 사용하여 Auto Loader를 설정합니다.
새 파일이 도착하면 자동으로 감지하여 처리합니다.
# Auto Loader 설정
SOURCE_PATH = f"{BASE_PATH}/autoloader_lab/incoming"
CHECKPOINT_PATH = f"{BASE_PATH}/autoloader_lab/_checkpoint"
TARGET_TABLE = f"{CATALOG}.{SCHEMA}.iot_sensor_autoloader"

# cloudFiles 포맷으로 스트리밍 읽기
stream_df = (
    spark.readStream
    .format("cloudFiles")                            # Auto Loader!
    .option("cloudFiles.format", "csv")              # 소스 파일 포맷
    .option("header", "true")                        # CSV 헤더 있음
    .option("cloudFiles.schemaLocation", CHECKPOINT_PATH + "/schema")  # 스키마 저장 위치
    .option("cloudFiles.schemaEvolutionMode", "addNewColumns")  # 새 컬럼 자동 추가
    .load(SOURCE_PATH)
    # 수집 메타데이터 추가
    .withColumn("ingestion_timestamp", F.current_timestamp())
    .withColumn("source_file", F.input_file_name())
)

print("✅ Auto Loader 스트림 설정 완료")
print(f"   소스: {SOURCE_PATH}")
print(f"   체크포인트: {CHECKPOINT_PATH}")
print(f"   대상 테이블: {TARGET_TABLE}")
스트림 시작 — Delta 테이블로 적재
# 스트리밍 쓰기 시작
query = (
    stream_df.writeStream
    .format("delta")
    .outputMode("append")
    .option("checkpointLocation", CHECKPOINT_PATH)
    .option("mergeSchema", "true")              # 스키마 변경 자동 병합
    .trigger(availableNow=True)                 # 현재 가용한 데이터만 처리 후 종료
    # .trigger(processingTime="10 seconds")     # 10초마다 새 파일 체크 (연속 실행 시)
    .toTable(TARGET_TABLE)
)

# 스트림 완료 대기
query.awaitTermination()
print(f"✅ 배치 처리 완료!")
# 적재된 데이터 확인
result_df = spark.table(TARGET_TABLE)
print(f"📊 현재 적재된 레코드 수: {result_df.count()}")
display(result_df.orderBy("timestamp"))Step 4: 새 파일 도착 시뮬레이션 — 증분 처리 확인
# 배치 2: 새로운 센서 데이터 (다른 시간대)
batch2_data = [
    ("sensor_001", "temperature", 25.3, "2024-03-01 11:00:00", "building_A"),
    ("sensor_002", "humidity", 62.1, "2024-03-01 11:00:00", "building_A"),
    ("sensor_005", "co2", 420.5, "2024-03-01 11:00:00", "building_C"),
    ("sensor_005", "co2", 435.2, "2024-03-01 11:05:00", "building_C"),
    ("sensor_006", "temperature", 19.8, "2024-03-01 11:00:00", "building_C"),
]

batch2_df = spark.createDataFrame(batch2_data, batch1_schema)
batch2_df.coalesce(1).write.mode("overwrite").option("header", "true").csv(f"{UPLOAD_PATH}/batch_002")

print(f"✅ 배치 2 업로드 완료: {UPLOAD_PATH}/batch_002")
print(f"   {batch2_df.count()}개 새 레코드 (새 센서 sensor_005, sensor_006 포함)")
# Auto Loader 재실행 — 새 파일(batch_002)만 처리됨!
query2 = (
spark.readStream
.format("cloudFiles")
.option("cloudFiles.format", "csv")
.option("header", "true")
.option("cloudFiles.schemaLocation", CHECKPOINT_PATH + "/schema")
.option("cloudFiles.schemaEvolutionMode", "addNewColumns")
.load(SOURCE_PATH)
.withColumn("ingestion_timestamp", F.current_timestamp())
.withColumn("source_file", F.input_file_name())
.writeStream
.format("delta")
.outputMode("append")
.option("checkpointLocation", CHECKPOINT_PATH)
.option("mergeSchema", "true")
.trigger(availableNow=True)
.toTable(TARGET_TABLE)
)
query2.awaitTermination()
print(f"✅ 증분 처리 완료!")# 전체 데이터 확인 — batch_001 + batch_002 모두 있어야 함
result_df = spark.table(TARGET_TABLE)
print(f"📊 총 레코드 수: {result_df.count()} (배치1: 8 + 배치2: 5 = 13)")
print(f"\n📍 위치별 레코드 수:")
display(result_df.groupBy("location").count().orderBy("location"))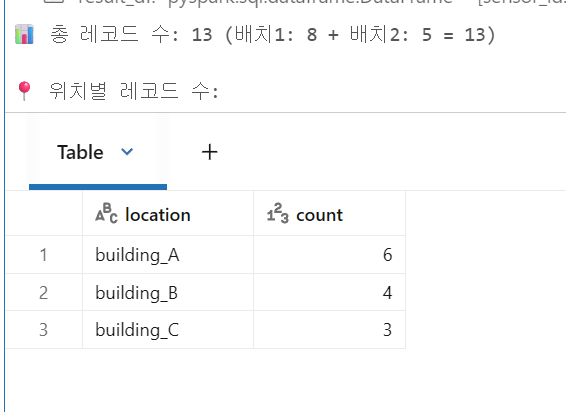
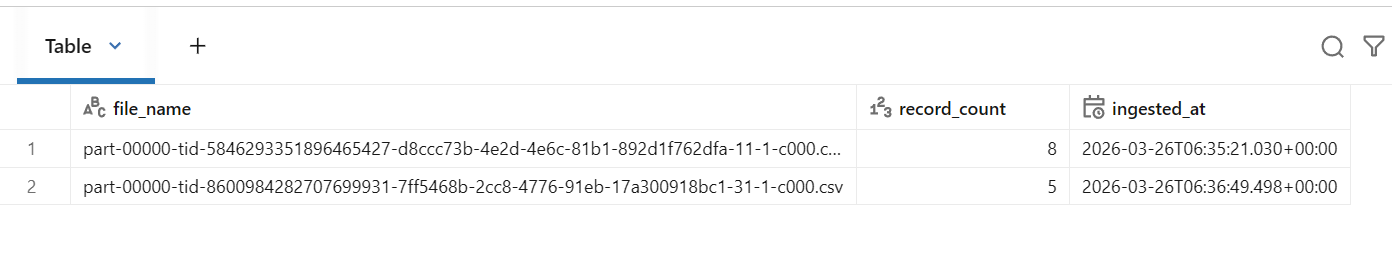
# 소스 파일별 수집 현황 확인
print("📁 소스 파일별 수집 현황:")
display(
    result_df
    .withColumn("file_name", F.regexp_extract("source_file", r"([^/]+)$", 1))
    .groupBy("file_name")
    .agg(
        F.count("*").alias("record_count"),
        F.min("ingestion_timestamp").alias("ingested_at")
    )
    .orderBy("ingested_at")
)
Step 5: Schema Evolution 체험 — 새 컬럼 추가
# 배치 3: 새로운 컬럼(unit, status) 추가된 데이터
batch3_data = [
    ("sensor_001", "temperature", 26.1, "2024-03-01 12:00:00", "building_A", "celsius", "normal"),
    ("sensor_002", "humidity", 58.9, "2024-03-01 12:00:00", "building_A", "percent", "warning"),
    ("sensor_007", "vibration", 0.05, "2024-03-01 12:00:00", "building_D", "mm/s", "normal"),
]

batch3_schema = StructType([
    StructField("sensor_id", StringType()),
    StructField("metric_type", StringType()),
    StructField("value", DoubleType()),
    StructField("timestamp", StringType()),
    StructField("location", StringType()),
    StructField("unit", StringType()),       # 새 컬럼!
    StructField("status", StringType()),     # 새 컬럼!
])

batch3_df = spark.createDataFrame(batch3_data, batch3_schema)
batch3_df.coalesce(1).write.mode("overwrite").option("header", "true").csv(f"{UPLOAD_PATH}/batch_003")

print(f"✅ 배치 3 업로드 완료 (새 컬럼 unit, status 추가)")
display(batch3_df)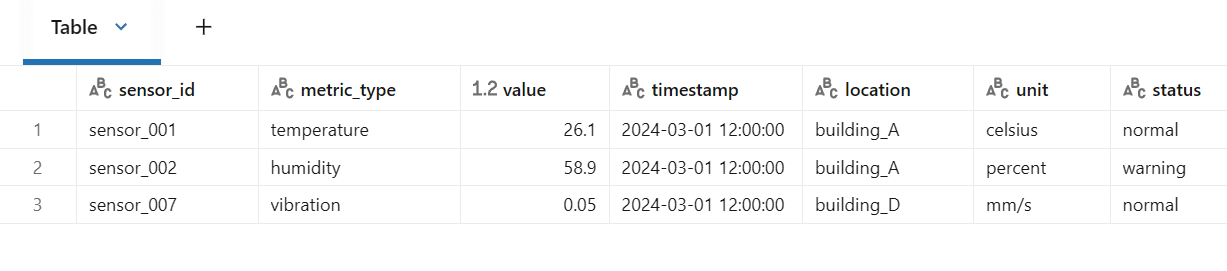
# Auto Loader 재실행 — 새 컬럼이 자동으로 추가됨!
# addNewColumns 모드에서는 새 컬럼 감지 시 스키마를 업데이트한 뒤 스트림이 종료됨
# 재시작하면 업데이트된 스키마로 정상 처리됨
for attempt in range(3):
    try:
        query3 = (
            spark.readStream
            .format("cloudFiles")
            .option("cloudFiles.format", "csv")
            .option("header", "true")
            .option("cloudFiles.schemaLocation", CHECKPOINT_PATH + "/schema")
            .option("cloudFiles.schemaEvolutionMode", "addNewColumns")
            .load(SOURCE_PATH)
            .withColumn("ingestion_timestamp", F.current_timestamp())
            .withColumn("source_file", F.input_file_name())
            .writeStream
            .format("delta")
            .outputMode("append")
            .option("checkpointLocation", CHECKPOINT_PATH)
            .option("mergeSchema", "true")
            .trigger(availableNow=True)
            .toTable(TARGET_TABLE)
        )

        query3.awaitTermination()
        print(f"✅ Schema Evolution 처리 완료!")
        break
    except Exception as e:
        if "UNKNOWN_FIELD_EXCEPTION" in str(e):
            print(f"🔄 새 컬럼 감지로 스키마 업데이트됨, 재시작 중... (시도 {attempt + 1})")
            continue
        else:
            raise
# 스키마 확인 — unit, status 컬럼이 자동으로 추가되었는지 확인
result_df = spark.table(TARGET_TABLE)
print(f"📊 총 레코드 수: {result_df.count()}")
print(f"\n📋 현재 스키마:")
result_df.printSchema()
print(f"\n💡 batch_001, batch_002의 unit, status는 null (해당 컬럼이 없었으므로)")
display(result_df.orderBy("timestamp").limit(20))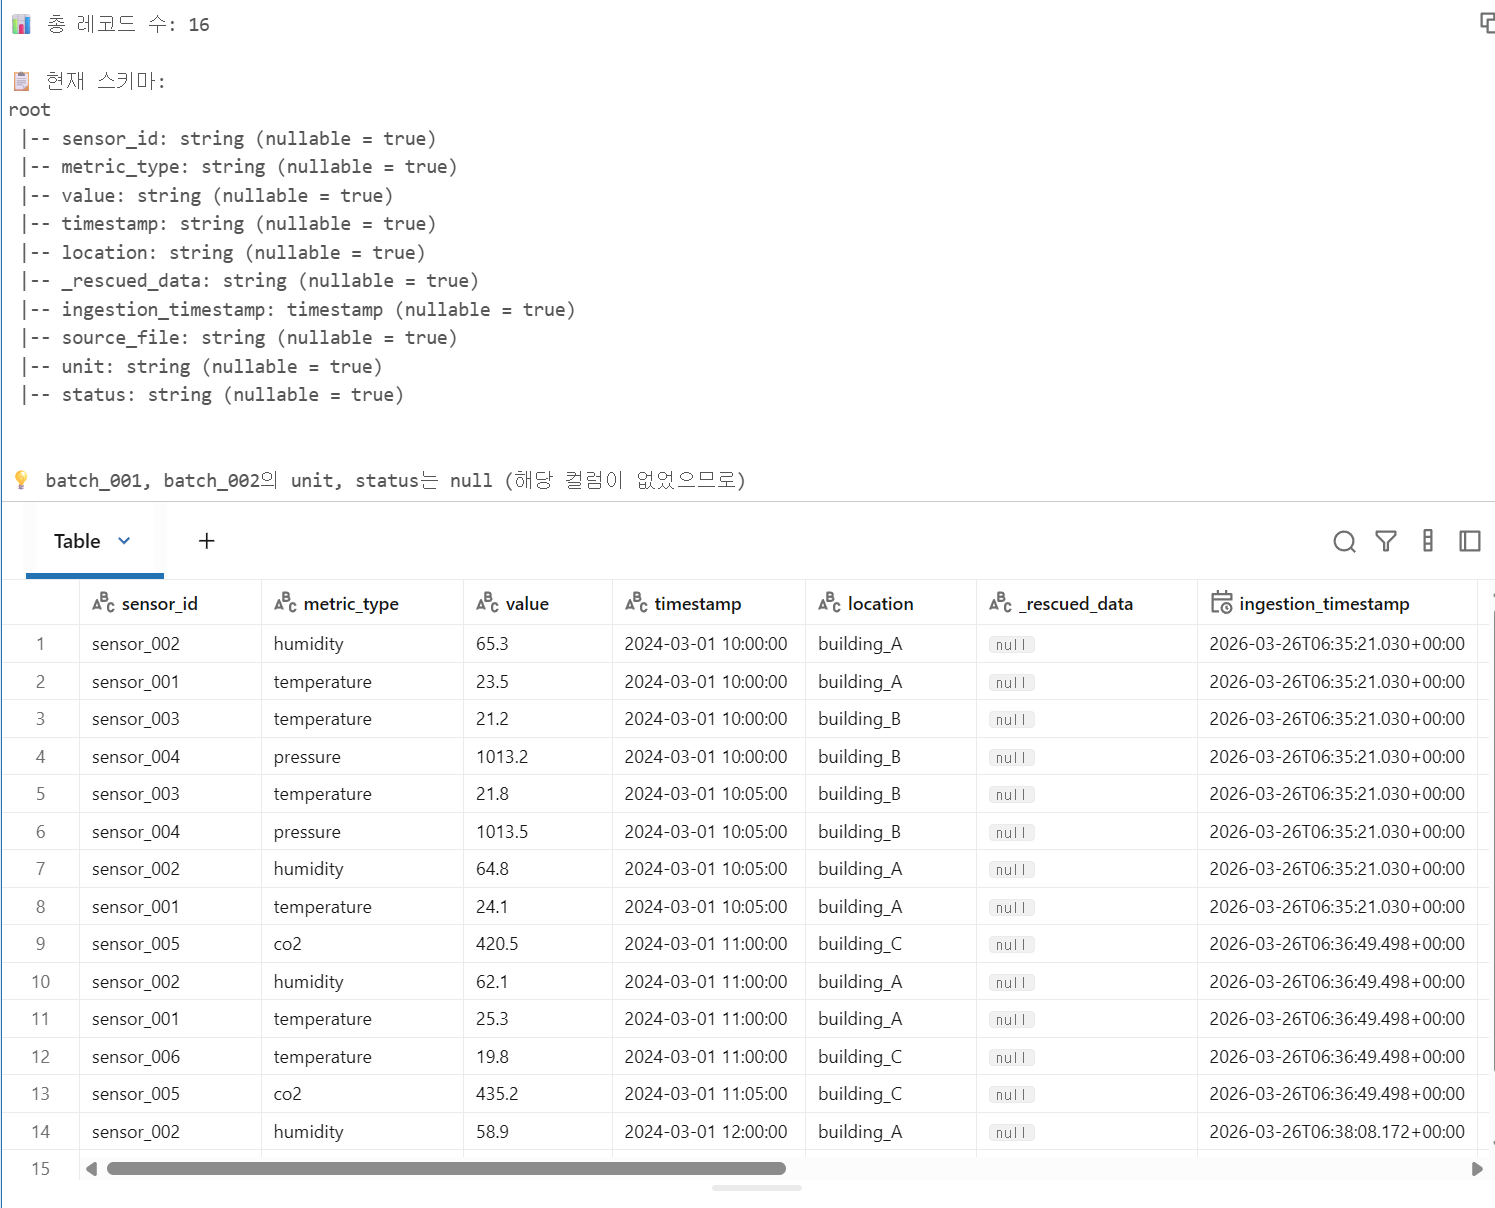
Step 6: 데이터 품질 모니터링
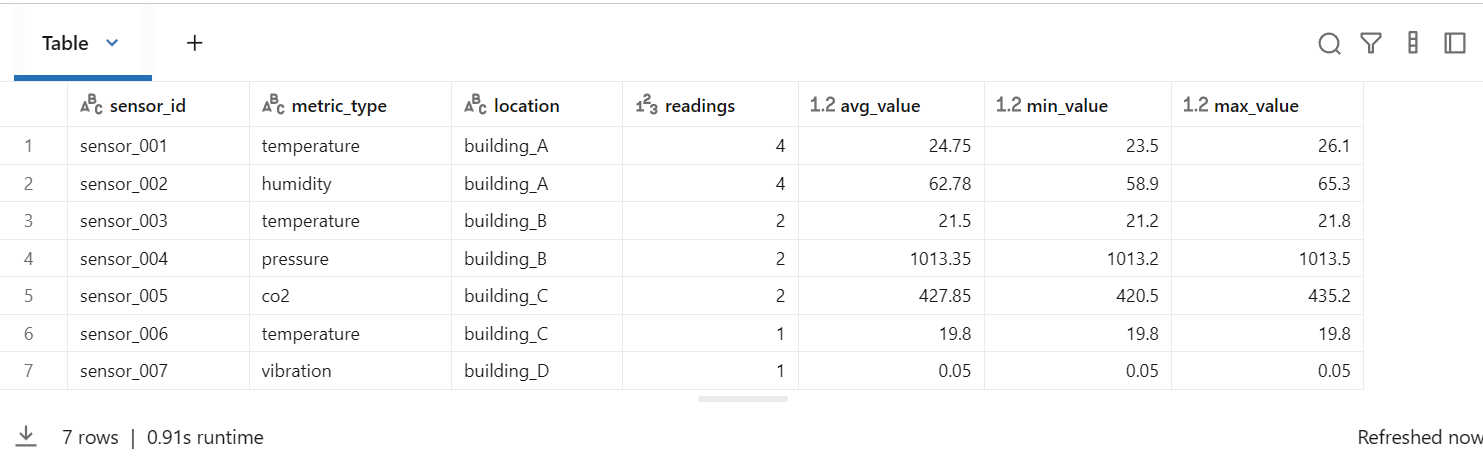
# 수집된 데이터 요약 통계
print("📊 센서별 통계:")
display(
    result_df
    .groupBy("sensor_id", "metric_type", "location")
    .agg(
        F.count("*").alias("readings"),
        F.round(F.avg("value"), 2).alias("avg_value"),
        F.round(F.min("value"), 2).alias("min_value"),
        F.round(F.max("value"), 2).alias("max_value"),
    )
    .orderBy("location", "sensor_id")
)
# 수집 이력 시각화
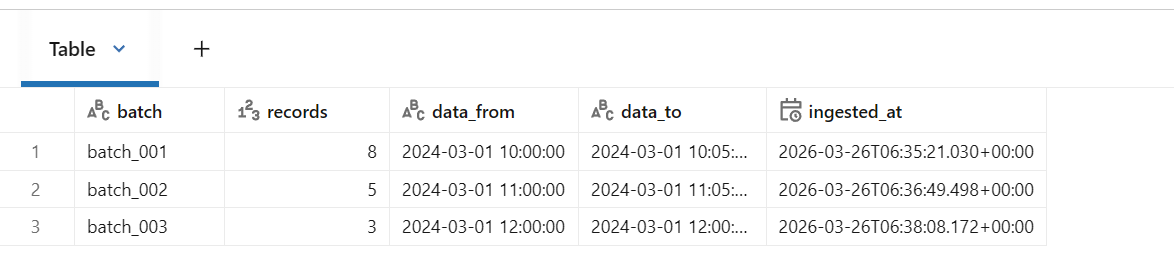
print("📈 배치별 수집 이력:")
display(
result_df
.withColumn("batch", F.regexp_extract("source_file", r"(batch_\d+)", 1))
.groupBy("batch")
.agg(
F.count("*").alias("records"),
F.min("timestamp").alias("data_from"),
F.max("timestamp").alias("data_to"),
F.min("ingestion_timestamp").alias("ingested_at"),
)
.orderBy("batch")
)
정리
| 기능 | 코드 | 설명 |
|---|---|---|
| Auto Loader 읽기 | spark.readStream.format("cloudFiles") | 클라우드 스토리지의 새 파일 자동 감지 |
| 파일 포맷 지정 | .option("cloudFiles.format", "csv") | CSV, JSON, Parquet 등 지원 |
| 스키마 진화 | .option("cloudFiles.schemaEvolutionMode", "addNewColumns") | 새 컬럼 자동 추가 |
| 체크포인트 | .option("checkpointLocation", path) | 처리 위치 저장, 정확히 한 번 처리 보장 |
| 트리거 | .trigger(availableNow=True) | 배치 모드 (현재 데이터만 처리 후 종료) |
| 연속 실행 | .trigger(processingTime="10 seconds") | 10초마다 새 파일 체크 (실시간 수집) |
| 메타데이터 | F.input_file_name() | 소스 파일 경로 추적 |
메달리온 아키텍처 기반 데이터 파이프라인 + ML
- Bronze Layer: Raw 데이터 수집 및 저장
- Silver Layer: 데이터 정제, 검증, 통합
- Gold Layer: 비즈니스 레벨 집계 및 Feature Store
- ML Layer: 고객 이탈(Churn) 예측 모델
1. 개요
이번 실습에서는 E-commerce 데이터를 기준으로 메달리온 아키텍처를 구성했다.
- Bronze에서는 원본 데이터를 그대로 적재하고
- Silver에서는 타입 변환, 정제, 조인 등을 수행하고
- Gold에서는 분석 및 머신러닝에 사용할 집계 테이블과 Feature를 생성했다
- 마지막으로 ML Layer에서 고객 이탈 예측 모델을 학습했다
실제 노트북 실행 결과 기준으로 데이터 규모는 다음과 같았다. Bronze와 Silver는 각각 고객 10,000건, 상품 500건, 주문 39,777건, 활동 로그 523,286건이 적재되었고, Gold에는 customer_360 10,000건, product_sales 500건, monthly_revenue 47건이 생성되었다.
2. 환경 설정 및 라이브러리
from pyspark.sql import SparkSession
from pyspark.sql.functions import *
from pyspark.sql.types import *
from pyspark.sql.window import Window
from delta.tables import DeltaTable

import pandas as pd
from datetime import datetime, timedelta
import random

# ML 라이브러리
from pyspark.ml.feature import VectorAssembler, StandardScaler, StringIndexer
from pyspark.ml.classification import RandomForestClassifier
from pyspark.ml.evaluation import BinaryClassificationEvaluator
from pyspark.ml import Pipeline

# MLflow
import mlflow
import mlflow.spark

random.seed(42)
3. 샘플 데이터 생성
실제 프로덕션 환경에서는 Azure Event Hub, Blob Storage, CDC 등의 외부 소스에서 데이터를 가져오겠지만, 이번 실습에서는 샘플 데이터를 직접 생성했다.
생성한 데이터는 다음 4종이다.
- 고객 데이터 (
customers) - 상품 데이터 (
products) - 주문 데이터 (
orders) - 고객 활동 로그 (
customer_activity)
3.1 고객 데이터 생성
customer_data = []

for i in range(1, 10001):
    customer_data.append({
        'customer_id': f'C{i:06d}',
        'name': f'Customer_{i}',
        'email': f'customer{i}@email.com',
        'country': random.choice(['USA', 'UK', 'Germany', 'France', 'Japan', 'Korea', 'Canada']),
        'registration_date': (datetime(2022, 1, 1) + timedelta(days=random.randint(0, 730))).strftime('%Y-%m-%d'),
        'customer_segment': random.choice(['Premium', 'Standard', 'Basic']),
        'age': random.randint(18, 70),
        'gender': random.choice(['M', 'F', 'Other'])
    })

df_customers_raw = spark.createDataFrame(customer_data)
display(df_customers_raw.limit(10))
output 예시
고객 수: 10,000+---+-------+-----------+----------------+--------------------+------+-----------+----------+
|age|country|customer_id|customer_segment|email |gender|name |registration_date|
+---+-------+-----------+----------------+--------------------+------+-----------+----------+
|65 |Korea |C000001 |Premium |customer1@email.com |F |Customer_1 |2022-04-25|
|55 |UK |C000002 |Premium |customer2@email.com |M |Customer_2 |2022-08-17|
|55 |Korea |C000003 |Premium |customer3@email.com |F |Customer_3 |2023-07-13|
...고객 원천 데이터는 총 10,000건 생성되었다.
3.2 상품 데이터 생성
categories = ['Electronics', 'Clothing', 'Home', 'Sports', 'Books', 'Toys']

product_schema = StructType([
    StructField("product_id", StringType(), False),
    StructField("product_name", StringType(), False),
    StructField("category", StringType(), False),
    StructField("price", DoubleType(), False),
    StructField("stock_quantity", IntegerType(), False),
    StructField("supplier", StringType(), False)
])

product_data = []

for i in range(1, 501):
    category = random.choice(categories)
    product_data.append({
        'product_id': f'P{i:04d}',
        'product_name': f'{category}_Product_{i}',
        'category': category,
        'price': float(round(random.uniform(10, 1000), 2)),
        'stock_quantity': int(random.randint(0, 500)),
        'supplier': f'Supplier_{random.randint(1, 20)}'
    })

df_products_raw = spark.createDataFrame(product_data, schema=product_schema)
display(df_products_raw.limit(10))
output 예시
상품 수: 500+----------+----------------------+-----------+------+--------------+-----------+
|product_id|product_name |category |price |stock_quantity|supplier |
+----------+----------------------+-----------+------+--------------+-----------+
|P0001 |Toys_Product_1 |Toys |238.09|440 |Supplier_14|
|P0002 |Clothing_Product_2 |Clothing |407.88|182 |Supplier_20|
|P0003 |Electronics_Product_3 |Electronics|943.35|171 |Supplier_1 |
...상품 원천 데이터는 총 500건 생성되었다.
3.3 주문 데이터 생성
order_data = []
order_id = 1

for customer in customer_data[:5000]:
    num_orders = random.randint(1, 15)
    reg_date = datetime.strptime(customer['registration_date'], '%Y-%m-%d')

    for _ in range(num_orders):
        order_date = reg_date + timedelta(days=random.randint(1, 700))
        product = random.choice(product_data)
        quantity = random.randint(1, 5)

        order_data.append({
            'order_id': f'O{order_id:08d}',
            'customer_id': customer['customer_id'],
            'product_id': product['product_id'],
            'order_date': order_date.strftime('%Y-%m-%d %H:%M:%S'),
            'quantity': quantity,
            'unit_price': product['price'],
            'total_amount': float(round(product['price'] * quantity, 2)),
            'status': random.choice(['Completed', 'Completed', 'Completed', 'Cancelled', 'Returned']),
            'payment_method': random.choice(['Credit Card', 'PayPal', 'Bank Transfer', 'Cash'])
        })
        order_id += 1

df_orders_raw = spark.createDataFrame(order_data)
display(df_orders_raw.limit(10))
output 예시
주문 수: 39,777+-----------+-------------------+----------+--------------+--------+---------+----------+------------+
|customer_id|order_date |order_id |payment_method|product_id|quantity|status |total_amount|
+-----------+-------------------+----------+--------------+--------+---------+----------+------------+
|C000001 |2022-10-28 00:00:00|O00000001 |Cash |P0172 |4 |Completed |1601.20 |
|C000001 |2022-10-31 00:00:00|O00000002 |PayPal |P0194 |4 |Returned |2668.56 |
|C000001 |2022-11-27 00:00:00|O00000003 |Cash |P0414 |2 |Completed |1895.08 |
...주문 원천 데이터는 총 39,777건 생성되었다.
3.4 고객 활동 로그 생성
activity_data = []
activity_id = 1

for customer in customer_data:
    num_activities = random.randint(5, 100)
    reg_date = datetime.strptime(customer['registration_date'], '%Y-%m-%d')

    for _ in range(num_activities):
        activity_date = reg_date + timedelta(
            days=random.randint(1, 700),
            hours=random.randint(0, 23),
            minutes=random.randint(0, 59)
        )

        activity_data.append({
            'activity_id': f'A{activity_id:08d}',
            'customer_id': customer['customer_id'],
            'activity_date': activity_date.strftime('%Y-%m-%d %H:%M:%S'),
            'activity_type': random.choice(['page_view', 'product_view', 'cart_add', 'search', 'login']),
            'duration_seconds': random.randint(10, 600),
            'device': random.choice(['mobile', 'desktop', 'tablet'])
        })
        activity_id += 1

df_activity_raw = spark.createDataFrame(activity_data)
display(df_activity_raw.limit(10))
output 예시
활동 로그 수: 523,286+-------------------+----------+-------------+-----------+--------+----------------+
|activity_date |activity_id|activity_type|customer_id|device |duration_seconds|
+-------------------+----------+-------------+-----------+--------+----------------+
|2023-12-31 11:38:00|A00000001 |product_view |C000001 |tablet |137 |
|2023-12-11 04:46:00|A00000002 |product_view |C000001 |desktop |402 |
|2023-01-04 08:47:00|A00000003 |search |C000001 |tablet |44 |
...고객 활동 로그는 총 523,286건 생성되었다.
4. Bronze Layer
- Raw 데이터 그대로 저장
- 스키마 최소 변경
- 원본 보존 목적
df_customers_raw.write.format("delta").mode("overwrite").saveAsTable("bronze_customers")
df_products_raw.write.format("delta").mode("overwrite").saveAsTable("bronze_products")
df_orders_raw.write.format("delta").mode("overwrite").saveAsTable("bronze_orders")
df_activity_raw.write.format("delta").mode("overwrite").saveAsTable("bronze_customer_activity")
output 예시
BRONZE LAYER:
- bronze_customer_activity: 523,286 rows
- bronze_customers: 10,000 rows
- bronze_orders: 39,777 rows
- bronze_products: 500 rows
Bronze는 원본 데이터 수집 및 저장에 초점을 두므로, 이 단계에서는 정제보다 보존성이 핵심이다.
5. Silver Layer
- 데이터 정제
- 타입 변환
- 중복 제거
- 파생 컬럼 생성
- 조인 및 통합
5.1 고객 데이터 정제
df_customers_silver = spark.table("bronze_customers") \
    .withColumn("registration_date", to_date(col("registration_date"))) \
    .withColumn("email_domain", split(col("email"), "@").getItem(1)) \
    .withColumn(
        "age_group",
        when(col("age") < 25, "18-24")
        .when(col("age") < 35, "25-34")
        .when(col("age") < 45, "35-44")
        .when(col("age") < 55, "45-54")
        .otherwise("55+")
    ) \
    .withColumn("processed_date", current_timestamp()) \
    .dropDuplicates(["customer_id"]) \
    .filter(col("email").isNotNull())

display(df_customers_silver.limit(10))
output 예시
+---+-------+-----------+----------------+----------------------+--------+-----------+----------------+------------+-----------------------+
|age|country|customer_id|customer_segment|email                 |gender  |name       |registration_date|email_domain|age_group|processed_date|
+---+-------+-----------+----------------+----------------------+--------+-----------+----------------+------------+---------+-----------------------+
|43 |Korea  |C002484    |Standard        |customer2484@email.com|F       |Customer_2484|2023-01-19     |email.com   |35-44    |2026-03-26 ...|
|24 |France |C002512    |Basic           |customer2512@email.com|Other   |Customer_2512|2023-10-04     |email.com   |18-24    |2026-03-26 ...|
...
고객 Silver 테이블은 registration_date를 date 타입으로 변환하고, email_domain과 age_group을 새로 만들었다. 실제 데이터 품질 검증 결과 중복 고객 수 0건, 이메일 NULL 고객 수 0건이었다.
5.2 상품 데이터 정제
df_products_silver = spark.table("bronze_products") \
    .withColumn(
        "price_category",
        when(col("price") < 50, "Low")
        .when(col("price") < 200, "Medium")
        .when(col("price") < 500, "High")
        .otherwise("Premium")
    ) \
    .withColumn("in_stock", col("stock_quantity") > 0) \
    .withColumn("processed_date", current_timestamp()) \
    .dropDuplicates(["product_id"]) \
    .filter(col("price") > 0)

display(df_products_silver.limit(10))
output 예시
+----------+----------------------+-----------+------+--------------+-----------+--------------+--------+-----------------------+
|product_id|product_name          |category   |price |stock_quantity|supplier   |price_category|in_stock|processed_date         |
+----------+----------------------+-----------+------+--------------+-----------+--------------+--------+-----------------------+
|P0092     |Books_Product_92      |Books      |424.25|486           |Supplier_9 |High          |true    |2026-03-26 ...|
|P0112     |Sports_Product_112    |Sports     |770.13|147           |Supplier_8 |Premium       |true    |2026-03-26 ...|
...
상품 Silver 테이블에서는 가격 구간과 재고 여부를 추가했다. 데이터 품질 검증 결과 유효하지 않은 가격 제품 수는 0건이었다.
5.3 주문 데이터 정제 및 고객/상품 조인
df_orders_silver = spark.table("bronze_orders") \
    .withColumn("order_date", to_timestamp(col("order_date"))) \
    .withColumn("order_year", year(col("order_date"))) \
    .withColumn("order_month", month(col("order_date"))) \
    .withColumn("order_quarter", quarter(col("order_date"))) \
    .withColumn("order_dayofweek", dayofweek(col("order_date"))) \
    .withColumn("is_weekend", col("order_dayofweek").isin([1, 7])) \
    .withColumn("revenue", when(col("status") == "Completed", col("total_amount")).otherwise(0)) \
    .withColumn("processed_date", current_timestamp()) \
    .dropDuplicates(["order_id"]) \
    .filter(col("quantity") > 0)

df_orders_silver = df_orders_silver \
    .join(
        df_customers_silver.select("customer_id", "customer_segment", "country", "age_group"),
        "customer_id",
        "left"
    ) \
    .join(
        df_products_silver.select("product_id", "category", "price_category"),
        "product_id",
        "left"
    )

display(df_orders_silver.limit(10))
output 예시
+----------+-----------+-------------------+----------+--------------+--------+---------+----------+------------+----------+-----------+-------------+---------------+-------+---------+-----------+--------------+
|product_id|customer_id|order_date         |order_id  |payment_method|quantity|status   |total_amount|unit_price |order_year|order_month|order_quarter|order_dayofweek|is_weekend|revenue|customer_segment|category|price_category|
+----------+-----------+-------------------+----------+--------------+--------+---------+----------+------------+----------+-----------+-------------+---------------+-------+---------+-----------+--------------+
|P0334     |C002508    |2024-11-05 00:00:00|O00020014 |Credit Card   |3       |Completed|1220.58    |406.86     |2024      |11         |4            |3              |false     |1220.58|Premium        |Sports  |High|
|P0261     |C002510    |2023-04-24 00:00:00|O00020024 |Cash          |4       |Cancelled|2062.56    |515.64     |2023      |4          |2            |2              |false     |0.0    |Premium        |Books   |Premium|
...
주문 Silver에서는 시간 파생 컬럼과 revenue 컬럼을 만들고, 고객/상품 정보까지 조인했다. 품질 검증 결과 수량 이상 주문 수는 0건이었다.
5.4 고객 활동 데이터 정제
df_activity_silver = spark.table("bronze_customer_activity") \
    .withColumn("activity_date", to_timestamp(col("activity_date"))) \
    .withColumn("activity_year", year(col("activity_date"))) \
    .withColumn("activity_month", month(col("activity_date"))) \
    .withColumn("activity_hour", hour(col("activity_date"))) \
    .withColumn("is_active_hours", col("activity_hour").between(9, 21)) \
    .withColumn("processed_date", current_timestamp()) \
    .dropDuplicates(["activity_id"])

display(df_activity_silver.limit(10))
output 예시
+-------------------+----------+-------------+-----------+--------+----------------+-------------+--------------+-------------+---------------+-----------------------+
|activity_date      |activity_id|activity_type|customer_id|device  |duration_seconds|activity_year|activity_month|activity_hour|is_active_hours|processed_date         |
+-------------------+----------+-------------+-----------+--------+----------------+-------------+--------------+-------------+---------------+-----------------------+
|2022-10-07 02:44:00|A00000061 |search       |C000002    |desktop |322             |2022         |10            |2            |false          |2026-03-26 ...|
|2024-11-25 02:19:00|A00000118 |login        |C000003    |tablet  |231             |2024         |11            |2            |false          |2026-03-26 ...|
...
5.5 Silver Layer 저장 결과
df_customers_silver.write.format("delta").mode("overwrite").saveAsTable("silver_customers")
df_products_silver.write.format("delta").mode("overwrite").saveAsTable("silver_products")
df_orders_silver.write.format("delta").mode("overwrite").saveAsTable("silver_orders")
df_activity_silver.write.format("delta").mode("overwrite").saveAsTable("silver_customer_activity")
output 예시
SILVER LAYER:
- silver_customer_activity: 523,286 rows
- silver_customers: 10,000 rows
- silver_orders: 39,777 rows
- silver_products: 500 rows
Silver는 단순 저장 계층이 아니라, 이후 분석과 ML에 바로 활용할 수 있도록 데이터를 정제하고 의미 있게 변환하는 계층이다.
6. Gold Layer
- 비즈니스 메트릭 집계
- 고객/상품 관점 분석
- 머신러닝용 Feature Table 생성
6.1 고객별 주문 통계
df_customer_order_stats = spark.table("silver_orders") \
    .groupBy("customer_id") \
    .agg(
        count("order_id").alias("total_orders"),
        sum("total_spent").alias("total_spent"),
        avg("total_amount").alias("avg_order_value"),
        max("order_date").alias("last_order_date"),
        min("order_date").alias("first_order_date"),
        sum(when(col("status") == "Completed", 1).otherwise(0)).alias("completed_orders"),
        sum(when(col("status") == "Cancelled", 1).otherwise(0)).alias("cancelled_orders"),
        sum(when(col("status") == "Returned", 1).otherwise(0)).alias("returned_orders"),
        countDistinct("product_id").alias("unique_products"),
        countDistinct("category").alias("unique_categories")
    )

display(df_customer_order_stats.limit(10))
output 예시
+-----------+------------+-----------+---------------+-------------------+-------------------+----------------+----------------+---------------+---------------+-----------------+
|customer_id|total_orders |total_spent|avg_order_value|last_order_date    |first_order_date   |completed_orders|cancelled_orders|returned_orders|unique_products|unique_categories|
+-----------+------------+-----------+---------------+-------------------+-------------------+----------------+----------------+---------------+---------------+-----------------+
|C003194    |8           |5284.30    |660.5375       |2024-06-24 00:00:00|2022-09-15 00:00:00|4               |1               |3              |8              |5|
|C003128    |8           |6651.05    |831.38125      |2024-04-25 00:00:00|2022-11-17 00:00:00|8               |0               |0              |8              |5|
...
실제 결과를 보면 고객별 주문 수, 총 결제 금액, 평균 주문 금액, 완료/취소/반품 수 등이 집계된다.
6.2 고객별 활동 통계
df_customer_activity_stats = spark.table(<"silver_customer_activity") \
    .groupBy("customer_id") \
    .agg(
        count("*").alias("total_activities"),
        sum("duration_seconds").alias("total_duration_seconds"),
        avg("duration_seconds").alias("avg_duration_seconds"),
        max("activity_date").alias("last_activity_date"),
        sum(when(col("activity_type") == "page_view", 1).otherwise(0)).alias("page_views"),
        sum(when(col("activity_type") == "product_view", 1).otherwise(0)).alias("product_views"),
        sum(when(col("activity_type") == "cart_add", 1).otherwise(0)).alias("cart_adds"),
        sum(when(col("activity_type") == "search", 1).otherwise(0)).alias("searches"),
        sum(when(col("activity_type") == "login", 1).otherwise(0)).alias("logins")
    )

display(df_customer_activity_stats.limit(10))
output 예시
+-----------+----------------+----------------------+--------------------+-------------------+----------+-------------+---------+--------+------+
|customer_id|total_activities|total_duration_seconds|avg_duration_seconds|last_activity_date |page_views|product_views|cart_adds|searches|logins|
+-----------+----------------+----------------------+--------------------+-------------------+----------+-------------+---------+--------+------+
|C000805    |50              |18044                 |360.88              |2025-09-21 15:13:00|12        |10           |12       |6       |13|
|C001875    |77              |24167                 |313.8571            |2025-09-09 07:13:00|11        |18           |14       |13      |25|
...
고객의 행동량과 세션 지속 시간, 이벤트별 빈도를 함께 볼 수 있다.
6.3 고객 360도 뷰 생성
df_customer_360 = spark.table("silver_customers") \
    .join(df_customer_order_stats, "customer_id", "left") \
    .join(df_customer_activity_stats, "customer_id", "left") \
    .fillna(0)

display(df_customer_360.limit(10))
output 예시
+-----------+---+-------+----------------+----------------------+--------+-----------+----------------+------------+---------+------------+------------+-----------+---------------+-------------------+-------------------+----------------+----------------+---------------+---------------+-----------------+----------------+----------------------+--------------------+-------------------+----------+-------------+---------+--------+------+
|customer_id|age|country|customer_segment|email                 |gender  |name       |registration_date|email_domain|age_group|total_orders|total_spent |avg_order_value|last_order_date|first_order_date|completed_orders|cancelled_orders|returned_orders|unique_products|unique_categories|total_activities|total_duration_seconds|avg_duration_seconds|last_activity_date|page_views|product_views|cart_adds|searches|logins|
+-----------+---+-------+----------------+----------------------+--------+-----------+----------------+------------+---------+------------+-----------+---------------+-------------------+-------------------+----------------+----------------+---------------+---------------+-----------------+----------------+----------------------+--------------------+-------------------+----------+-------------+---------+--------+------+
|C003194    |38 |USA    |Premium         |customer3194@email.com|Other   |Customer_3194|2022-08-31    |email.com   |35-44    |8           |5284.30    |660.5375       |2024-06-24         |2022-09-15         |4               |1               |3              |8              |5                |43              |11515                 |267.79              |2024-07-30 23:00:00|8         |14           |5        |10      |12|
...
Gold의 핵심은 이런 통합 Feature Table이다. 고객 기본 정보 + 주문 행동 + 활동 로그가 하나의 뷰로 합쳐지면서, 이후 BI나 ML에서 바로 활용 가능해진다. 실제로 이 Gold Layer에는 10,000건의 customer_360 데이터가 저장되었다.
6.4 제품 판매 분석
df_product_sales = spark.table("silver_orders") \
    .filter(col("status") == "Completed") \
    .groupBy("product_id", "category", "price_category") \
    .agg(
        count("*").alias("total_sales"),
        sum("quantity").alias("total_quantity_sold"),
        sum("revenue").alias("total_revenue"),
        avg("unit_price").alias("avg_selling_price"),
        countDistinct("customer_id").alias("unique_customers")
    )

display(df_product_sales.limit(10))
output 예시
+----------+--------+--------------+----------+-------------------+-------------+-----------------+----------------+
|product_id |category|price_category|total_sales|total_quantity_sold|total_revenue|avg_selling_price|unique_customers|
+----------+--------+--------------+----------+-------------------+-------------+-----------------+----------------+
|P0081     |Books   |Premium       |62        |163                |158489.79    |972.33           |62|
|P0139     |Books   |Premium       |53        |161                |156413.11    |971.51           |53|
...
제품별 판매량과 매출, 고객 수를 기준으로 잘 팔리는 상품을 바로 확인할 수 있다. Gold Layer에 생성된 product_sales 테이블은 총 500건이다.
6.5 월별 매출 트렌드
df_monthly_revenue = spark.table("silver_orders") \
    .filter(col("status") == "Completed") \
    .groupBy("order_year", "order_month") \
    .agg(
        count("order_id").alias("total_orders"),
        sum("revenue").alias("total_revenue"),
        countDistinct("customer_id").alias("unique_customers"),
        avg("revenue").alias("avg_order_value")
    ) \
    .orderBy("order_year", "order_month")

display(df_monthly_revenue)
output 예시
+----------+-----------+------------+-------------+----------------+---------------+
|order_year|order_month|total_orders|total_revenue|unique_customers|avg_order_value|
+----------+-----------+------------+-------------+----------------+---------------+
|2022      |1          |22          |32431.79     |20              |1474.17|
|2022      |2          |56          |93850.61     |54              |1675.90|
...
월별 매출 트렌드 테이블은 총 47건 생성되었다. 이를 통해 월별 주문 수, 매출, 고객 수 변화를 시계열로 분석할 수 있다.
7. 데이터 품질 검증
Silver와 Gold 이후에는 데이터 품질 확인도 수행했다.
print("중복 고객 수:", duplicate_customers)
print("이메일 NULL 고객 수:", null_emails)
print("유효하지 않은 가격 제품 수:", invalid_prices)
print("수량 이상 주문 수:", invalid_quantity_orders)
output
중복 고객 수: 0
이메일 NULL 고객 수: 0
유효하지 않은 가격 제품 수: 0
수량 이상 주문 수: 0
즉, 이번 파이프라인에서는 기본적인 품질 이슈 없이 데이터가 정제되었다.
8. ML Layer - 고객 이탈 예측
Gold의 customer_360 데이터를 기반으로 고객 이탈 예측 모델을 학습했다.
8.1 Feature 데이터 준비
df_ml = df_customer_360.select(
    "customer_id",
    "total_orders",
    "total_spent",
    "avg_order_value",
    "completed_orders",
    "cancelled_orders",
    "returned_orders",
    "total_activities",
    "avg_duration_seconds",
    "logins",
    "cart_adds",
    "is_churned"
)
output 예시
전체 이탈률: 100.00%
총 고객 수: 5,000
이탈 고객 수: 5,000
그리고 실제 label 분포를 확인해보면 다음과 같았다.
+----------+-----+
|is_churned|count|
+----------+-----+
|1         |5000 |
+----------+-----+
즉, 이번 실습에서는 모든 고객이 churn=1로 라벨링되는 문제가 있었다. 이 결과는 모델 자체보다도 label 생성 로직을 다시 점검해야 한다는 신호로 보는 게 맞다.
8.2 Feature Vector 생성 및 모델 학습
feature_cols = [
    "total_orders",
    "total_spent",
    "avg_order_value",
    "completed_orders",
    "cancelled_orders",
    "returned_orders",
    "total_activities",
    "avg_duration_seconds",
    "logins",
    "cart_adds"
]

assembler = VectorAssembler(inputCols=feature_cols, outputCol="features")

rf = RandomForestClassifier(
    featuresCol="features",
    labelCol="is_churned",
    numTrees=100,
    maxDepth=5,
    seed=42
)

pipeline = Pipeline(stages=[assembler, rf])

train_df, test_df = df_ml.randomSplit([0.8, 0.2], seed=42)
model = pipeline.fit(train_df)
predictions = model.transform(test_df)
8.3 모델 평가
evaluator = BinaryClassificationEvaluator(
    labelCol="is_churned",
    rawPredictionCol="rawPrediction",
    metricName="areaUnderROC"
)

auc = evaluator.evaluate(predictions)
print("AUC:", auc)
해석
이번 노트북에서는 label이 전부 1로 생성되어 있어서, 모델 평가는 형식적으로는 가능하더라도 정상적인 churn 예측 실험이라고 보기 어렵다.
즉, 이 단계에서 가장 중요한 것은 모델 튜닝이 아니라 churn 정의를 현실적으로 재설계하는 것이다. 예를 들어 아래처럼 정의하는 편이 더 적절할 수 있다.
- 최근 90일 이내 주문이 없는 고객
- 최근 30일 이내 로그인/활동이 없는 고객
- 취소/반품 비율이 높고 최근 재구매가 없는 고객
9. 정리
이번 실습을 통해 메달리온 아키텍처의 흐름을 다음과 같이 확인할 수 있었다.
- Bronze Layer: 원본 데이터를 그대로 적재하여 보존
- Silver Layer: 타입 변환, 정제, 조인, 파생 컬럼 생성
- Gold Layer: 고객 360도 뷰, 제품 판매 분석, 월별 매출 트렌드 같은 비즈니스 집계 생성
- ML Layer: Gold 데이터를 기반으로 churn 예측 모델 학습 시도
특히 Gold Layer에서 생성된 customer_360은 분석과 머신러닝 모두에 활용할 수 있는 대표적인 Feature Store 형태의 결과물이라고 볼 수 있다. 반면 ML 단계에서는 label 설계가 결과를 크게 좌우한다는 점도 함께 확인할 수 있었다. Bronze/Silver/Gold 산출물의 실제 row 수와 데이터 품질 검증 결과, 그리고 ML label 분포는 모두 노트북 실행 결과에서 확인되었다.
10. 다음 단계
실시간 파이프라인 구축
- Delta Live Tables: 실시간 데이터 파이프라인 자동화
- Auto Loader: 증분 데이터 로딩
- Structured Streaming: 실시간 이벤트 처리
모델 운영
- MLflow Model Registry: 모델 버전 관리
- Model Serving: REST API로 모델 배포
- 모니터링: 모델 성능 및 드리프트 감지
고급 분석
- 제품 추천 시스템: 협업 필터링
- 고객 세그멘테이션: 클러스터링
- 수요 예측: 시계열 분석
거버넌스 & 보안
- Unity Catalog: 중앙 집중식 거버넌스
- Delta Sharing: 안전한 데이터 공유
- 액세스 제어: 세밀한 권한 관리