6-1 군집 알고리즘
- 비지도 학습(unsupervised learning)
: 타깃이 없을 때 사용하는 머신러닝 알고리즘으로 사람이 직접 가르치지 않아도 데이터를 학습할 수 있다.
!wget https://bit.ly/fruits_300_data -O fruits_300.npy
import numpy as np
fruits = np.load('fruits_300.npy')
fruits_2d = fruits.reshape(-1, 100*100)
from sklearn.decomposition import PCA
pca = PCA(n_components=50)
pca.fit(fruits_2d)
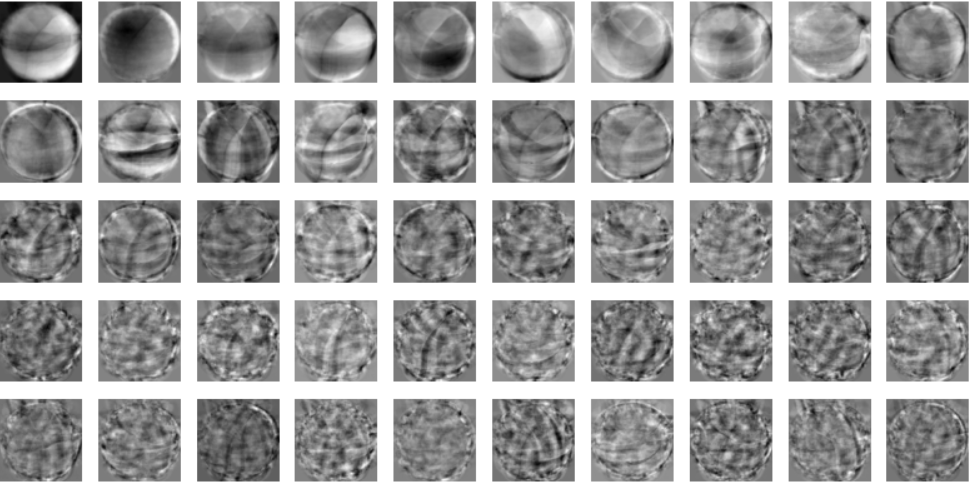
print(pca.components_.shape) -> (50, 10000)
import matplotlib.pyplot as plt
def draw_fruits(arr, ratio=1):
n = len(arr) # n은 샘플 개수입니다# 한 줄에 10개씩 이미지를 그립니다. 샘플 개수를 10으로 나누어 전체 행 개수를 계산합니다. rows = int(np.ceil(n/10)) # 행이 1개 이면 열 개수는 샘플 개수입니다. 그렇지 않으면 10개입니다. cols = n if rows < 2 else 10 fig, axs = plt.subplots(rows, cols, figsize=(cols*ratio, rows*ratio), squeeze=False) for i in range(rows): for j in range(cols): if i*10 + j < n: # n 개까지만 그립니다. axs[i, j].imshow(arr[i*10 + j], cmap='gray_r') axs[i, j].axis('off') plt.show()
drawfruits(pca.components.reshape(-1, 100, 100))
print(fruits_2d.shape) -> (300, 10000)
fruits_pca = pca.transform(fruits_2d)
print(fruits_pca.shape) -> (300, 50)
fruits_inverse = pca.inverse_transform(fruits_pca)
print(fruits_inverse.shape)
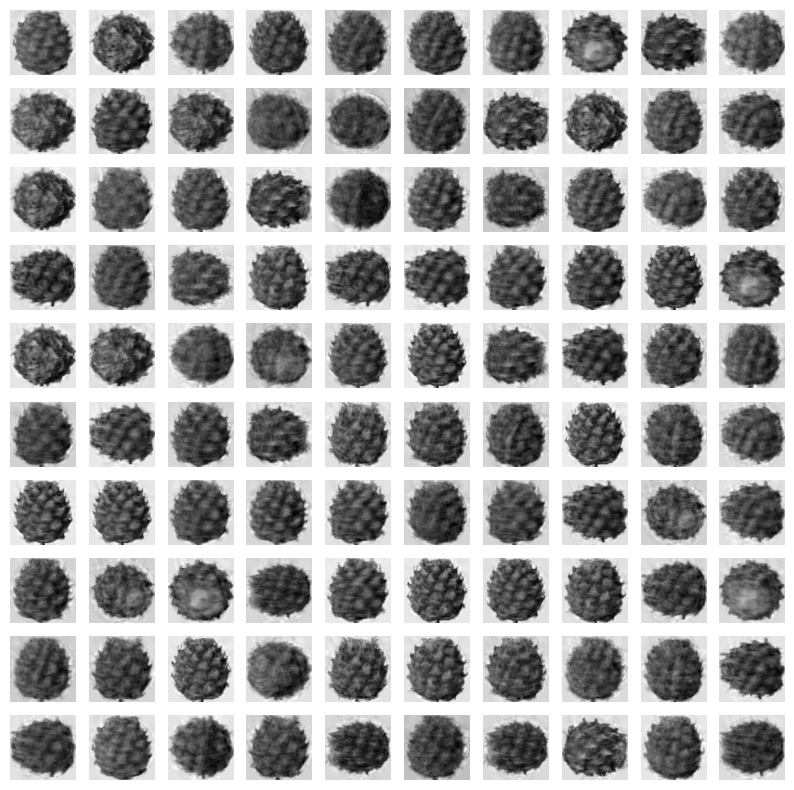
fruits_reconstruct = fruits_inverse.reshape(-1, 100, 100)
for start in [0, 100, 200]:
draw_fruits(fruits_reconstruct[start:start+100])
print("\n")
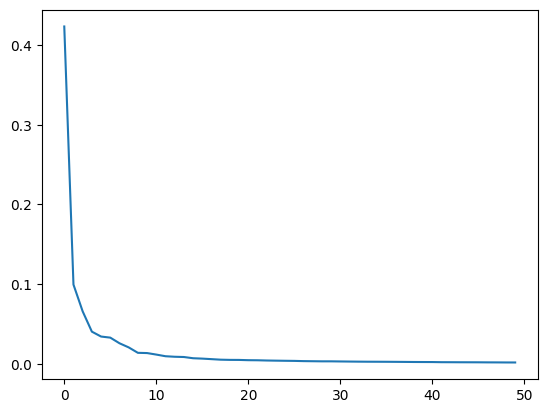
print(np.sum(pca.explainedvariance_ratio))
plt.plot(pca.explainedvariance_ratio)
from sklearn.linear_model import LogisticRegression
lr = LogisticRegression()
target = np.array([0] 100 + [1] 100 + [2] * 100)
from sklearn.model_selection import cross_validate
scores = cross_validate(lr, fruits_2d, target)
print(np.mean(scores['test_score']))
print(np.mean(scores['fit_time']))
6-2. k-평균
k-평균 알고리즘(k-means algorithm) : 처음에 랜덤하게 클러스터 중심을 정하여 클러스터를 만들고 그다음 클러스터의 중심을 이동하여 다시 클러스터를 결정하는 식으로 반복해서 최적의 클러스터를 구성하는 알고리즘.
평균값을 자동으로 찾아줌. 이 평균값이 클러스터의 중심에 위치하기 때문에 클러스터 중심 또는 센트로이드(centroid) 라고 부름.
k-평균 알고리즘의 작동 방식
-
무작위로 k개의 클러스터 중심을 정한다.
-
각 샘플에서 가장 가까운 클러스터 중심을 찾아 해당 클러스터의 샘플로 지정한다.
-
클러스터에 속한 샘플의 평균값으로 클러스터 중심을 변경한다.
-
클러스터 중심에 변화가 없을 때까지 2번으로 돌아가 반복한다.
- KMeans 클래스
!wget https://bit.ly/fruits_300_data -O fruits_300.npy
import numpy as np
fruits = np.load('fruits_300.npy')
fruits_2d = fruits.reshape(-1, 100*100) #k평균 모델을 훈련하기 위해 3차원 배열을 (샘플 개수, 너비X높이) 크기를 가진 2차원 배열로 변경
from sklearn.cluster import KMeans
km = KMeans(n_clusters=3, random_state=42)
km.fit(fruits_2d) #비지도 학습이므로 fit() 함수에서 타깃 데이터를 사용하지 않음
#군집된 결과, labels의 길이는 샘플 개수로 각 샘플이 어떤 레이블에 해당되는지 나타냄
print(km.labels)
6-3 주성분 분석
-차원과 차원 축소
- 차원: 1차원- 원소의 개수 / 2차원-행과 열
- 차원 축소: 데이터를 가장 잘 나타내는 일부 특성을 선택하여 데이터를 줄이고 지도 학습 모델의 성능을 향상시키는 방법 → 대표적인 알고리즘 : 주성분 분석(PCA)
-PCA 클래스
- 설명된 분산: 주성분이 원본 데이터의 분산을 얼마나 잘 나타내는지 기록한 값 → explainedvariance_ratio
- PCA클래스로 데이터의 특성을 크게 줄임 → 특성 개수는 작지만 변환된 데이터는 원본 데이터의 분산 대부분을 표현
- 자동으로 설명된 분산의 비율을 설정하여 원하는 비율만큼 주성분 찾기 가능
- 변환된 데이터에서 원본 데이터 복원 메소드 제공
