
" 상관관계 "
상관관계(Correlation)
두 변수 간에 어느 한 변수가 변하면 다른 변수가 함께 변하는 경향이 있는 관계
상관관계 ≠ 인과관계
"관련이 있다"는 의미, 반드시 "원인-결과(인과관계)"를 의미하지 않음
종류
- 양의 상관관계 : X가 증가하면 Y도 증가하는 관계
- 공부 시간 ↑ → 시험 점수 ↑
- 음의 상관관계 : X가 증가하면 Y는 감소하는 관계
- 운동 시간 ↑ → 체지방률 ↓
- 무상관 : 두 변수 간 변화가 관련 없음
- 신발 사이즈 ↔ IQ
" 상관계수 "
상관계수(Correlation Coefficient)
두 변수 간 선형적 관계의 강도와 방향을 수치로 나타낸 값
해석
- r = 1 : 완벽한 양의 선형 관계
- X가 증가하면 Y도 정확히 일정 비율로 증가
- r = -1 : 완벽한 음의 선형 관계
- X가 증가하면 Y는 정확히 일정 비율로 감소
- r = 0 : 선형적 관계 없음
- 비선형 관계는 존재할 수 있음
종류
- 피어슨 상관계수 : 두 변수의 선형 관계 측정
- 연속형 변수, 정규성 가정 필요
- 스피어만 상관계수 : 두 변수의 순위 일관성 측정
- 비모수적, 이상치에 강함
- 켄달의 타우 : 두 변수 간 순위 일치 쌍 및 불일치 쌍 측정
- 비모수적, 순위형 변수에 자주 사용
" 피어슨 상관계수 "
피어슨 상관계수(Pearson correlation)
두 연속형 변수 간 선형(직선) 관계의 강도와 방향을 측정
특징
- 측정 대상 : 연속형, 등간/비율 척도
- 관계 형태 : 선형 관계
- 분포 가정 : 정규성 필요 (추론 시)
- 이상치 영향 : 민감
- 장점: 해석 직관적(−1~1), 표준화되어 비교 쉬움
- 단점: 비선형 관계·순위 관계는 못 잡음, 이상치에 취약
# 예시 데이터 생성
np.random.seed(0)
study_hours = np.random.rand(100) * 10
exam_scores = 3 * study_hours + np.random.randn(100) * 5

# 데이터프레임 생성
df = pd.DataFrame({'Study Hours': study_hours, 'Exam Scores': exam_scores})

# 피어슨 상관계수 계산
pearson_corr, _ = pearsonr(df['Study Hours'], df['Exam Scores'])
print(f"피어슨 상관계수: {pearson_corr}")

# 상관관계 히트맵 시각화
sns.heatmap(df.corr(), annot=True, cmap='coolwarm', vmin=-1, vmax=1)
plt.title('pearson coefficient heatmap')
plt.show()
" 비모수 상관계수 "
비모수 상관계수
데이터 분포에 대한 가정이 필요 없는 상관계수, 스피어만, 켄달 타우 등
활용
- 데이터가 정규성을 따르지 않을 때
- 변수 간 관계가 곡선 / 단조 관계일 때
- 순위형 / 서열형 자료를 분석할 때
- 이상치가 존재하거나 극단값이 많을 때
" 스피어만 상관계수 "
스피어만 상관계수(Spearman correlation)
관측치를 순위로 바꾸어 두 변수의 순위 간의 일관성 측정, 단조(monotonic) 관계 감지에 적합
단조 관계 : 한 변수가 증가할 때 다른 변수도 계속 증가하거나 계속 감소하는 관계
특징
- 측정 대상 : 순위형, 연속형도 가능
- 관계 형태 : 단조 관계
- 분포 가정 : 비모수, 분포 자유
- 이상치 영향 : 덜 민감
- 장점: 비모수적(정규성 불필요), 비선형 단조 관계에도 의미 있음
- 단점: 순위 변환으로 정보 일부 손실 가능, 켄달 타우보다 데이터 내 편차와 에러에 민감
# 예시 데이터 생성
np.random.seed(0)
customer_satisfaction = np.random.rand(100)
repurchase_intent = 3 * customer_satisfaction + np.random.randn(100) * 0.5

# 데이터프레임 생성
df = pd.DataFrame({'Customer Satisfaction': customer_satisfaction, 'Repurchase Intent': repurchase_intent})

# 스피어만 상관계수 계산
spearman_corr, _ = spearmanr(df['Customer Satisfaction'], df['Repurchase Intent'])
print(f"스피어만 상관계수: {spearman_corr}")

# 상관관계 히트맵 시각화
sns.heatmap(df.corr(method='spearman'), annot=True, cmap='coolwarm', vmin=-1, vmax=1)
plt.title('spearman coefficient heatmap')
plt.show()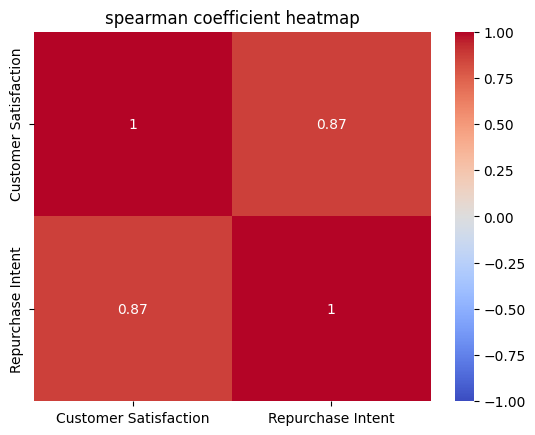
" 켄달 타우 상관계수 "
켄달 타우 상관계수(Kendall’s Tau)
관측치 쌍들 간 비율로 정의되는 순위상관 계수
특징
- 측정 대상 : 순위형, 연속형도 가능
- 관계 형태 : 단조 관계
- 분포 가정 : 비모수, 분포 자유
- 이상치 영향 : 거의 영향 없음
- 장점 : 해석이 직관적(쌍들의 일치·불일치 비율), 표본 작을 때 더 신뢰 가능
- 단점 : 계산 비용(쌍 비교)·동점 처리 복잡
# 예시 데이터 생성
np.random.seed(0)
customer_satisfaction = np.random.rand(100)
repurchase_intent = 3 * customer_satisfaction + np.random.randn(100) * 0.5

# 데이터프레임 생성
df = pd.DataFrame({'Customer Satisfaction': customer_satisfaction, 'Repurchase Intent': repurchase_intent})

# 켄달의 타우 상관계수 계산
kendall_corr, _ = kendalltau(df['Customer Satisfaction'], df['Repurchase Intent'])
print(f"켄달의 타우 상관계수: {kendall_corr}")

# 상관관계 히트맵 시각화
sns.heatmap(df.corr(method='kendall'), annot=True, cmap='coolwarm', vmin=-1, vmax=1)
plt.title('kendall coefficient heatmap')
plt.show()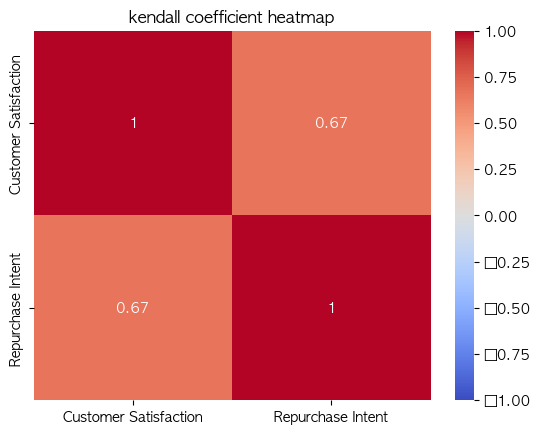
" 상호정보량 "
상호정보량(Mutual Information)
상관의 비선형 일반화, 두 변수 X, Y가 서로 얼마나 정보를 공유하는지를 수치로 나타낸 것
특징
- 선형/비선형 관계 모두 측정 가능
- 범주형 데이터에 대해서도 적용 가능
- 값 해석: 절대 값으로 해석하기보다는 상대적 크기 비교에 적합
- 독립성 판정: MI = 0이면 X와 Y는 독립
- 장점 : 비선형 관계 / 단조 관계 / 복잡한 의존성까지 포착 가능, 연속형/범주형 모두 적용 가능
- 단점 : 수치가 직관적이지 않아 해석이 어렵다, 확률분포를 추정해야 하므로 표본 수가 적으면 불안정
# 범주형 예제 데이터
X = np.array(['cat', 'dog', 'cat', 'cat', 'dog', 'dog', 'cat', 'dog', 'dog', 'cat'])
Y = np.array(['high', 'low', 'high', 'high', 'low', 'low', 'high', 'low', 'low', 'high'])

# 상호 정보량 계산
mi = mutual_info_score(X, Y)
print(f"Mutual Information (categorical): {mi:.3f}")

화이팅구리
켄달 타우 범례에 ㅁ 킹받아.. 수정쫌여 그리구 파란색 없는데 왜 파란색 범례가 있어야 돼!!! 끼에에