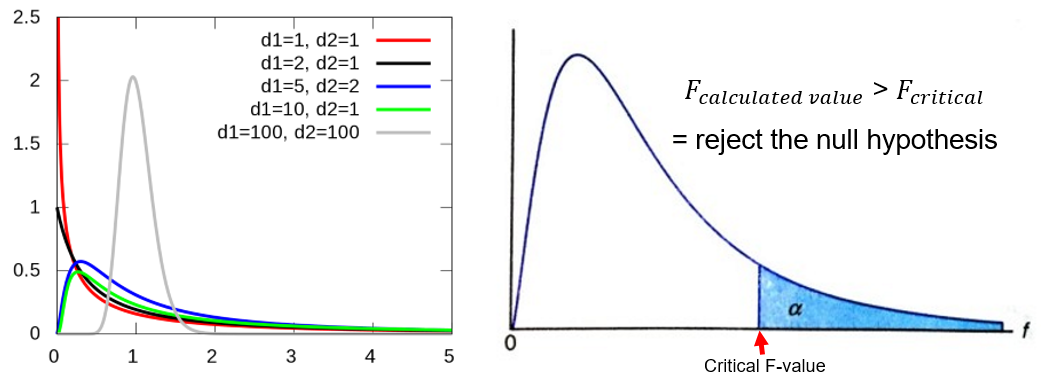
Analysis of Variance (ANOVA)는 F-test를 통해 집단의 평균이 서로 유의미하게 다른지 확인한다. 본 글에서는 F-test의 Hands-on practice를 기록한다.

Right-tail F-distribution
One way ANOVA (F-test) Hands on Calculation
F-value formula는 아래와 같다.

F-value formula
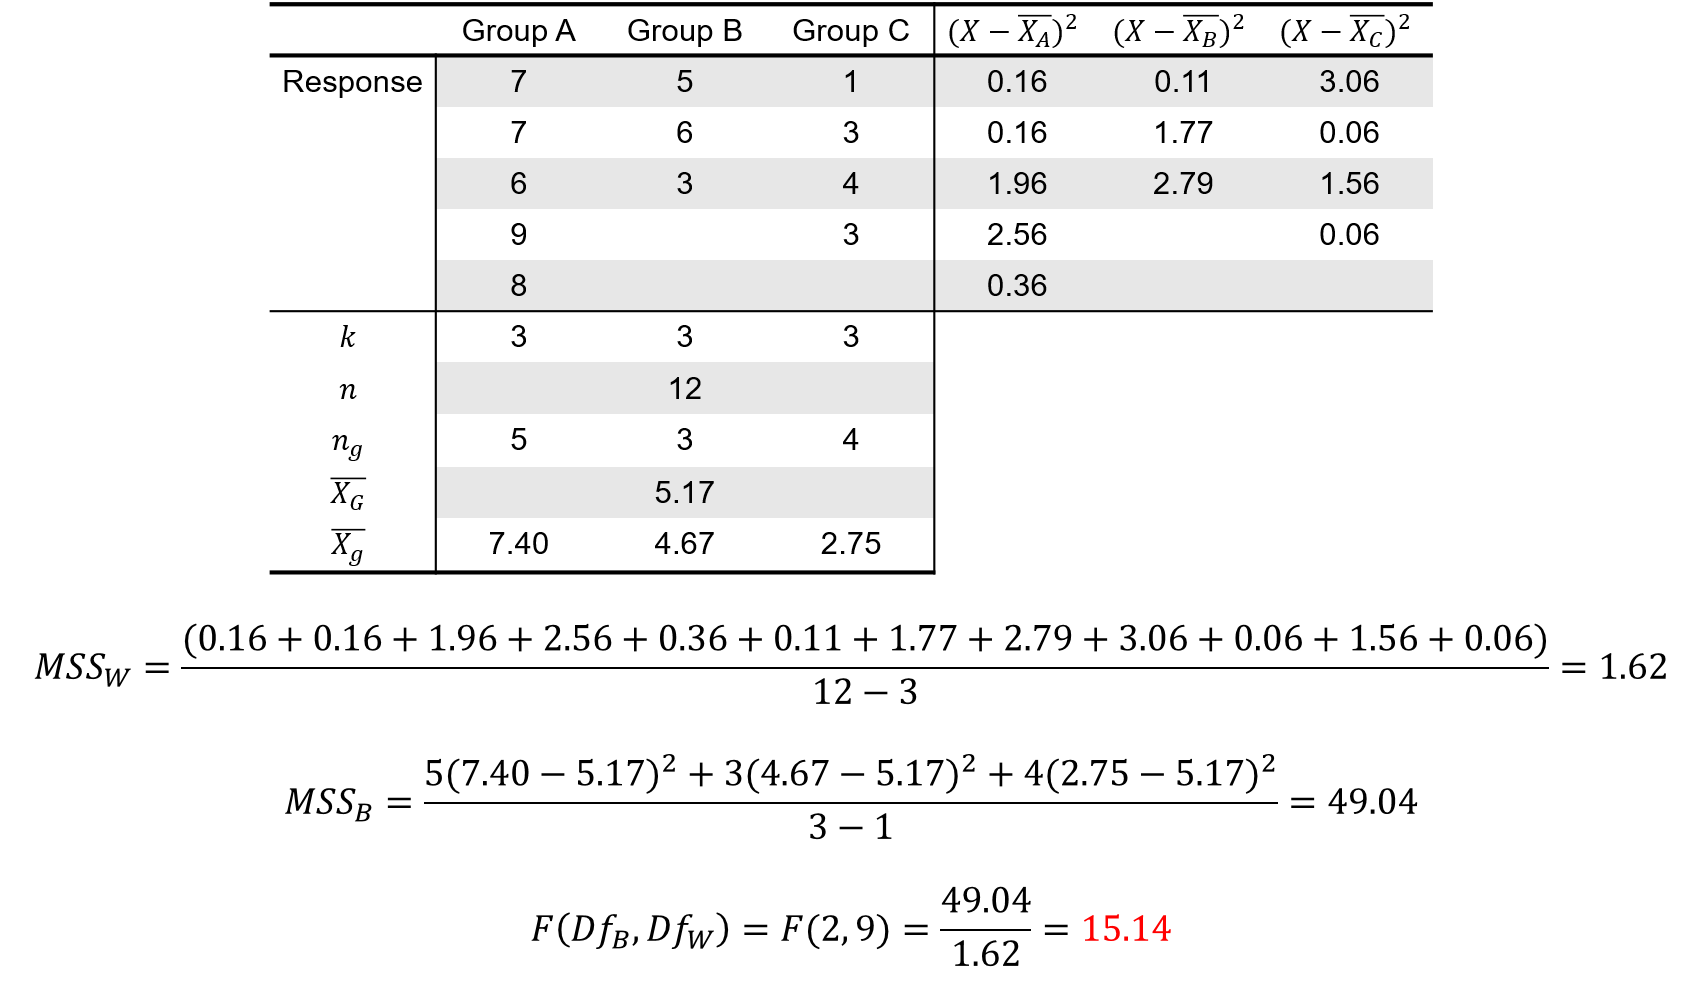
아래는 내가 임의로 만든 One way between-subjects 디자인 (Factor Levels: A, B, C) 실험의 데이터에서 F-value를 계산해본 결과이다.

Data Example & F-value Calculation

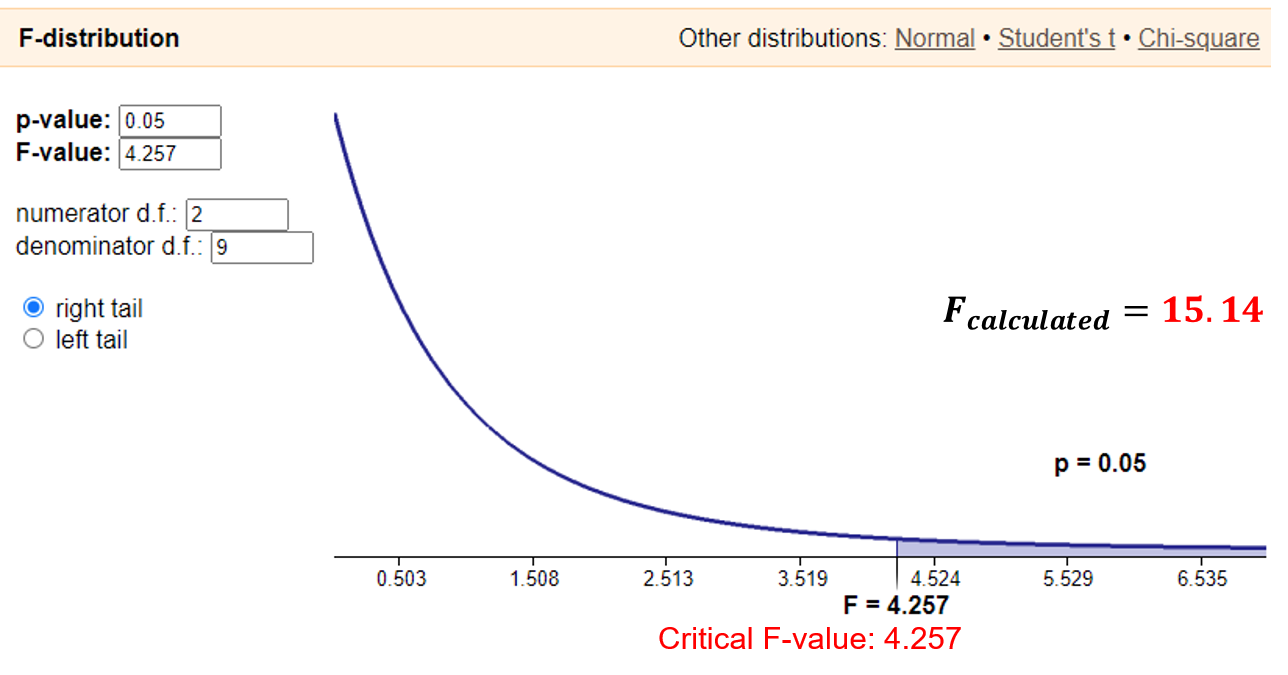
F(2,9)-distribution from StatDistributions.Com
Interpretation
F-value는 (집단 간의 분산 정도 / 집단 내 분산 정도)로 정의된다. 즉 F-value가 크다는 것은 집단 간의 차이(분산)가 크다는 것을 의미한다. 계산된 F-value가 Critical F-value보다 크면 집단 간의 차이가 통계적으로 유의미한 것으로 본다. F-distribution에서 오른쪽 적분 값이 전체 면적의 5% (p=0.05)가 되도록 Critical F-value는 설정된다. 위의 그림에서 보여지듯이 Critical F(2, 9) = 4.257, 그리고 예시 데이터 상황에서 계산된 F-value = 15.14이다. 따라서 F-test의 결과는 다음과 같다
Null Hypothesis: "Mean response of group A = .. B = .. C"
F-value > Critical F-value (p < .05). Reject the null hypothesis.
F-test를 통해 세 집단의 평균 사이에 통계적으로 유의미한 차이가 있음을 확인했다.
참고
https://www.youtube.com/watch?v=WUjsSB7E-ko
https://www.statisticshowto.com/probability-and-statistics/hypothesis-testing/f-test/#hand
https://en.wikipedia.org/wiki/F-test
http://www.statdistributions.com/f/
변경 이력
- 2021년 9월 23일: 글 등록
- 2021년 12월 1일: Velog로 이전
